S&P 500 — US Large Cap Index
 FTSE 100 — UK Blue Chips
 Euro Stoxx 50 — Eurozone Leaders
 DAX 40 — German Equities
 CAC 40 — French Market Index
 Nikkei 225 — Japan Benchmark
 Hang Seng — Hong Kong Index
 Shanghai Composite — China Mainland
 ASX 200 — Australian Market
 TSX Composite — Canada Index
 Nifty 50 — India Large Cap
 STI Index — Singapore Market
 KOSPI — South Korea Index
 Bovespa — Brazil Equities
 JSE Top 40 — South Africa Index
 IPC Index — Mexico Market

Solana Price Forecast: SOL drops to a four-month low as ETF outflows extend to six straight weeks


- Solana trades around $72 on Monday after dropping to $67.41 last week, levels not seen since the end of June.
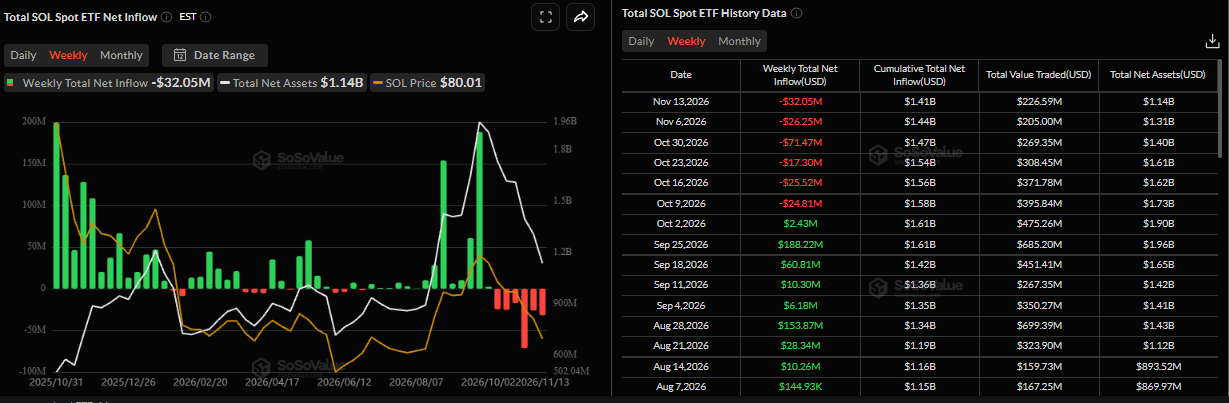
- US-listed spot ETFs recorded a $32.05 million outflow last week, marking the sixth consecutive week of withdrawals.
- Technical indicators suggest continued downside risk, despite oversold conditions, which could trigger a short-term relief bounce.
Solana (SOL) remains under pressure, trading around $72 on Monday, after hitting a four-month low of $67.41 last week. Persistent institutional selling is adding to the bearish pressure, with spot Solana Exchange Traded Funds (ETFs) recording their sixth consecutive week of net outflows.
Meanwhile, technical indicators suggest downside risks remain elevated, despite oversold conditions, which could trigger a short-term relief bounce.
Six consecutive weeks of outflows
Institutional demand for Solana has weakened since October. SoSoValue data shows SOL spot ETFs recorded $32.05 million in outflows last week, marking the sixth consecutive week of withdrawals. If this outflow trend continues and intensifies this week, it could put additional pressure on SOL, pushing its price into a deeper correction.
Solana technical outlook: Hits the lowest level in four months
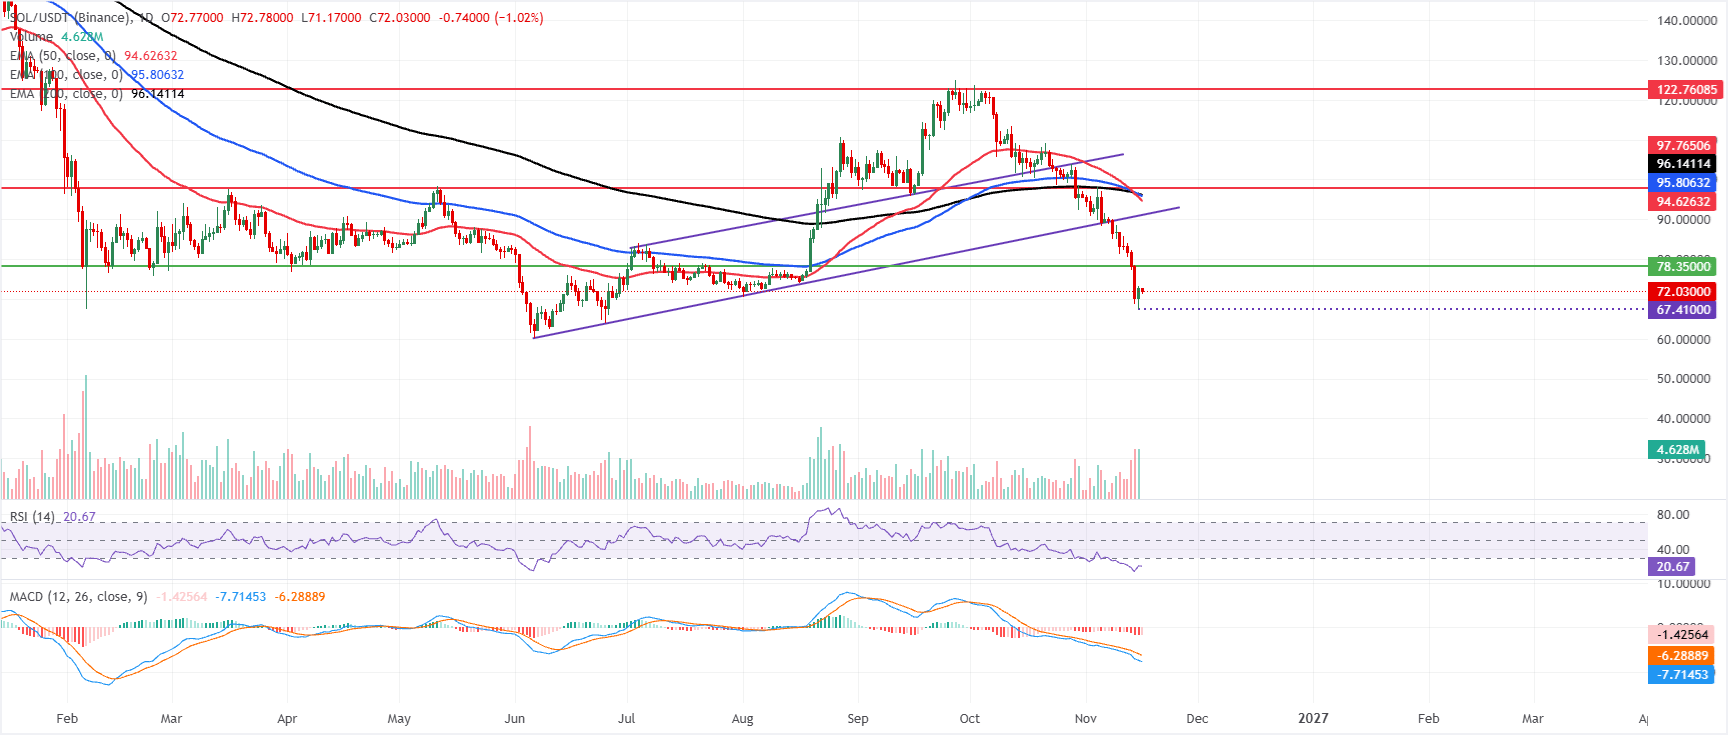
Solana price trades at $72.03 on Monday, after correcting to $67.41 the previous day, the lowest level since late June. SOL is extending a bearish near-term bias as it holds well below the 50-day, 100-day and 200-day Exponential Moving Averages (EMAs) at $94.62, $95.80 and $96.14, respectively.
SOL also trades under the former rising trendline support, now a resistance marker near $91.06, highlighting a market that remains capped by dense overhead supply. The Relative Strength Index (RSI) sits deep in oversold territory around 20. At the same time, the Moving Average Convergence Divergence (MACD) indicator stays negative, which hints at persistent downside pressure even if short-term bounces cannot be ruled out from these stretched levels.
On the topside, immediate resistance appears at the horizontal barrier around $78.35, ahead of the reclaimed trendline level at $91.06. Above that, the cluster formed by the 50-day, 100-day and 200-day EMAs between roughly $94.62 and $96.14, followed by the horizontal line at $97.77, marks a broader supply zone that would need to be cleared to neutralize the current downtrend, with a more distant obstacle at $122.76.
On the downside, with no nearby structural support from moving averages or trend lines below the current price, traders are left to monitor the oversold RSI and weak MACD readings as soft demand references that could anchor a stabilization phase before any sustained recovery attempt.