S&P 500 — US Large Cap Index
 FTSE 100 — UK Blue Chips
 Euro Stoxx 50 — Eurozone Leaders
 DAX 40 — German Equities
 CAC 40 — French Market Index
 Nikkei 225 — Japan Benchmark
 Hang Seng — Hong Kong Index
 Shanghai Composite — China Mainland
 ASX 200 — Australian Market
 TSX Composite — Canada Index
 Nifty 50 — India Large Cap
 STI Index — Singapore Market
 KOSPI — South Korea Index
 Bovespa — Brazil Equities
 JSE Top 40 — South Africa Index
 IPC Index — Mexico Market
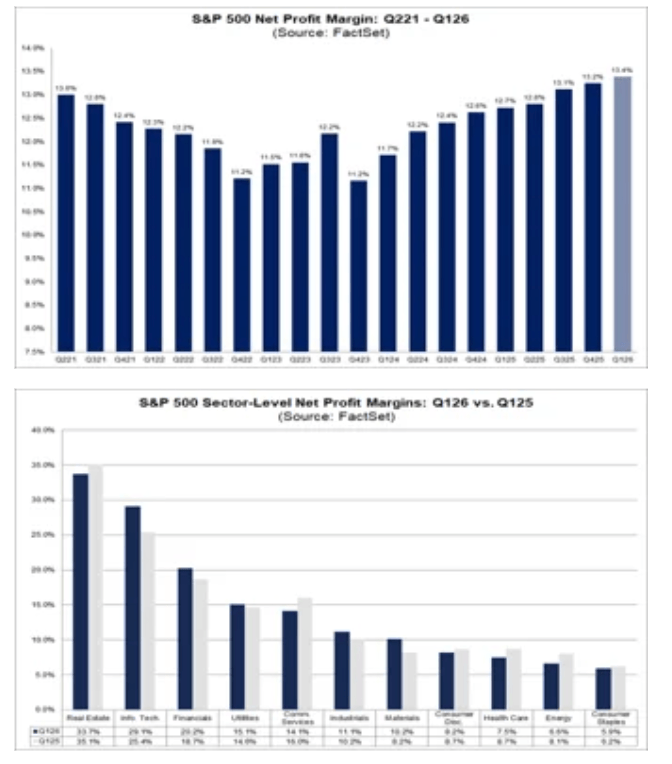
S&P 500 companies with the record net margin since 2009 – FactSet data


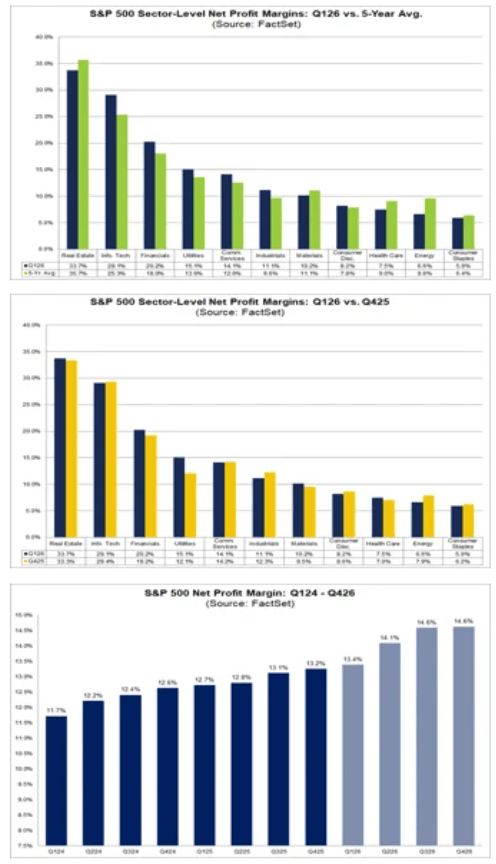
S&P 500 profit margins remain remarkably resilient despite concerns over higher oil prices. According to FactSet data, the blended net profit margin for US companies in Q1 2026 stands at 13.4% , which would mark the highest level since tracking began in 2009. Currently, 5 out of 11 sectors in the S&P 500 are reporting year-over-year margin expansion in Q1 2026 vs Q1 2025, while 6 sectors are above their 5-year average margins .
- S&P 500: Net profit margin for Q1 2026 stands at 13.4% , above the previous record of 13.2% in Q4 2025.
- Technology remains the clear leader: The IT sector reports margins of 29.1% vs 25.4% YoY , continuing to drive overall index profitability.
- Communication Services under pressure: Margins declined to 14.1% from 16.0% a year ago.
- Energy lags despite higher prices: The sector posts margins of 6.6% , well below its 5-year average of 9.6% , despite elevated oil and broader energy prices.
- Quarter-over-quarter improvement is not broad-based: Margins increased in five sectors, led by Utilities ( 15.1% vs 12.1% in Q4 2025 ), but declined in six sectors, particularly in Energy and Industrials. In Industrials, margins fell to 11.1% from 12.3% a year ago.
US500 (H1 interval) Looking at the US500 chart, the contract is attempting to hold above the EMA200 on the hourly timeframe , with the 7,140 level acting as a key support zone . Notably, Wall Street continues to price in further improvement. Consensus forecasts for S&P 500 net margins stand at 14.1% in Q2, 14.6% in Q3, and 14.6% in Q4 2026 . These assumptions appear relatively optimistic given the mixed signals coming from US consumer strength.
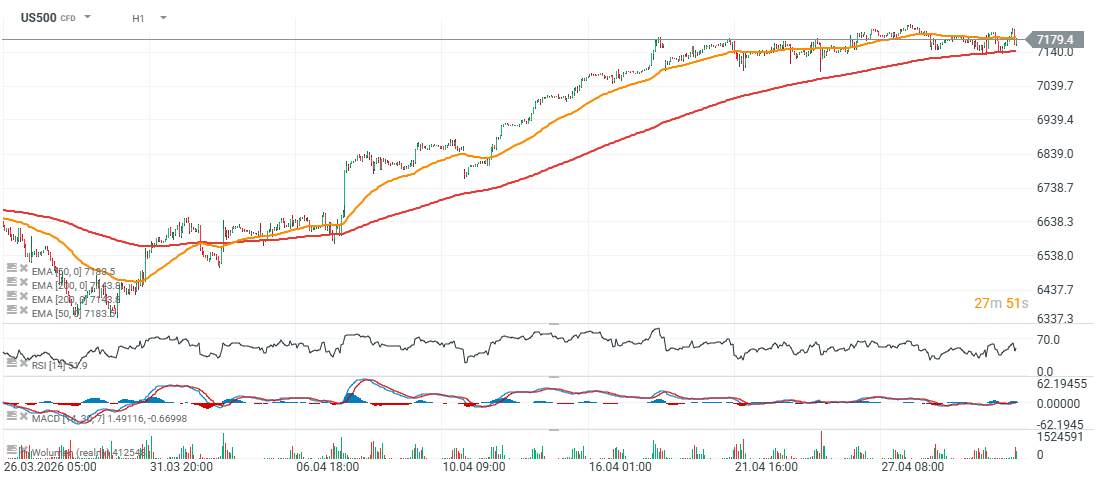
Source: xStation5
Source: FactSet
Source: FactSet