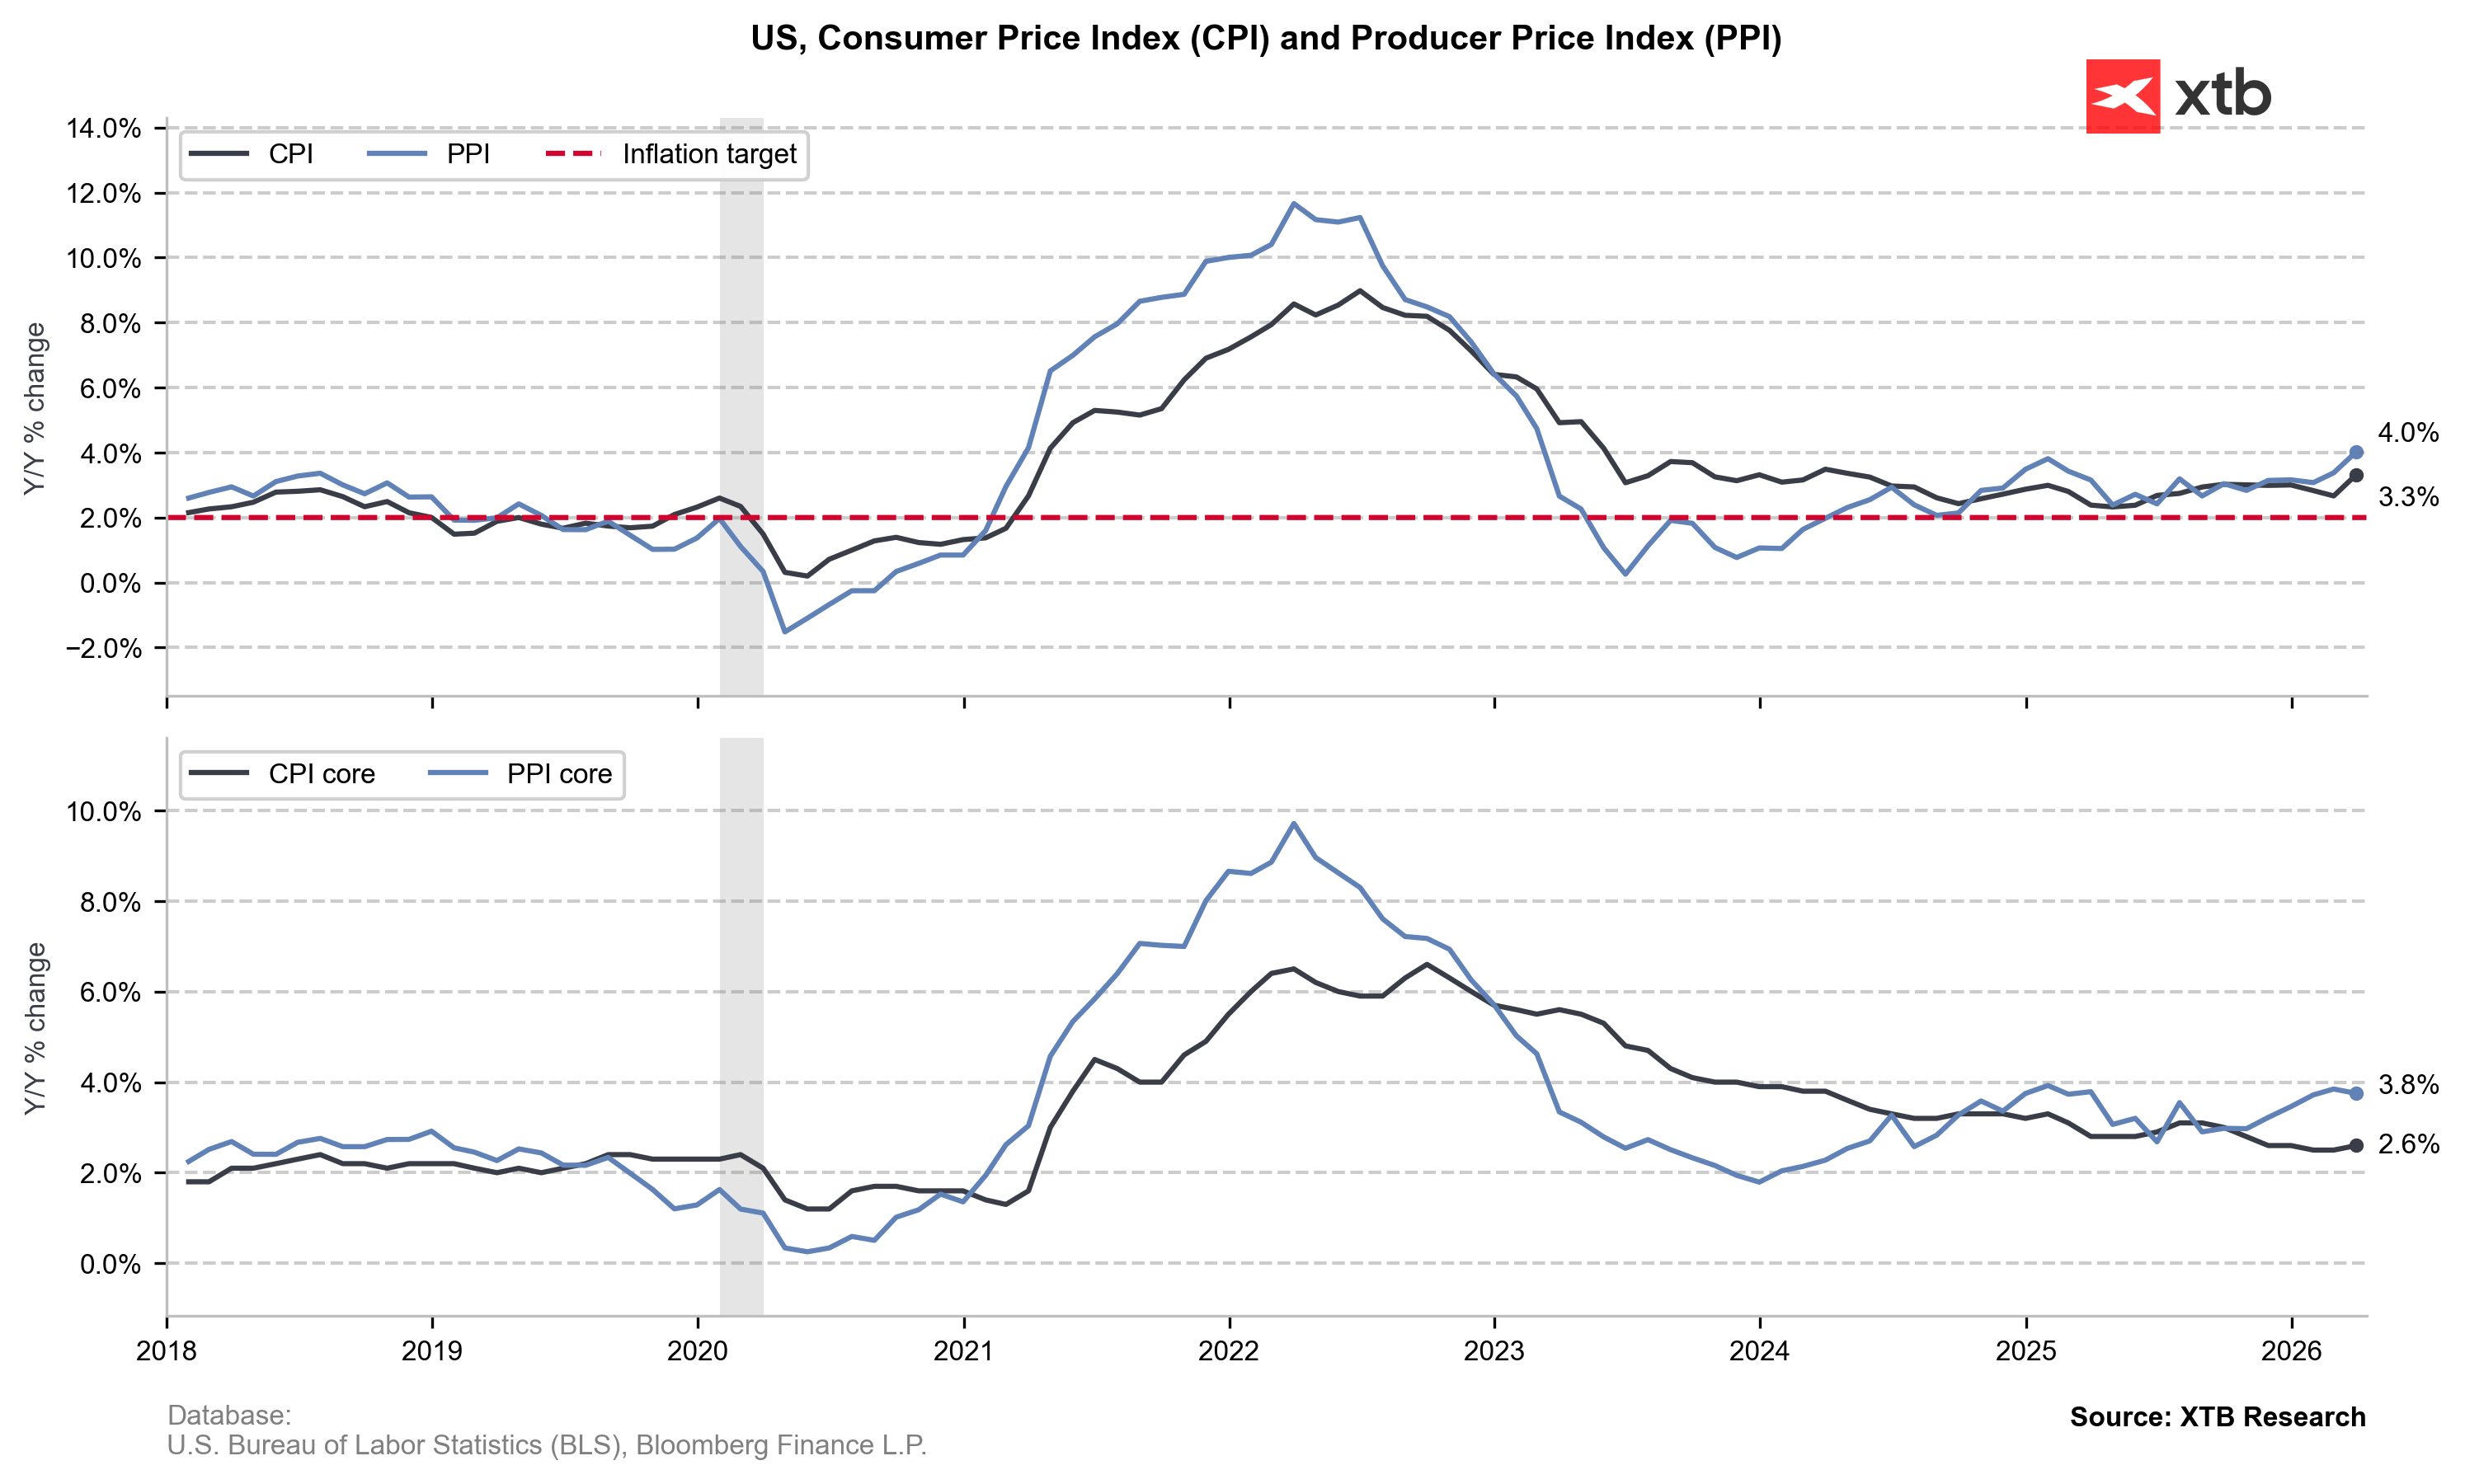
Producer Price Inflation (PPI)
- PPI inflation (m/m): actual 0,5% (forecast 1.1%, previous 0.7%)
- Core PPI inflation (m/m): actual 0.1% (forecast 0.5%, previous 0.5%)
- PPI inflation (y/y): actual 4% (forecast 4.6%, previous 3.4%)
- Core PPI inflation (y/y): actual 3,8% (forecast 4.2%, previous 3.9%)
Why is this data important?
Producer Price Inflation (PPI) measures changes in the prices of goods at the producer level, before they reach consumers. It is one of the key leading indicators of consumer inflation (CPI), as rising production costs are often passed on to end consumers.
An increase in PPI suggests rising cost pressure in the economy, which may lead to higher inflation in the future. On the other hand, a weaker reading indicates lower price pressure and may give the central bank more room for a more accommodative monetary policy. Core PPI is particularly important, as it excludes volatile components such as energy and food, providing a more stable view of underlying price trends.
This report has a significant impact on financial markets. A stronger than expected rise in PPI can support the US dollar and push bond yields higher due to expectations of higher interest rates, while weaker data may have the opposite effect.
Current Data
Producer Price Inflation (PPI) in the US came in clearly weaker than expected, signaling a slowdown in producer-level price pressures.
PPI inflation in monthly terms rose by 0.5%, which is significantly below the forecast of 1.1% and also lower than the previous reading of 0.7%. This suggests that price growth at the producer level has cooled considerably in the short term, pointing to easing cost pressures in the economy.
Core PPI inflation on a monthly basis increased by just 0.1%, also well below the forecast of 0.5% and unchanged from the previous reading of 0.5%. This is an important signal that underlying inflation pressures are weakening even after stripping out more volatile components such as food and energy.
In year-on-year terms, PPI inflation stands at 4.0%, below expectations of 4.6% but above the previous reading of 3.4%. This indicates that while annual price growth remains elevated, the momentum is slowing compared to earlier periods.
Core PPI inflation year-on-year came in at 3.8%, slightly below the forecast of 4.2% and just under the previous 3.9%, reinforcing the view that underlying inflationary pressures are gradually easing.
Overall, the data points to weaker-than-expected producer inflation, which may reduce concerns about persistent cost-driven inflation and could be interpreted as a more dovish signal for monetary policy. In a market context, such a report can weigh on the US dollar and support equities, as it increases expectations that the Federal Reserve has less pressure to maintain a restrictive stance.
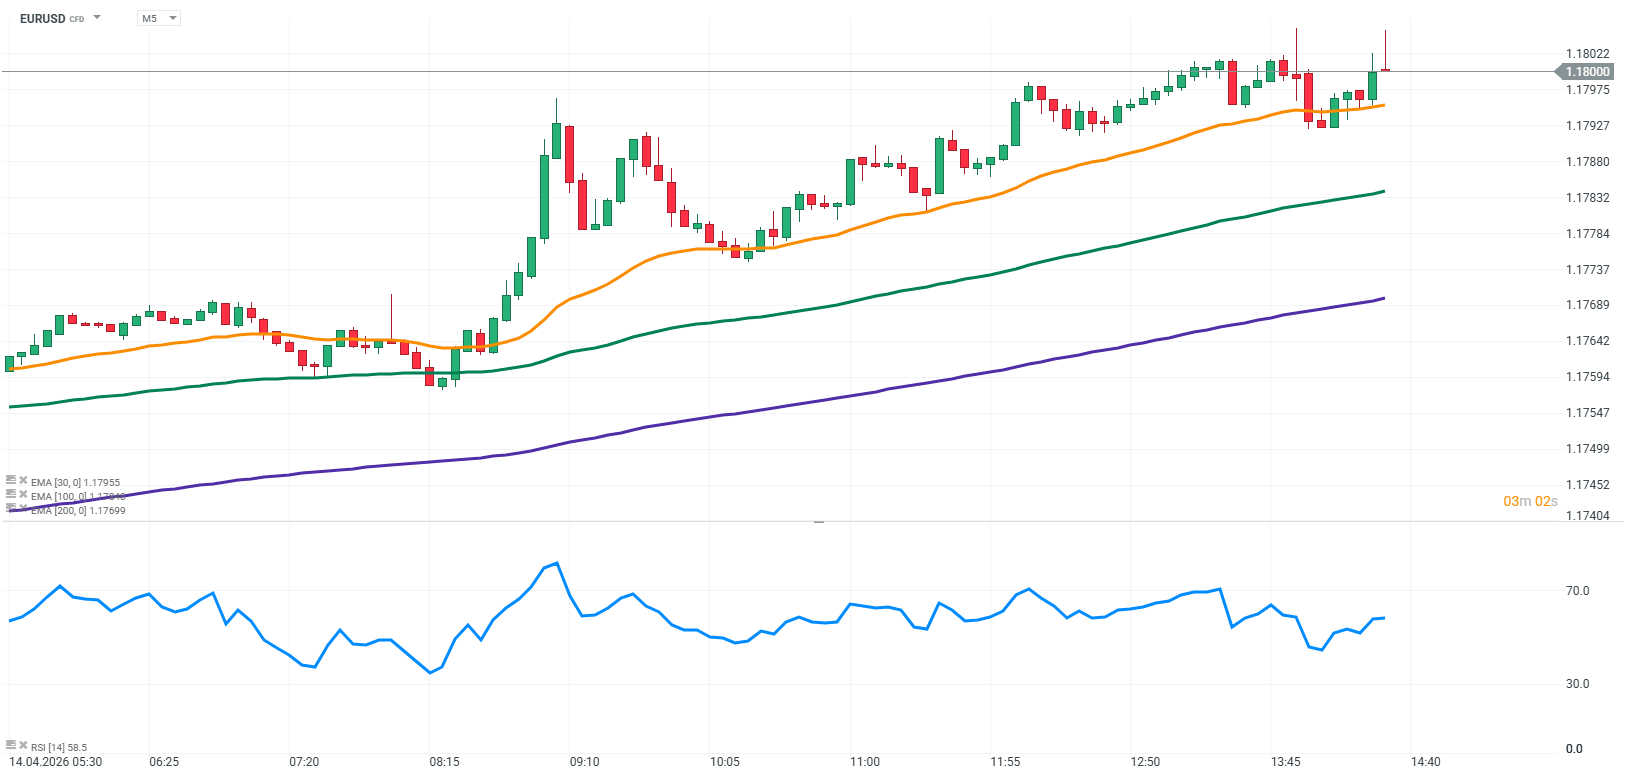
Source: xStation5
The material on this page does not constitute financial advice and does not take into account your level of understanding, investment objectives, financial situation or any other specific needs. All information provided, including opinions, market research, mathematical results and technical analyzes published on the Website or transmitted To you by other means, it is provided for information purposes only and should in no way be construed as an offer or solicitation for a transaction in any financial instrument, nor should the information provided be construed as advice of a legal or financial nature on which any investment decisions you make should be based exclusively To your level of understanding, investment objectives, financial situation, or other specific needs, any decision to act on the information published on the Website or sent to you by other means is entirely at your own risk if you In doubt or unsure about your understanding of a particular product, instrument, service or transaction, you should seek professional or legal advice before trading. Investing in CFDs carries a high level of risk, as they are leveraged products and have small movements Often the market can result in much larger movements in the value of your investment, and this can work against you or in your favor. Please ensure you fully understand the risks involved, taking into account investments objectives and level of experience, before trading and, if necessary, seek independent advice.