الأسواق العالمية
مؤشر S&P 500 — مؤشر الشركات الأمريكية ذات رؤوس الأموال الكبيرة
ناسداك 100 — مؤشر شركات التكنولوجيا النامية
داو جونز — المؤشر الصناعي
مؤشر FTSE 100 — الشركات الرائدة في المملكة المتحدة
مؤشر يورو ستوكس 50 — الشركات الرائدة في منطقة اليورو
مؤشر داكس 40 — الأسهم الألمانية
CAC 40 — مؤشر السوق الفرنسي
مؤشر نيكي 225 — المؤشر القياسي الياباني
هانغ سنغ — مؤشر هونغ كونغ
مؤشر شنغهاي المركب — الصين القارية
مؤشر ASX 200 — السوق الأسترالية
مؤشر TSX المركب — مؤشر كندا
مؤشر «نيفتي 50» — الشركات الهندية ذات رؤوس الأموال الكبيرة
مؤشر STI — سوق سنغافورة
KOSPI — مؤشر كوريا الجنوبية
بوفيسبا — أسهم البرازيل
مؤشر JSE Top 40 — مؤشر جنوب أفريقيا
مؤشر IPC — سوق المكسيك
MarketsTechnical AnalysisUSDUSD Index

US Dollar Index Hovers near descending channel’s lower boundary at 100.50

  • The US Dollar Index may continue to weaken amid a sustained bearish trend, currently testing the descending channel’s lower boundary.
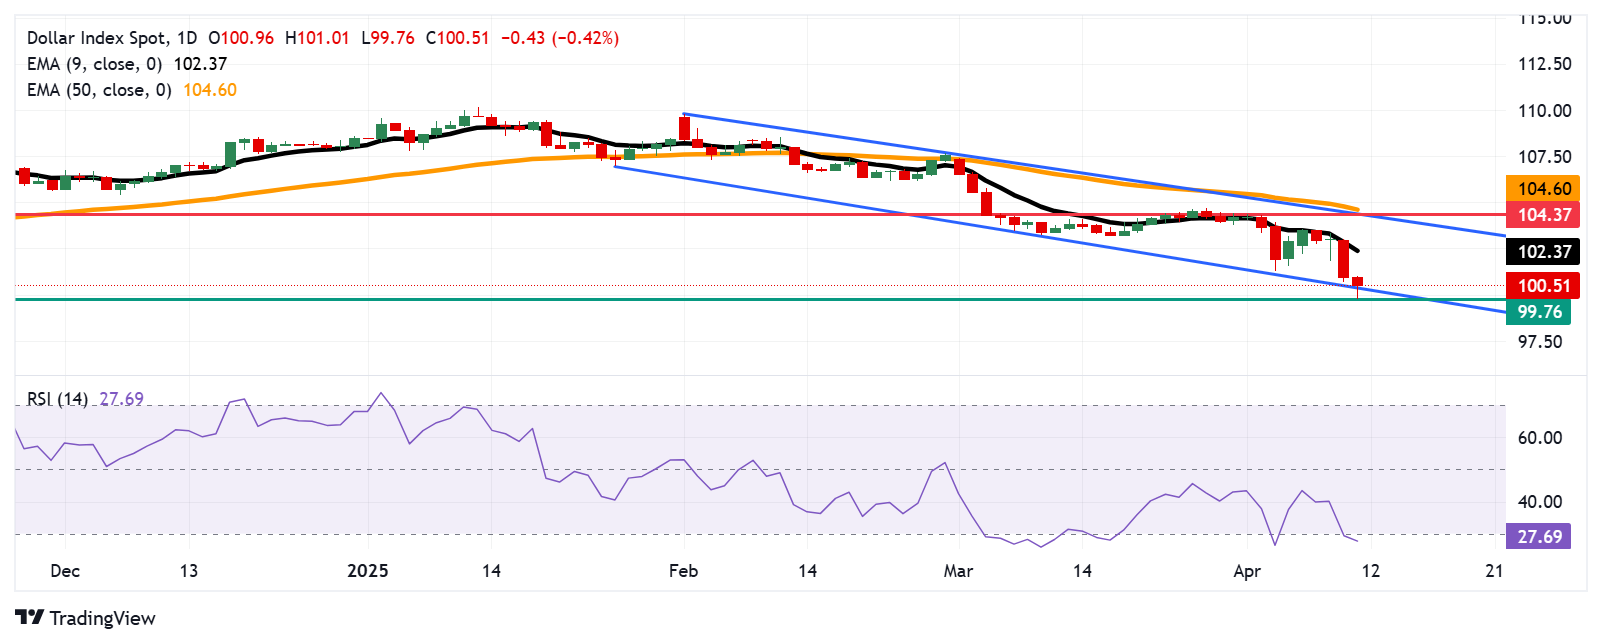
  • The 14-day RSI remains below 30, indicating the possibility of an imminent corrective rebound.
  • Immediate support is located at the psychological level of 100.00, followed by 99.76 — the lowest level recorded since April 2022.

The US Dollar Index (DXY), which tracks the performance of the US Dollar (USD) against a basket of six major currencies, continues its decline for the second consecutive session, hovering around 100.40 during Friday’s Asian trading hours. The technical analysis of the daily chart suggests a sustained bearish trend, with the index testing the lower boundary of a prevailing descending channel.

Despite the downward pressure, the 14-day Relative Strength Index (RSI) remains below 30, signaling the potential for an imminent upward correction. Furthermore, the DXY is trading well below its nine-day Exponential Moving Average (EMA), indicating weak short-term momentum.

On the downside, immediate support is seen at the psychological level of 100.00, followed by 99.76 — the lowest level since April 2022. Additional support lies near the 99.00 mark.

To the upside, a move toward the nine-day EMA at 102.34 could be on the cards. A decisive break above this level may enhance short-term bullish momentum and pave the way for a test of the key resistance zone near the upper boundary of the descending channel at the monthly high of 104.37, followed by 104.59.

US Dollar Index: Daily Chart

Octalas AI
شعار Octalas

الربح

الجميع يسارعون إلى خفض التكاليف. أما نحن، فنسرع نحو تحقيق الأرباح.

ابدأ البيع من خلال تقديم الخدمات

مجانًا لمدة 14 يومًا · لا حاجة لبطاقة ائتمان
الربح من خلال الذكاء الاصطناعي

مقالات ذات صلة

اترك تعليقًا

لن يتم نشر عنوان بريدك الإلكتروني. الحقول الإلزامية مميزة بعلامة *

زر «العودة إلى الأعلى»