S&P 500 — US Large Cap Index
 FTSE 100 — UK Blue Chips
 Euro Stoxx 50 — Eurozone Leaders
 DAX 40 — German Equities
 CAC 40 — French Market Index
 Nikkei 225 — Japan Benchmark
 Hang Seng — Hong Kong Index
 Shanghai Composite — China Mainland
 ASX 200 — Australian Market
 TSX Composite — Canada Index
 Nifty 50 — India Large Cap
 STI Index — Singapore Market
 KOSPI — South Korea Index
 Bovespa — Brazil Equities
 JSE Top 40 — South Africa Index
 IPC Index — Mexico Market
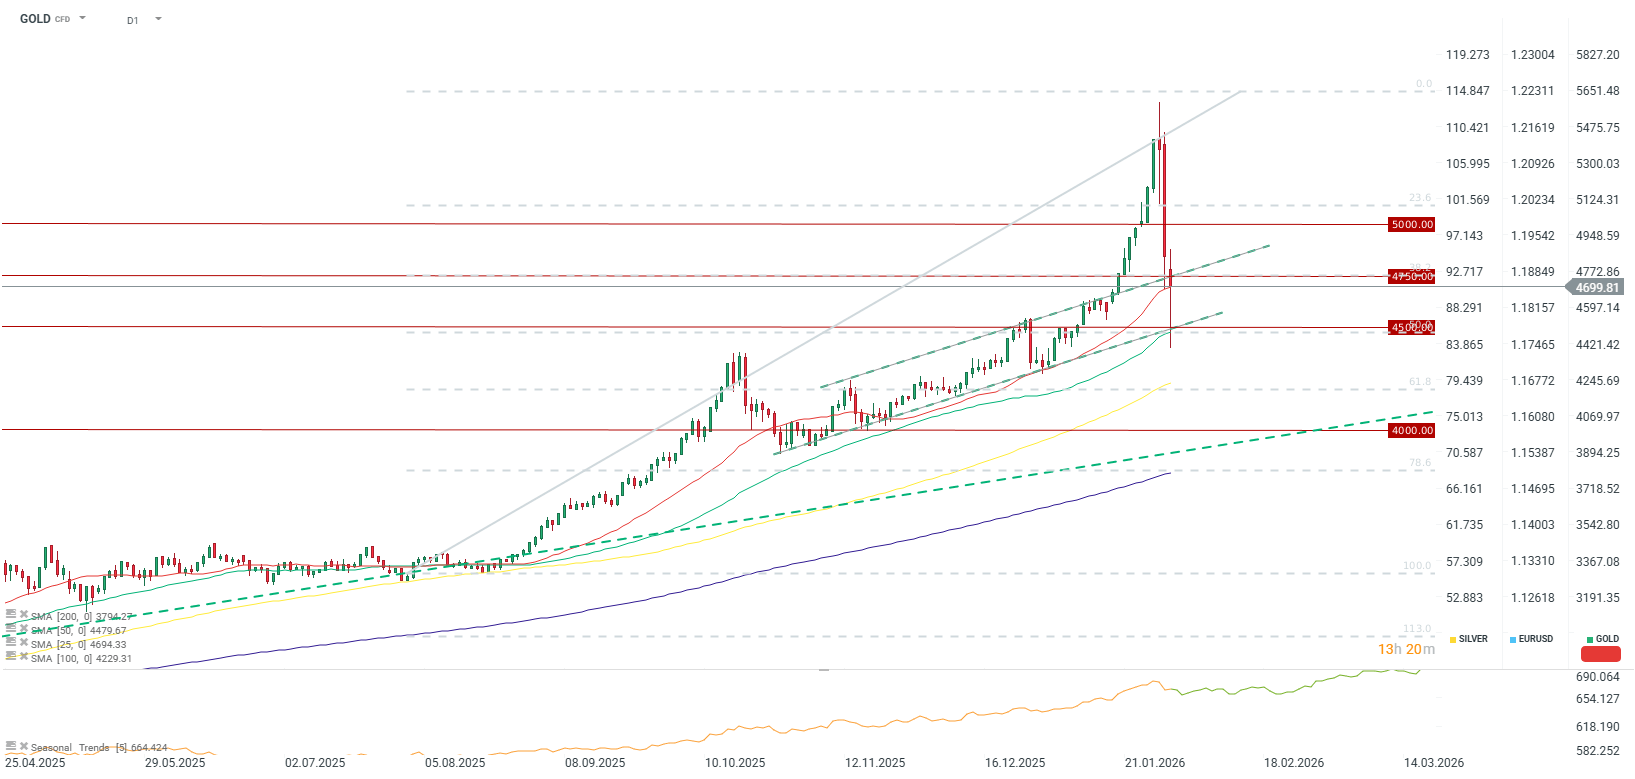
Gold is currently trading down just over 3%, recovering from an intraday plunge of 9% and a peak-to-trough decline exceeding 21%.
The gold price is significantly paring its losses, rebounding from near $4,400 per ounce to a level of almost $4,700. Notably, this bounce occurred around the 50.0 Fibonacci retracement level of the bull run that began in August 2025. Furthermore, the buffer zone between the 25 and 50-day Simple Moving Averages (SMA) remains intact for the time being.
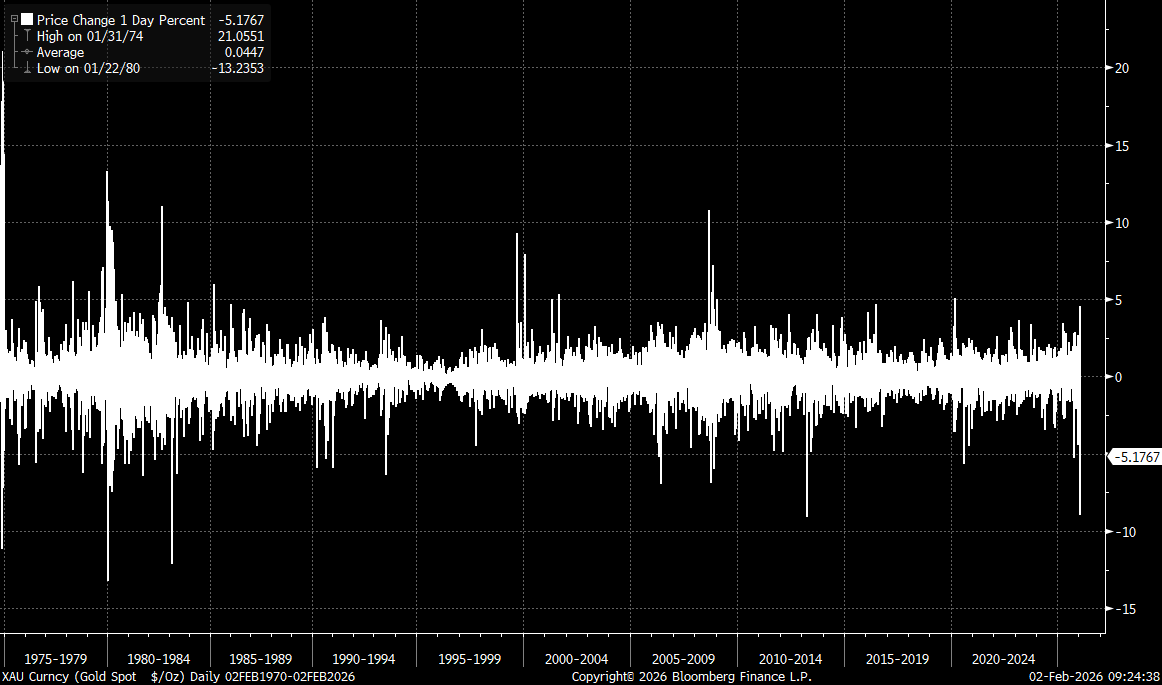
Friday’s price drop in the gold market was among the largest in history, yet it did not exceed 10%. By contrast, silver’s decline at one stage surpassed 30%. Source: Bloomberg Finance LP
It is important to highlight that the demand structure for gold differs fundamentally from that of silver. In the gold market, we have not observed the same extreme signals from the options market, nor were there acute concerns regarding physical bullion delivery. Nevertheless, historical context is vital: in the past, gold corrections from all-time highs have reached as much as 40%, although the largest correction since 2020 has been limited to 20%.
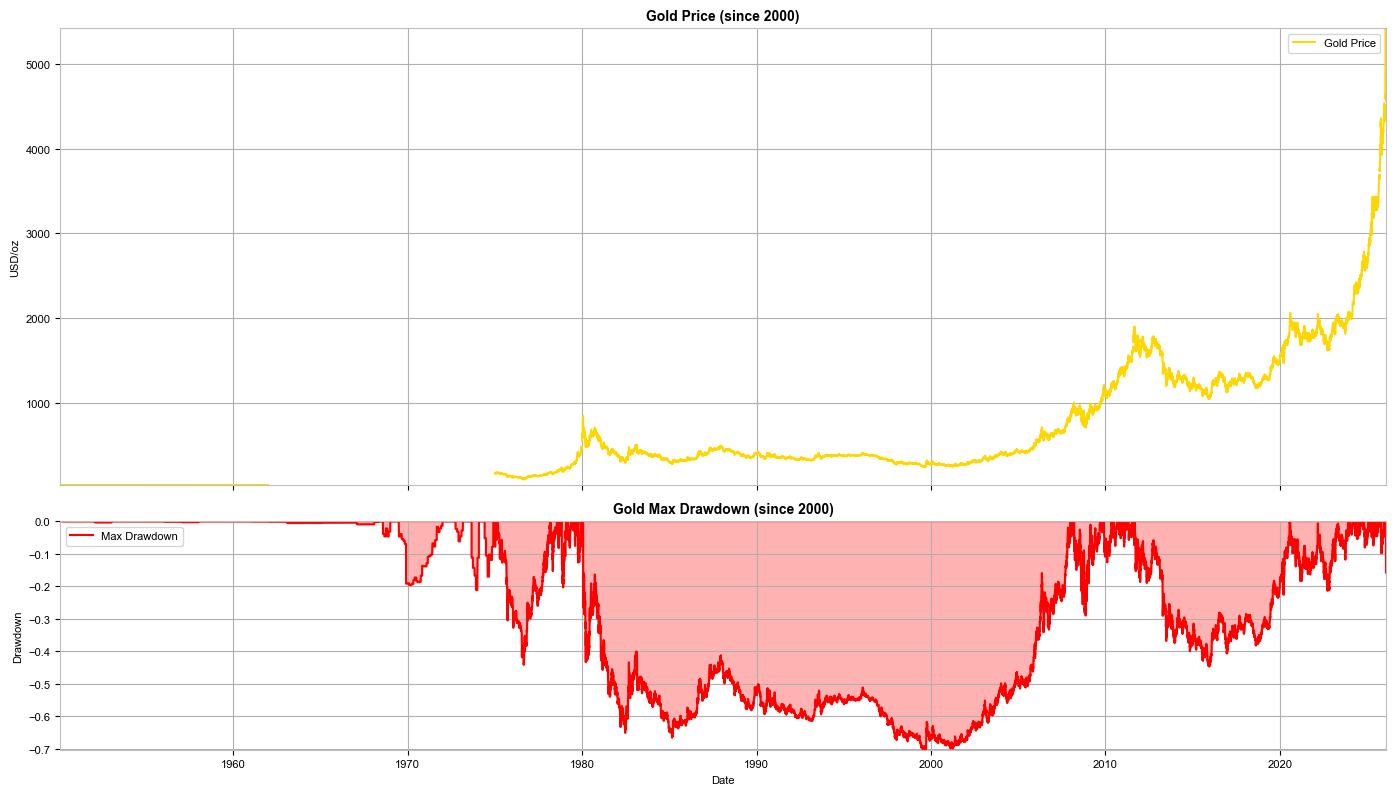
Analyzing the period from 2020 onwards, the maximum correction reached 20%. Source: Bloomberg Finance LP
A daily close above $4,750 per ounce could signal that the correction in the gold market has run its course. In such a scenario, the objective would be a swift return toward the $5,000 psychological barrier. Conversely, should gold end the session closer to $4,500, the prospect of a deeper correction remains on the table. This could see prices retreat toward the long-term trend line, situated in the $4,000–$4,200 per ounce range.
The material on this page does not constitute financial advice and does not take into account your level of understanding, investment objectives, financial situation or any other specific needs. All information provided, including opinions, market research, mathematical results and technical analyzes published on the Website or transmitted To you by other means, it is provided for information purposes only and should in no way be construed as an offer or solicitation for a transaction in any financial instrument, nor should the information provided be construed as advice of a legal or financial nature on which any investment decisions you make should be based exclusively To your level of understanding, investment objectives, financial situation, or other specific needs, any decision to act on the information published on the Website or sent to you by other means is entirely at your own risk if you In doubt or unsure about your understanding of a particular product, instrument, service or transaction, you should seek professional or legal advice before trading. Investing in CFDs carries a high level of risk, as they are leveraged products and have small movements Often the market can result in much larger movements in the value of your investment, and this can work against you or in your favor. Please ensure you fully understand the risks involved, taking into account investments objectives and level of experience, before trading and, if necessary, seek independent advice.