- USD/CAD trades with a negative bias in the weekly range amid a softer USD, rising Oil prices.
- The mixed technical setup warrants some caution before placing aggressive directional bets.
- A sustained strength beyond the 1.4000 confluence will be seen as a fresh trigger for bulls.
The USD/CAD pair attracts some sellers for the second straight day on Friday, though it remains confined in a range held since the beginning of this week. Spot prices currently trade just below mid-1.3900s, down over 0.10% for the day amid a combination of negative factors.
The softer US macro data released on Thursday reaffirmed market bets for more interest rate cuts by the Federal Reserve (Fed) and keeps the US Dollar (USD) bulls on the defensive. Apart from this, a modest rise in Crude Oil prices is seen underpinning the commodity-linked Loonie and exerting some downward pressure on the USD/CAD pair.
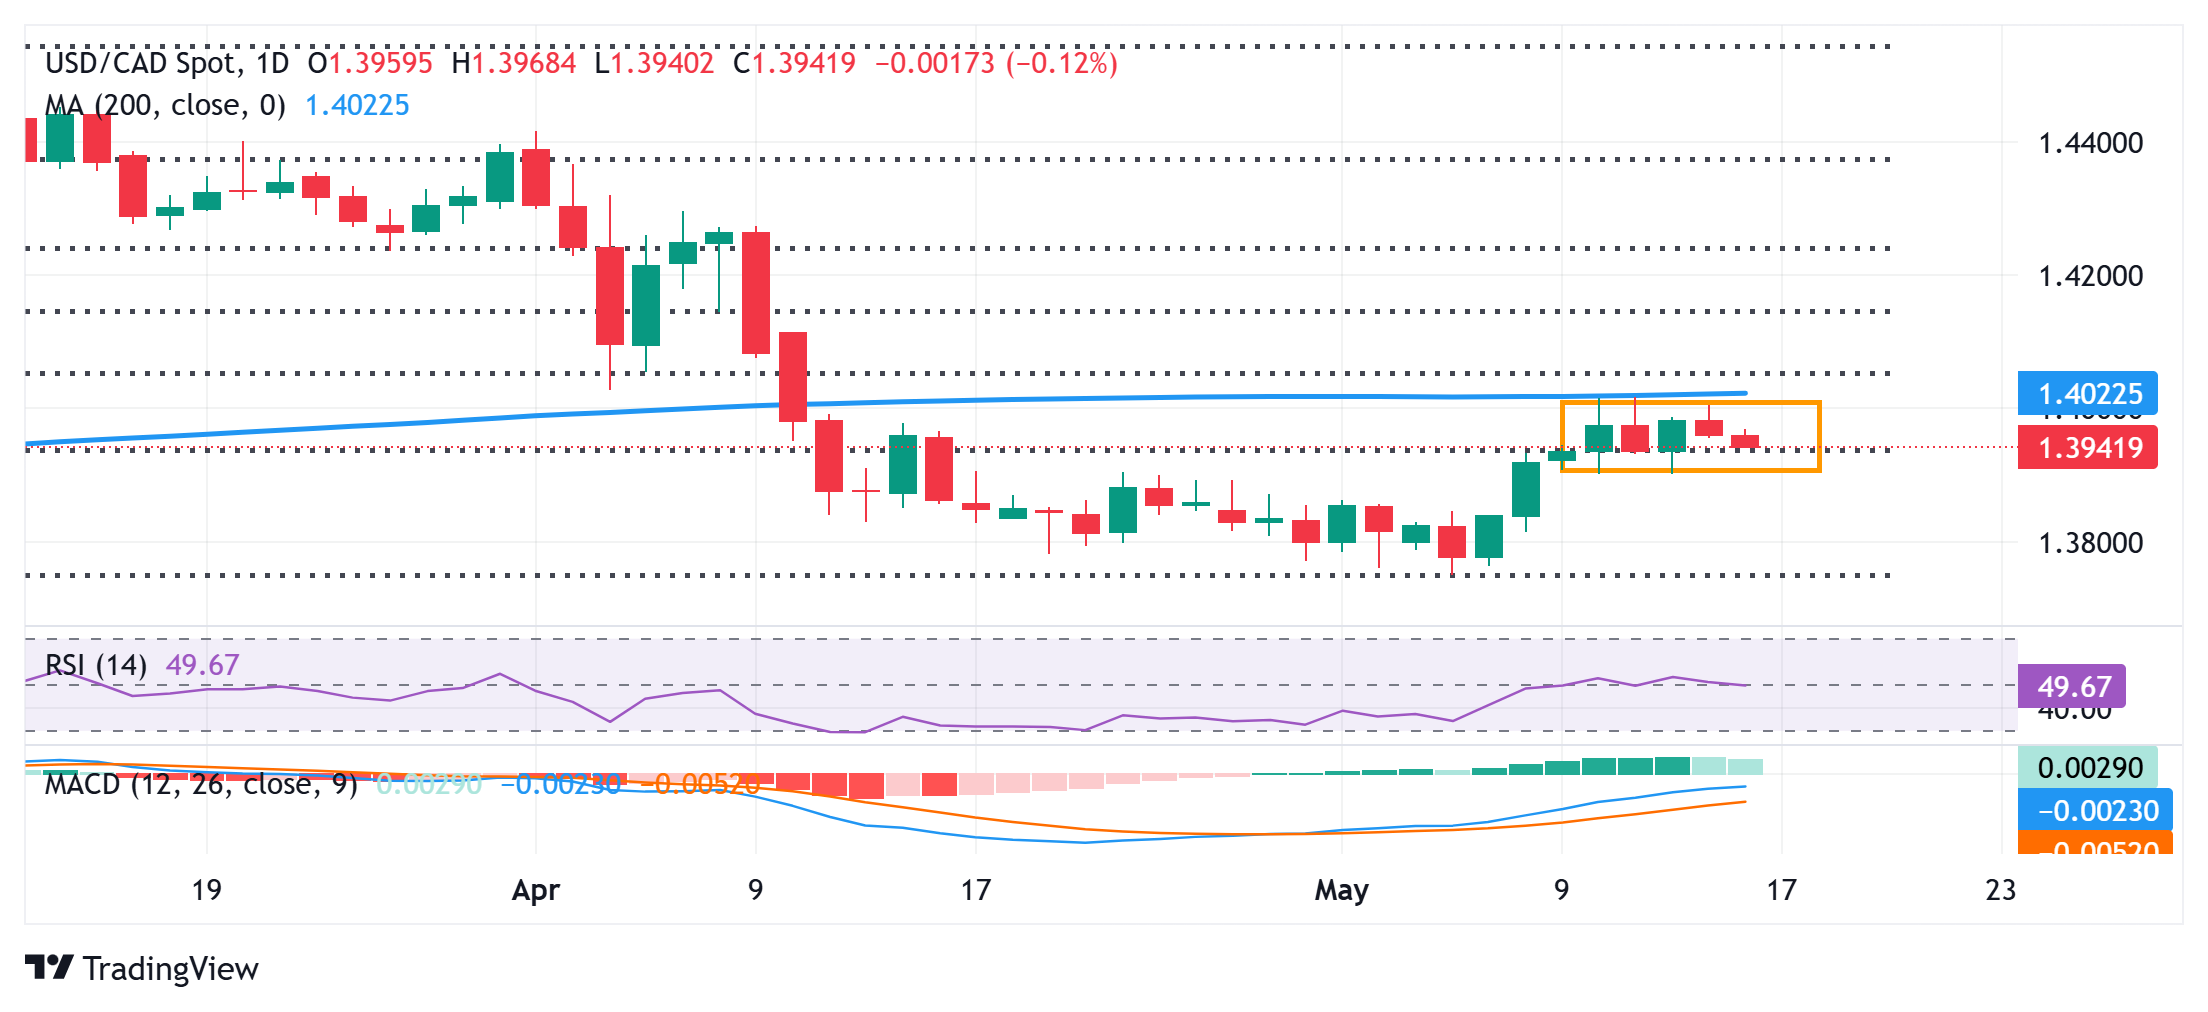
The range-bound price action might be categorized as a bullish consolidation against the backdrop of the recent bounce from the year-to-date low. However, this week’s failure near the 1.4000 confluence – comprising the 200-day Simple Moving Average (SMA) and the 38.2% Fibonacci retracement level of the March-May fall – warrants some caution.
Moreover, technical indicators on the daily chart have been struggling to gain any meaningful positive traction. Hence, it will be prudent to wait for a sustained strength beyond the 1.4000 psychological mark before positioning for any further gains. The USD/CAD pair might then climb to the 1.4050 intermediate hurdle, towards the 1.4100 neighborhood.
On the flip side, the weekly trough, around the 1.3900 round figure, also marking the lower end of the short-term range, might continue to protect the immediate downside. A convincing break below might drag the USD/CAD pair to the 1.3855 region en route to the 1.3800 mark and to the year-to-date low, around the 1.3750 area touched earlier this month.
USD/CAD daily chart