S&P 500 — US Large Cap Index
 FTSE 100 — UK Blue Chips
 Euro Stoxx 50 — Eurozone Leaders
 DAX 40 — German Equities
 CAC 40 — French Market Index
 Nikkei 225 — Japan Benchmark
 Hang Seng — Hong Kong Index
 Shanghai Composite — China Mainland
 ASX 200 — Australian Market
 TSX Composite — Canada Index
 Nifty 50 — India Large Cap
 STI Index — Singapore Market
 KOSPI — South Korea Index
 Bovespa — Brazil Equities
 JSE Top 40 — South Africa Index
 IPC Index — Mexico Market
WTI Oil Price Forecast: Middle East Tensions Keep Bulls in Control as $98.55 Resistance Caps the Rally


WTI crude oil prices are consolidating below the mid-$96 area on Friday after failing to extend the latest rebound from $94.65, but the broader technical structure remains constructive as escalating Middle East tensions keep a geopolitical risk premium embedded in oil prices. West Texas Intermediate is trading around $96.35 per barrel, down roughly 0.20% on the session, while remaining close to its highest level since May 20.
The latest developments around the Middle East are keeping crude traders focused on the possibility of further disruption to regional oil flows. Iran’s Islamic Revolutionary Guard Corps said it had struck a Togo-flagged tanker that attempted what it described as an illegal passage through the Strait of Hormuz. US President Donald Trump also said he was approaching a major decision regarding whether to resume large-scale attacks on Iran.
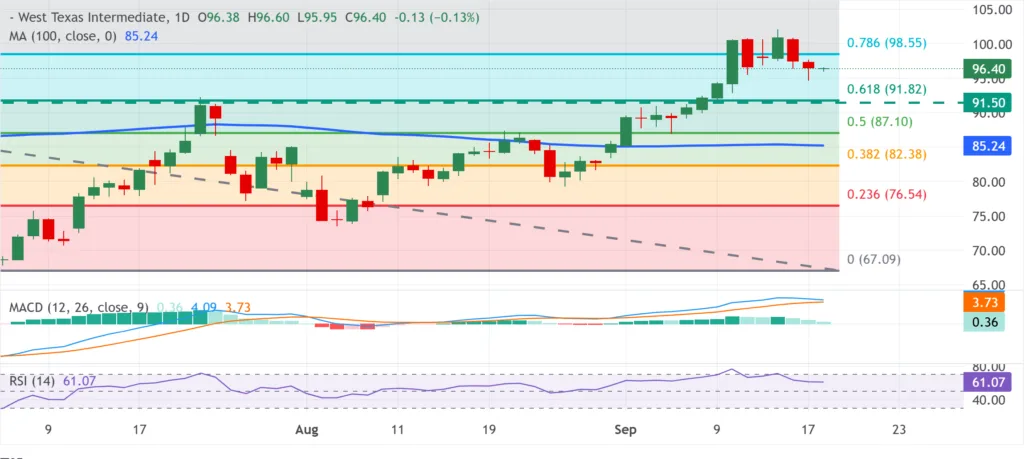
These developments are preventing the market from fully removing the geopolitical premium from crude oil, even as WTI struggles to break decisively above the $98.55 78.6% Fibonacci resistance level.
Technically, WTI remains above important moving-average and Fibonacci support levels, while momentum indicators continue to point toward positive underlying momentum. The immediate question for traders is whether the market can convert the current consolidation into another upside breakout.
Why Is WTI Oil Price Consolidating Near $96?
WTI has established a significant recovery from the lower levels seen during the previous corrective phase, but the rally has encountered resistance before reaching the psychologically important $100 area.
The latest decline to $94.65 created an important short-term test of demand. Buyers subsequently stepped back in, pushing crude back toward $96, but the recovery has not yet produced a decisive break above the mid-$96s.
The market is therefore caught between two competing forces.
Bullish forces include:
- Escalating Middle East geopolitical risk.
- Potential disruption around the Strait of Hormuz.
- WTI trading above major technical support.
- Positive MACD momentum.
- RSI remaining above the neutral 50 level.
- The established medium-term uptrend.
Bearish or limiting forces include:
- Failure to sustain gains above $98.55.
- Profit-taking after the sharp recovery.
- WTI remaining below the recent $107.11 cycle high.
- The possibility that geopolitical risk premiums could unwind if tensions ease.
The result is a market consolidating beneath resistance rather than one showing a clear technical reversal.
Middle East Tensions Keep the Oil Risk Premium Elevated
Geopolitical developments remain the dominant fundamental catalyst for crude oil.
The Strait of Hormuz is particularly important because it represents a critical route for global energy shipments. Any sustained disruption to tanker movements through the waterway could potentially tighten physical oil markets and generate another sharp increase in risk premiums.
The latest tanker incident involving Iran adds to those concerns.
At the same time, Trump’s comments regarding a potential decision on further military action against Iran introduce additional uncertainty into the market.
For oil traders, the key issue is not simply the military rhetoric itself. The bigger question is whether developments translate into actual disruptions to crude production, exports, refining infrastructure or tanker traffic.
That distinction is crucial.
Oil prices can rise rapidly on expectations of disruption, but sustained gains generally require a measurable deterioration in physical supply availability.
WTI Technical Outlook Remains Constructive Above $91.82
The technical structure continues to favor the bulls while WTI remains above its major Fibonacci and moving-average support levels.
The 61.8% Fibonacci retracement of the May-July corrective decline sits at $91.82, providing the first major downside reference.
WTI is also trading above the 100-day Simple Moving Average, which is positioned around $85.24.
Momentum indicators reinforce the constructive technical picture.
The MACD remains in positive territory, suggesting that upward momentum has not yet been completely exhausted.
Meanwhile, the RSI is around 61, comfortably above the neutral 50 threshold but not yet at traditionally overbought levels.
This leaves room for additional upside momentum if a fresh fundamental catalyst emerges.
$98.55 Is the Critical WTI Resistance Level
The immediate technical battle is taking place below the 78.6% Fibonacci retracement at $98.55.
WTI has so far struggled to establish a sustained move above this level.
A decisive break and sustained close above $98.55 would strengthen the technical case for another leg higher and put the recent $107.11 cycle high back into focus.
The $100 psychological level would also become an important intermediate target because of its significance to both traders and the physical energy market.
However, repeated failures around $98.55 could encourage profit-taking and leave WTI vulnerable to another test of lower support.
WTI Support Levels to Watch
The first major support remains the 61.8% Fibonacci retracement at $91.82.
A sustained move below that level would weaken the immediate bullish structure and expose the next Fibonacci support around $87.10, representing the 50% retracement.
Further below, the 100-day SMA near $85.24 becomes increasingly important.
The deeper 38.2% Fibonacci retracement at $82.38 represents another downside reference should the correction become more substantial.
This creates a clearly defined technical framework:
| WTI Technical Level | Price | Market Significance |
|---|---|---|
| Recent Cycle High | $107.11 | Major bullish breakout target |
| 78.6% Fibonacci | $98.55 | Immediate resistance |
| Current WTI Price | ~$96.35 | Consolidation zone |
| 61.8% Fibonacci | $91.82 | First major support |
| 50% Fibonacci | $87.10 | Secondary support |
| 100-Day SMA | ~$85.24 | Major trend support |
| 38.2% Fibonacci | $82.38 | Deeper correction level |
Bullish Sentiment
1. Middle East Geopolitical Risk
Continued tension involving Iran and the Strait of Hormuz keeps a geopolitical risk premium embedded in crude prices.
Any evidence of actual disruption to regional supply or shipping could accelerate the upside move.
2. WTI Remains Above Major Technical Support
WTI is still comfortably above the $91.82 61.8% Fibonacci retracement and the 100-day moving average.
The broader technical structure therefore remains constructive.
3. Positive MACD Momentum
The MACD remains in positive territory, supporting the argument that the recent advance has not yet been technically invalidated.
4. RSI Remains Above Neutral
An RSI near 61 indicates positive momentum without reaching traditionally extreme overbought conditions.
That leaves room for momentum to strengthen if crude breaks through resistance.
5. $98.55 Break Could Reopen the Path Toward $107
A sustained move above the 78.6% Fibonacci level at $98.55 would represent an important technical development.
The next major upside reference would then be the $107.11 cycle high.
Bearish Sentiment
1. Failure Below $98.55
The most immediate bearish argument is that WTI has repeatedly struggled to convert the $98.55 level into support.
Without a decisive breakout, traders may continue taking profits near resistance.
2. Geopolitical Premium Could Reverse
A reduction in Middle East tensions, improved tanker flows or a lower probability of further escalation could remove some of the premium currently incorporated into crude prices.
3. $94.65 Remains a Recent Short-Term Low
The recent move toward $94.65 demonstrates that selling pressure remains present beneath the market.
A break below that level would increase the probability of a deeper retracement.
4. $91.82 Is the Key Technical Test
A sustained move below the 61.8% Fibonacci level at $91.82 would weaken the current bullish technical structure.
That could expose $87.10 and eventually the $85.24 100-day SMA.
The WTI Bull-Bear Battle Is Concentrated Between $91.82 and $98.55
The current market structure provides traders with a relatively clear range to monitor.
Above $91.82, the broader recovery remains technically intact.
Above $98.55, bullish momentum could accelerate and bring $100 and eventually $107.11 back into focus.
Below $91.82, the technical picture becomes considerably less constructive, with $87.10 and $85.24 becoming the next major reference points.
This makes the area between $91.82 and $98.55 particularly important for short-term WTI price action.
What Traders Are Watching Next
WTI traders are likely to focus on five major catalysts:
- Middle East developments — particularly any changes involving Iran and the Strait of Hormuz.
- Tanker movements — whether shipping through the region remains disrupted or normalizes.
- Military escalation risk — whether geopolitical developments produce actual supply interruptions.
- $98.55 resistance — a sustained break would strengthen the upside technical case.
- $91.82 support — a break below this level would signal increasing downside pressure.
The most important distinction for crude traders will remain whether geopolitical headlines translate into physical supply disruption rather than simply increasing market volatility.
Currency Hedger View
For international oil buyers, refiners and businesses with USD exposure, movements in WTI are only one component of the overall cost equation.
Crude oil is predominantly priced in US dollars, meaning a stronger dollar can increase the local-currency cost of energy imports even when the underlying WTI price is unchanged.
Conversely, businesses exposed to USD revenues may experience a different impact when oil and the dollar move in opposite directions.
With WTI currently trading around $96 and geopolitical risk elevated, companies with significant future energy requirements may want to monitor both oil-price exposure and USD currency exposure rather than treating them as separate risks.
Currency Hedger, part of the Octalas Group, focuses on FX and hedging solutions designed to help businesses manage currency exposure associated with international payments, imports and cross-border transactions.
Today Markets View
WTI remains in a constructive technical structure, but the market is approaching a critical resistance zone.
The immediate battle is between persistent Middle East geopolitical risk and the inability of crude to establish a sustained move above $98.55.
Above $98.55, attention would turn toward the $100 psychological level and the $107.11 cycle high.
On the downside, $91.82 is the key level that needs to hold to preserve the current bullish technical structure, followed by $87.10 and the 100-day SMA near $85.24.
For now, the market remains caught between geopolitical upside risk and technical resistance, making $98.55 the critical level for the next major WTI move.
“WTI remains technically constructive while it holds above $91.82, but the market needs a sustained break above $98.55 to turn the current consolidation into another decisive upside move.”
— Louis Roche, Analyst, Today Markets