S&P 500 — US Large Cap Index
 FTSE 100 — UK Blue Chips
 Euro Stoxx 50 — Eurozone Leaders
 DAX 40 — German Equities
 CAC 40 — French Market Index
 Nikkei 225 — Japan Benchmark
 Hang Seng — Hong Kong Index
 Shanghai Composite — China Mainland
 ASX 200 — Australian Market
 TSX Composite — Canada Index
 Nifty 50 — India Large Cap
 STI Index — Singapore Market
 KOSPI — South Korea Index
 Bovespa — Brazil Equities
 JSE Top 40 — South Africa Index
 IPC Index — Mexico Market
- Silver regains positive traction following Friday’s pullback from the all-time peak.
- The emergence of fresh buyers near the 100-hour SMA favors the XAG/USD bulls.
- An overbought daily RSI warrants some caution before placing fresh bullish bets.
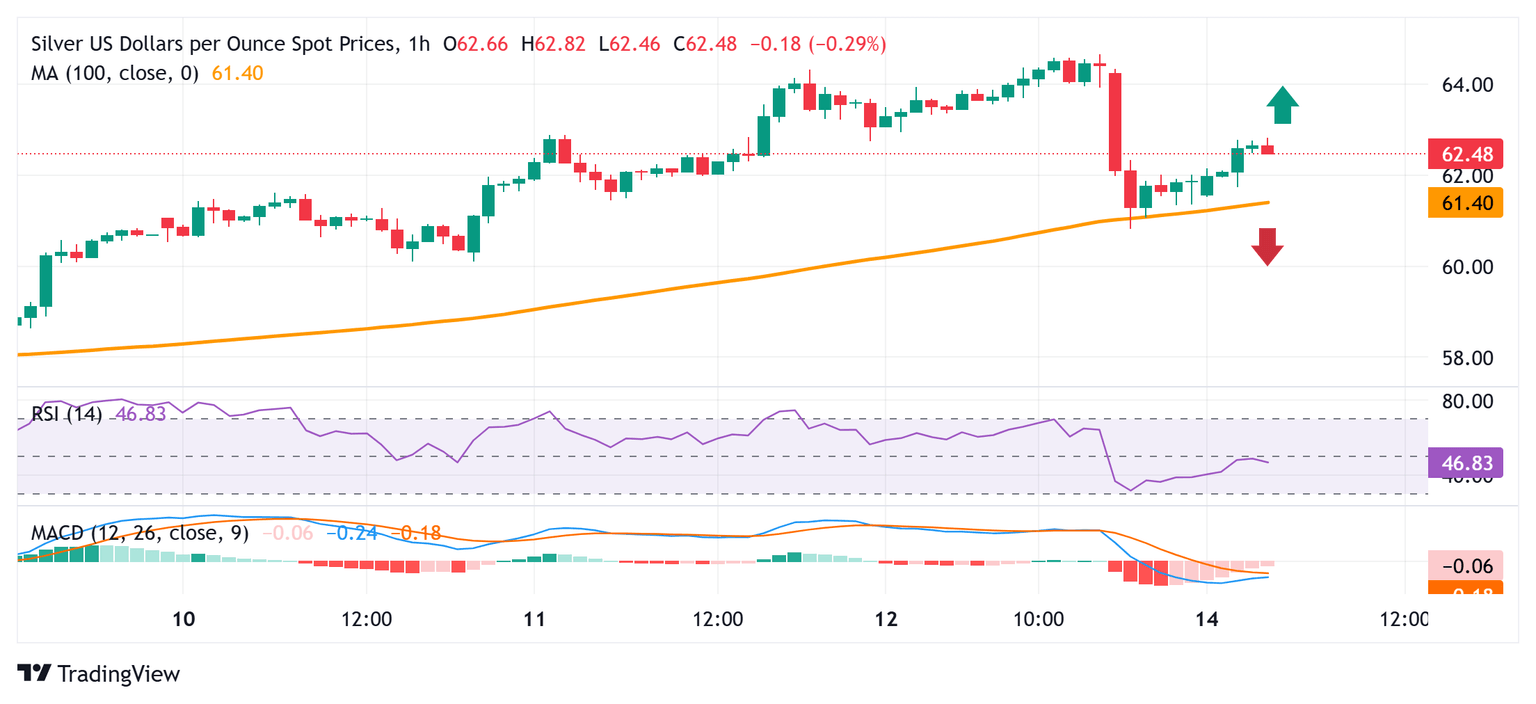
Silver (XAG/USD) attracts fresh buyers at the start of a new week and reverses a part of Friday’s retracement slide from the all-time peak, around the $64.65 region. The white metal trades above mid-$62.00s during the Asian session, up 1.25% for the day, and seems poised to prolong its recent well-established uptrend.
From a technical perspective, the XAG/USD finds decent support and bounces off the 100-hour Simple Moving Average (SMA). The subsequent move back above the $62.00 round figure validates the positive outlook. However, neutral oscillators on the 1-hour chart and a slightly overbought Relative Strength Index (RSI) on the daily chart warrant some caution for aggressive bullish traders.
This, in turn, suggests that any further move up is more likely to face some barrier near the $63.00 mark. A sustained strength beyond, however, could lift the XAG/USD towards the next relevant hurdle near the $63.80 area. Some follow-through buying beyond the $64.00 round figure will reaffirm the constructive outlook and allow bulls to challenge the record high, around the $64.65 region.
On the flip side, weakness below the $62.00 mark might still be seen as a buying opportunity near the 100-hour SMA, currently pegged near the $61.45 region. A convincing break below, however, could drag the XAG/USD below the $61.00 round figure, towards the $60.80 zone, or Friday’s swing low. The latter should act as a key pivotal point, which, if broken, should pave the way for deeper losses.
Silver 1-hour chart