XAG/USD bulls have the upper hand near mid-$34.00ish, just below YTD top
- Silver consolidates in a narrow trading band just below the YTD peak touched on Monday.
- The bullish technical setup supports prospects for a further near-term appreciating move.
- Any corrective slide below the $33.00 mark is likely to get bought into and remain limited.
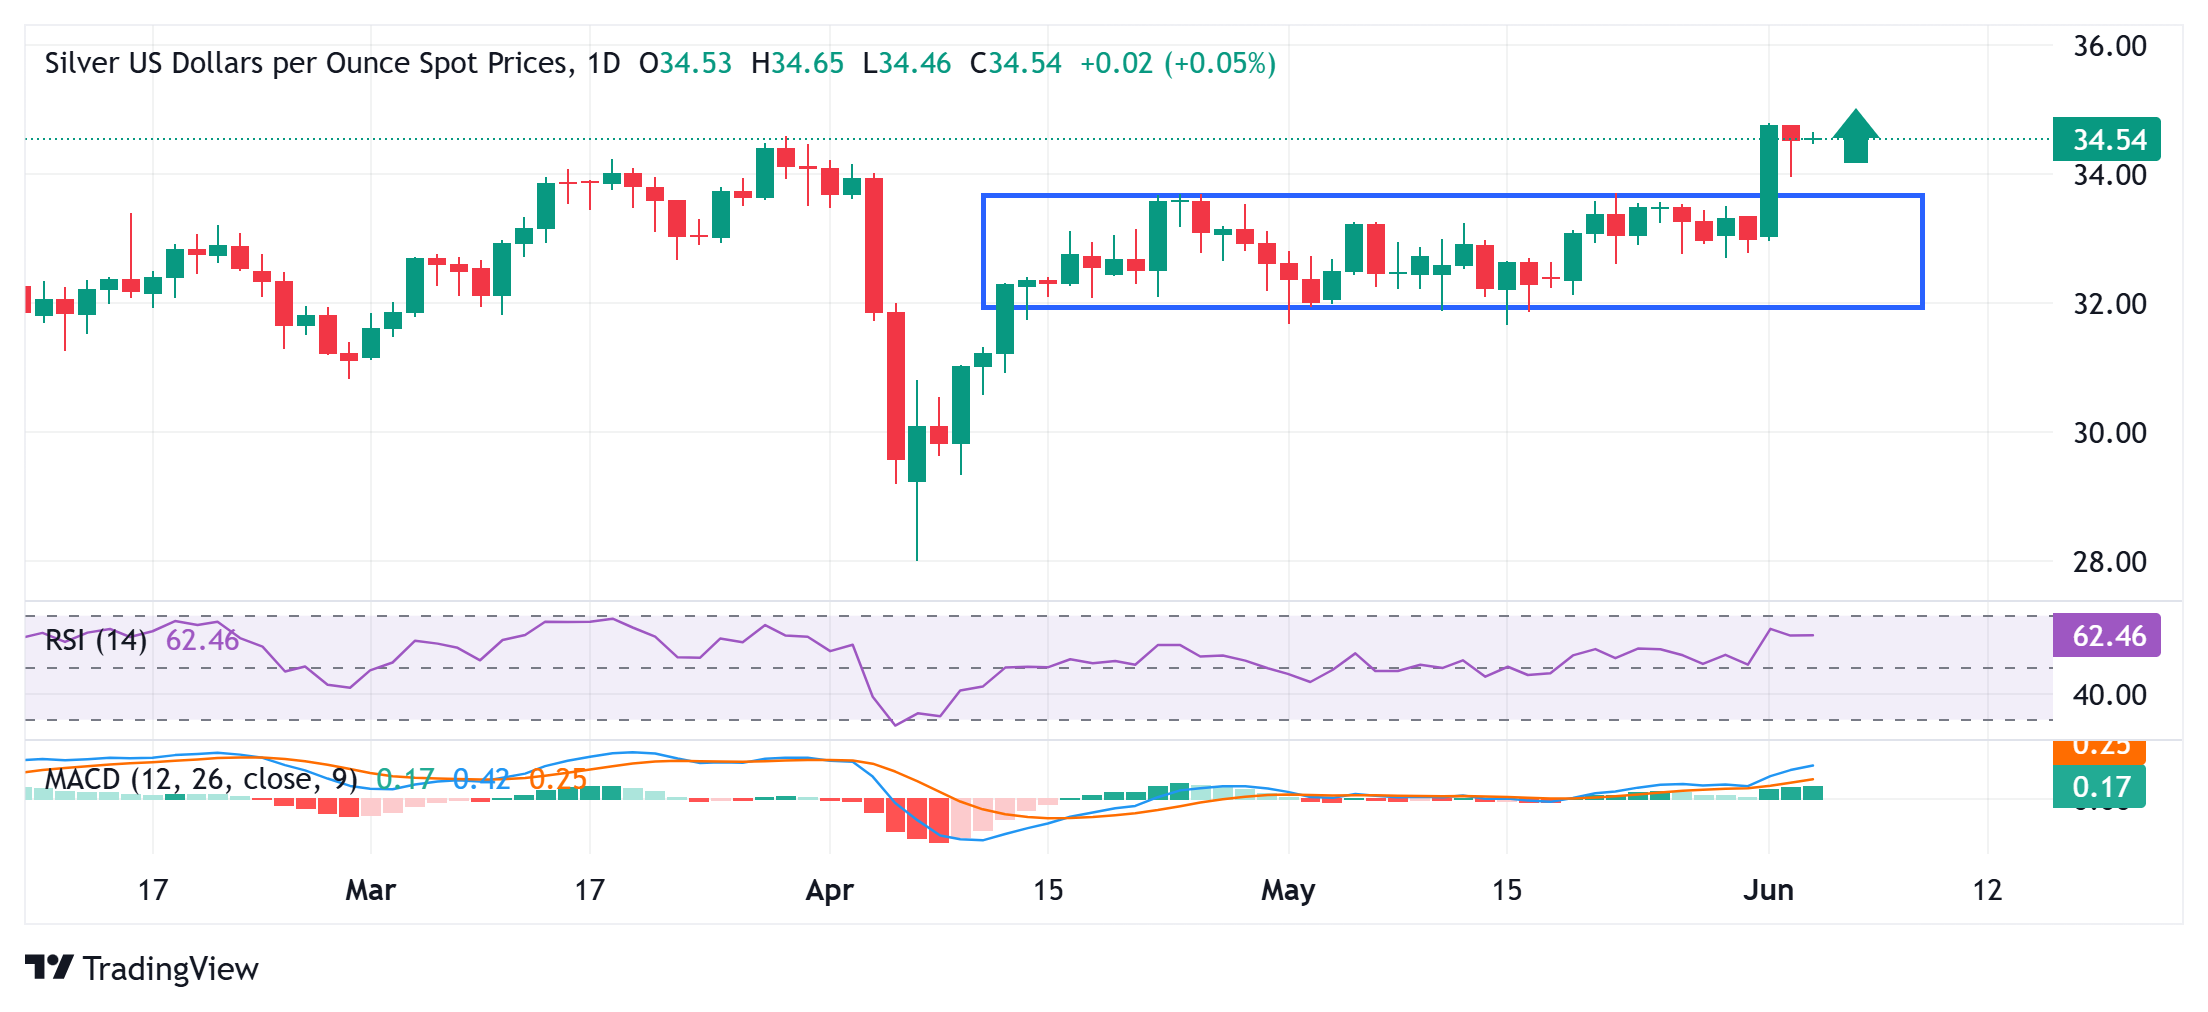
Silver (XAG/USD) struggles to capitalize on the overnight bounce from sub-$34.00 levels and oscillates in a narrow trading band during the Asian session on Wednesday. The white metal currently hovers around the $34.50 area, nearly unchanged for the day, though it remains close to the year-to-date peak (YTD) touched on Monday.
From a technical perspective, this week’s breakout through the $33.80 barrier, or the top boundary of a multi-week-old range, was seen as a key trigger for bullish traders. Moreover, oscillators on the daily chart are holding comfortably in positive territory and are still away from being in the overbought zone. This, in turn, suggests that the path of least resistance for the XAG/USD is to the upside and backs the case for a further near-term appreciating move.
Some follow-through buying beyond the $34.8-$34.90 region, or the YTD top and a twelve-year high touched in October 2024, will reaffirm the constructive outlook and pave the way for additional gains. The XAG/USD might then accelerate the momentum towards the next relevant hurdle near the $35.66 area, or March 2012 swing high, before aiming to reclaim the $36.00 mark for the first time since February 2012.
On the flip side, corrective slides below the $34.00 mark could be seen as a buying opportunity and remain limited near the aforementioned trading range resistance breakpoint, around the $33.65 region. A sustained break below the latter, however, could drag the XAG/USD to the $33.00 round figure. This is followed by the $32.75-$32.70 strong horizontal support, which if broken decisively might shift the near-term bias in favor of bearish traders.
Silver daily chart