S&P 500 — US Large Cap Index
 FTSE 100 — UK Blue Chips
 Euro Stoxx 50 — Eurozone Leaders
 DAX 40 — German Equities
 CAC 40 — French Market Index
 Nikkei 225 — Japan Benchmark
 Hang Seng — Hong Kong Index
 Shanghai Composite — China Mainland
 ASX 200 — Australian Market
 TSX Composite — Canada Index
 Nifty 50 — India Large Cap
 STI Index — Singapore Market
 KOSPI — South Korea Index
 Bovespa — Brazil Equities
 JSE Top 40 — South Africa Index
 IPC Index — Mexico Market
USD/CHF Remains capped below 100-day EMA, bearish bias prevails below 0.8200

- USD/CHF posts modest gains to around 0.8180 in Tuesday’s early European session
- The negative view of the pair prevails below the 100-day EMA with the bearish RSI indicator.
- The initial support level is seen at 0.8130; the immediate resistance level to watch is 0.8347.
The USD/CHF pair trades with mild gains near 0.8180 during the early European session on Tuesday, bolstered by a modest rebound of the US Dollar (USD). Nonetheless, tariff uncertainty and the persistent geopolitical tensions in the Middle East might boost the safe-haven currency like the Swiss Franc (CHF) and create a headwind for the pair.
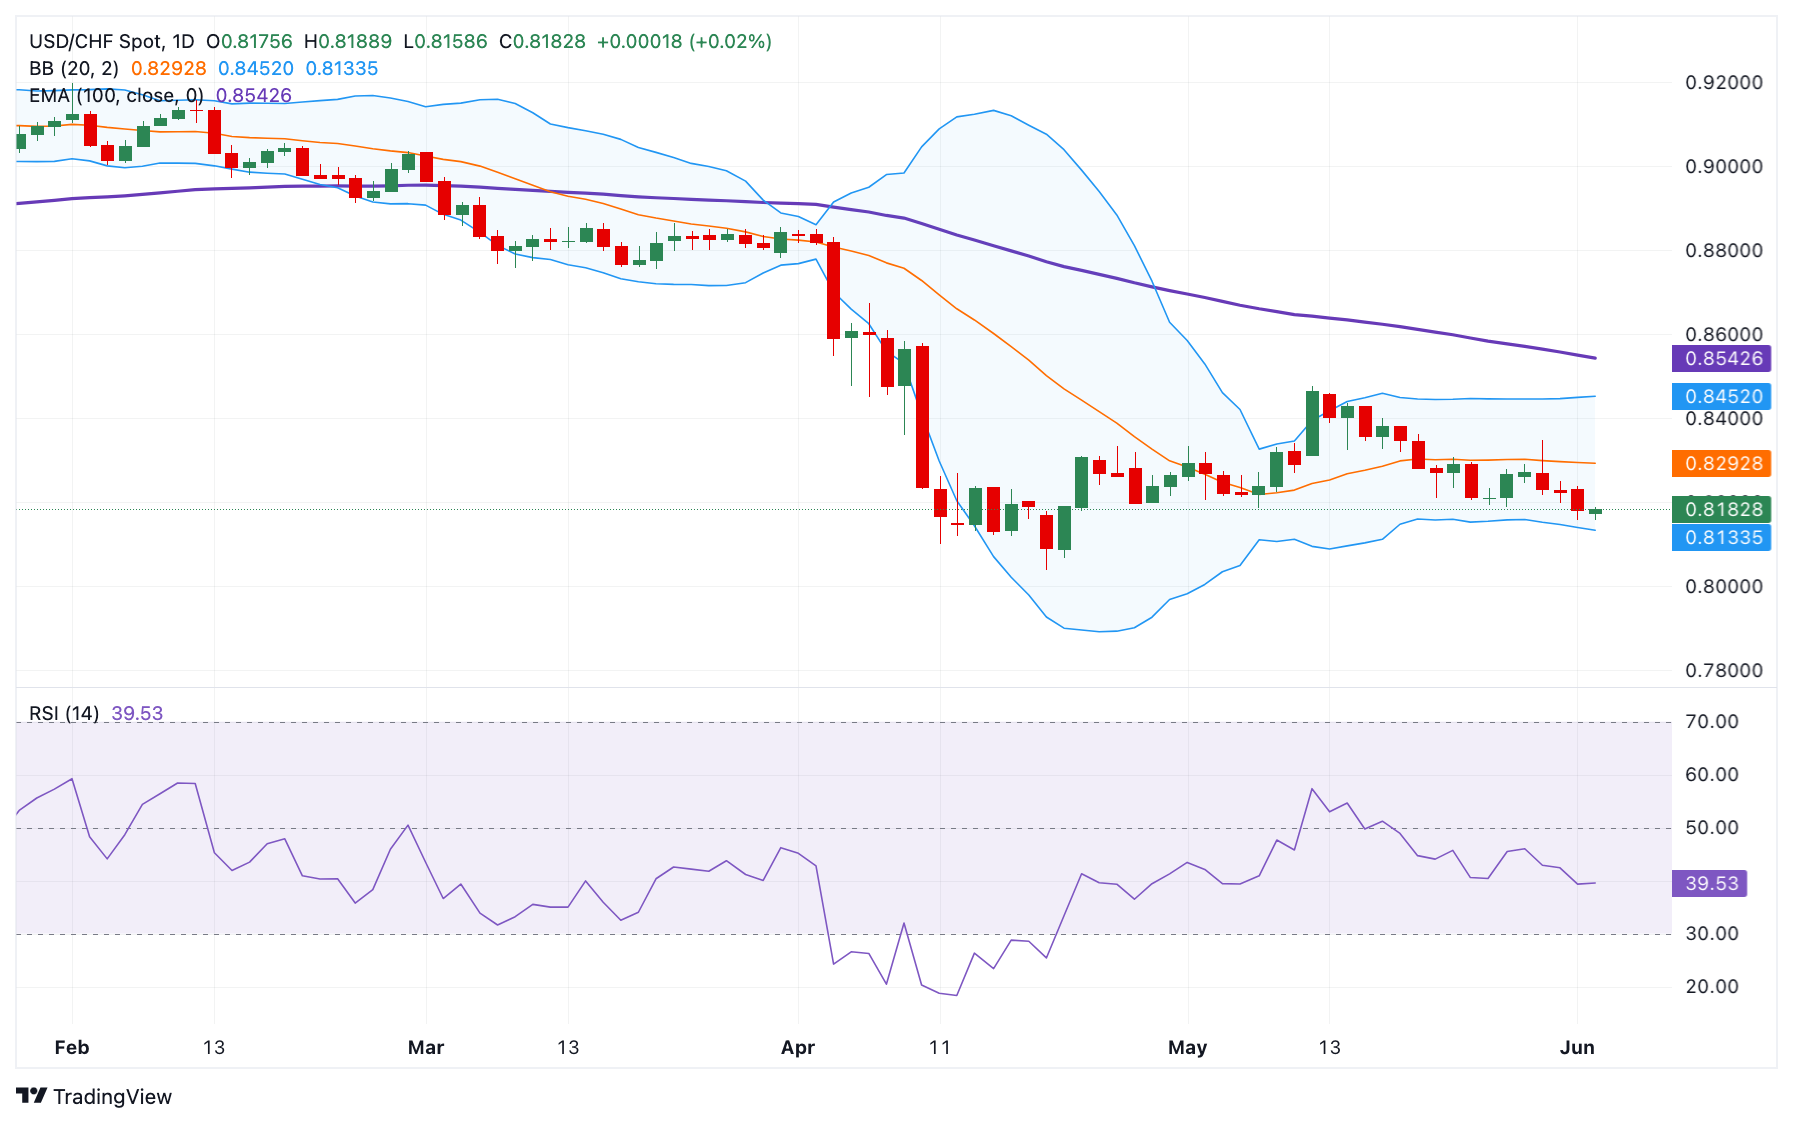
Technically, the bearish outlook of USD/CHF remains in play as the pair remains capped below the key 100-day Exponential Moving Average (EMA) on the daily chart. Furthermore, the downward momentum is supported by the 14-day Relative Strength Index (RSI), which is located below the midline around 39.60, suggesting that the path of least resistance is to the downside.
The lower limit of the Bollinger Band at 0.8130 acts as an initial support level for USD/CHF. A decisive break below the mentioned level could expose 0.8039, the low of April 21. Further south, the next contention level is seen at the 0.8000 psychological level.
On the bright side, the first upside barrier for the pair emerges at 0.8347, the high of May 29. Sustained trading above this level could pave the way to 0.8450, the upper boundary of the Bollinger Band. Extended gains could see the next hurdle at 0.8542, the 100-day EMA.
USD/CHF daily chart