- AUD/JPY drifts lower on Tuesday in reaction to dovish-sounding RBA meeting Minutes.
- The technical setup favors bears and supports prospects for a further depreciating move.
- A broadly weaker could offer some support to spot prices and help limit deeper losses.
The AUD/JPY cross attracted some sellers after the Reserve Bank of Australia (RBA) meeting Minutes showed that the central bank had considered an outsized 50 basis point cut in May. Spot prices retreat around 50 pips from the Asian session high and drop to the 92.35 region in the last hour, though the downfall lacks bearish conviction amid a broadly weaker Japanese Yen (JPY).
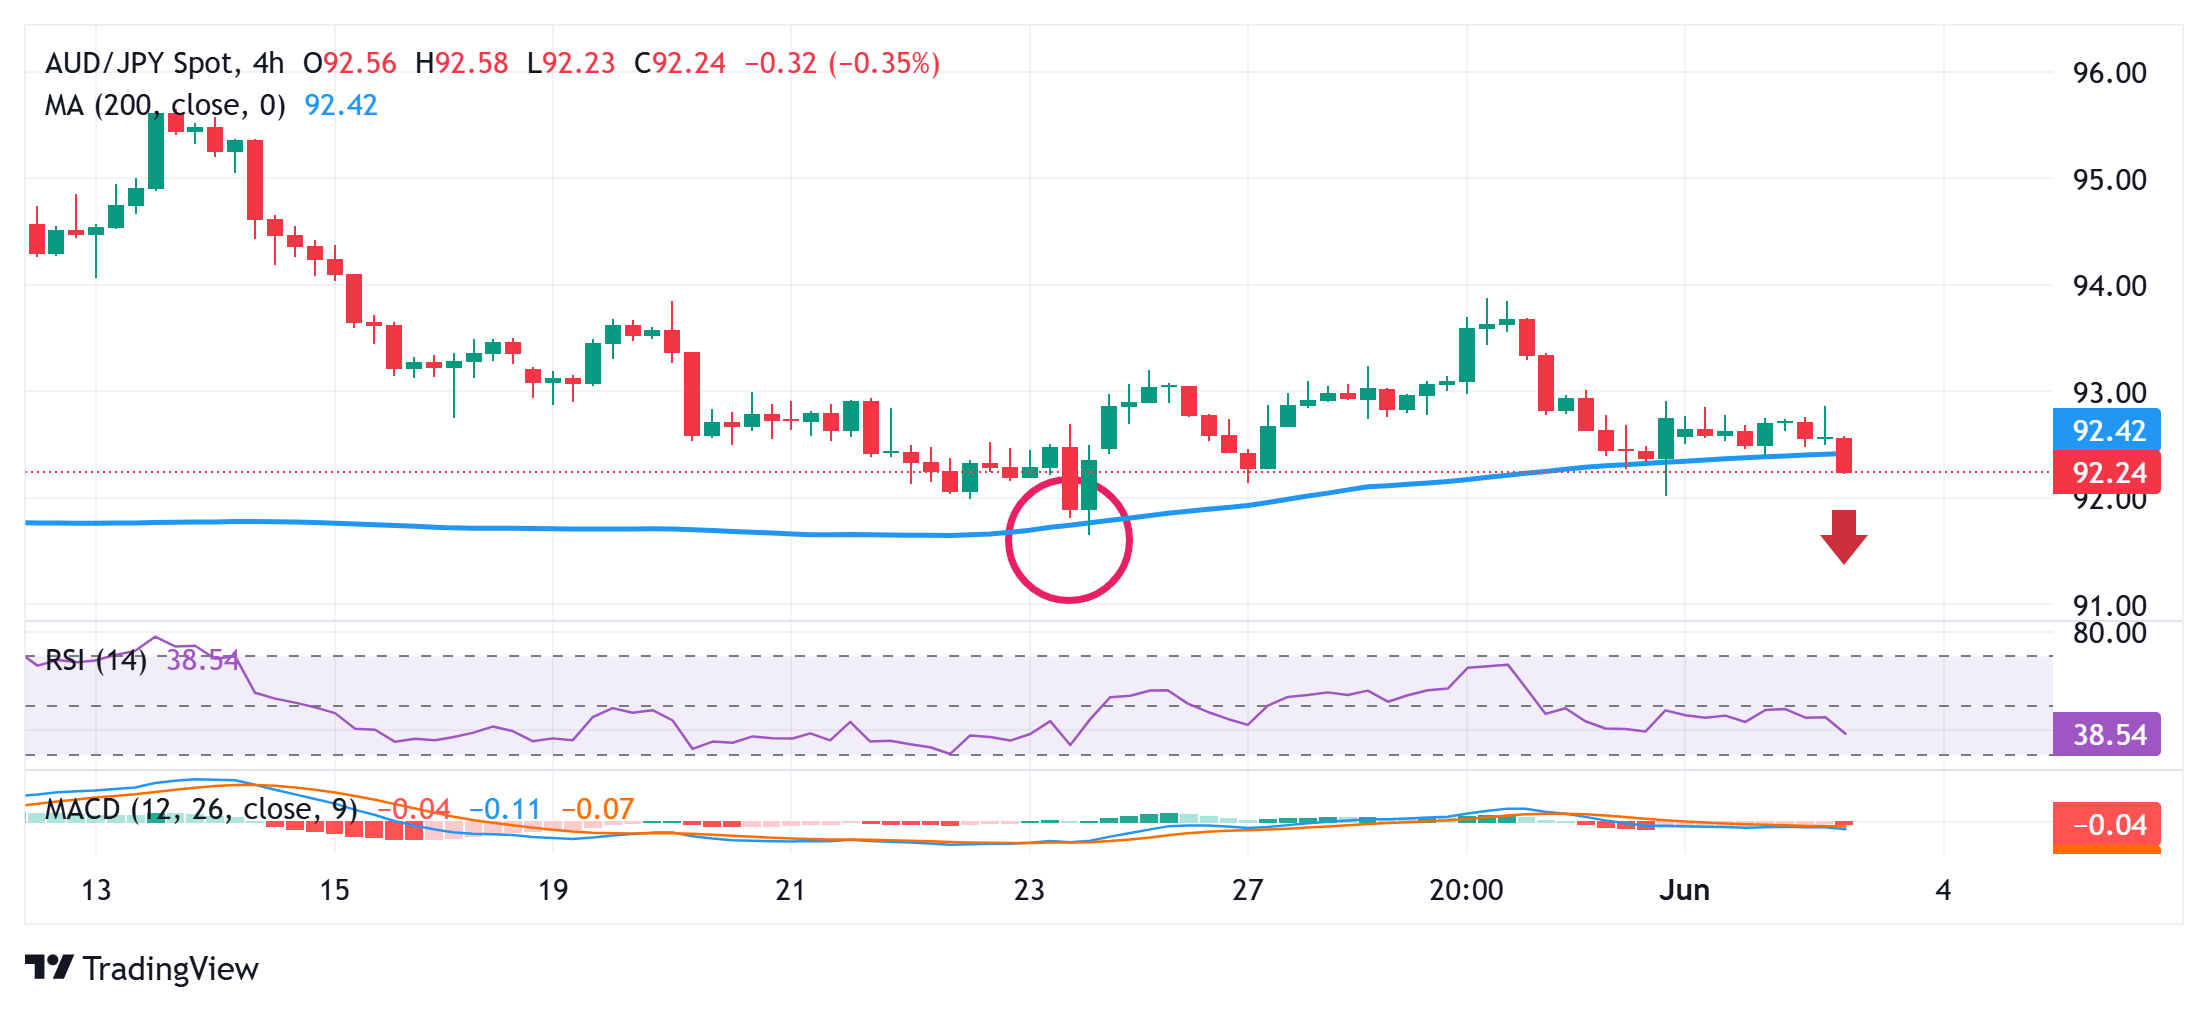
From a technical perspective, the AUD/JPY cross is currently placed just below the 200-period Simple Moving Average (SMA) pivotal support on the 4-hour chart. Given that oscillators on hourly/daily charts have started gaining negative traction, some follow-through selling will be seen as a key trigger for bearish traders and pave the way for deeper losses. Spot prices might then slide to last week’s swing low, around the 92.00 mark, and resume its recent retracement slide from a two-month peak touched in May.
The subsequent fall could drag the AUD/JPY cross to the 91.65 intermediate support en route to the 91.25-91.20 horizontal resistance breakpoint and the 91.00 round figure. The latter should act as a strong base for spot prices, which if broken decisively should pave the way for some meaningful depreciating move in the near term.
On the flip side, the 92.80-92.85 region, or the Asian session peak, now seems to have emerged as an immediate hurdle. A sustained move beyond could lift the AUD/JPY cross beyond the 93.00 mark and the 93.15-93.20 supply zone, towards last week’s swing high, around the 93.85 area. This is closely followed by the 94.00 round figure, which if cleared decisively might shift the bias in favor of bullish traders and set the stage for a move towards testing the next relevant hurdle near the 94.70-94.75 region.
AUD/JPY 4-hour chart