الأسواق العالمية
مؤشر S&P 500 — مؤشر الشركات الأمريكية ذات رؤوس الأموال الكبيرة
ناسداك 100 — مؤشر شركات التكنولوجيا النامية
داو جونز — المؤشر الصناعي
مؤشر FTSE 100 — الشركات الرائدة في المملكة المتحدة
مؤشر يورو ستوكس 50 — الشركات الرائدة في منطقة اليورو
مؤشر داكس 40 — الأسهم الألمانية
CAC 40 — مؤشر السوق الفرنسي
مؤشر نيكي 225 — المؤشر القياسي الياباني
هانغ سنغ — مؤشر هونغ كونغ
مؤشر شنغهاي المركب — الصين القارية
مؤشر ASX 200 — السوق الأسترالية
مؤشر TSX المركب — مؤشر كندا
مؤشر «نيفتي 50» — الشركات الهندية ذات رؤوس الأموال الكبيرة
مؤشر STI — سوق سنغافورة
KOSPI — مؤشر كوريا الجنوبية
بوفيسبا — أسهم البرازيل
مؤشر JSE Top 40 — مؤشر جنوب أفريقيا
مؤشر IPC — سوق المكسيك
MarketsSilverTechnical Analysis

XAG/USD remains close to bullish flag hurdle near $33.20 area

  • Silver regains positive traction following the previous day’s pullback from over one-week high.
  • The technical setup favors bullish traders and supports prospects for further near-term gains.
  • A break below a short-term descending channel support is needed to negate the positive bias.

Silver (XAG/USD) attracts fresh buying during the Asian session on Thursday and reverses a major part of the previous day’s retracement slide from over a one-week high. The white metal climbs to the $33.00 neighborhood in the last hour and seems poised to appreciate further.

From a technical perspective, a descending channel on short-term charts constitutes the formation of a bullish flag against the backdrop of the recent goodish recovery from the $28.45 area, or the year-to-date low touched in April. Moreover, oscillators on daily/hourly charts are holding in positive territory, validating the near-term constructive outlook for the XAG/USD.

However, it will still be prudent to wait for a breakout above the trend-channel hurdle near the $33.20 area before positioning for additional gains. The XAG/USD might then aim to surpass the $33.70 intermediate barrier and reclaim the $34.00 round-figure mark. Some follow-through buying will be seen as a fresh trigger for bulls and pave the way for a further appreciation.

On the flip side, the $32.50-$32.45 area, followed by the overnight swing low, around the $32.25 region, could offer some support to the XAG/USD ahead of the $32.00 mark. The next relevant support is pegged around the $31.60-$31.55 zone, representing the lower end of the aforementioned trend-channel, which, if broken, might shift the near-term bias in favor of bearish traders.
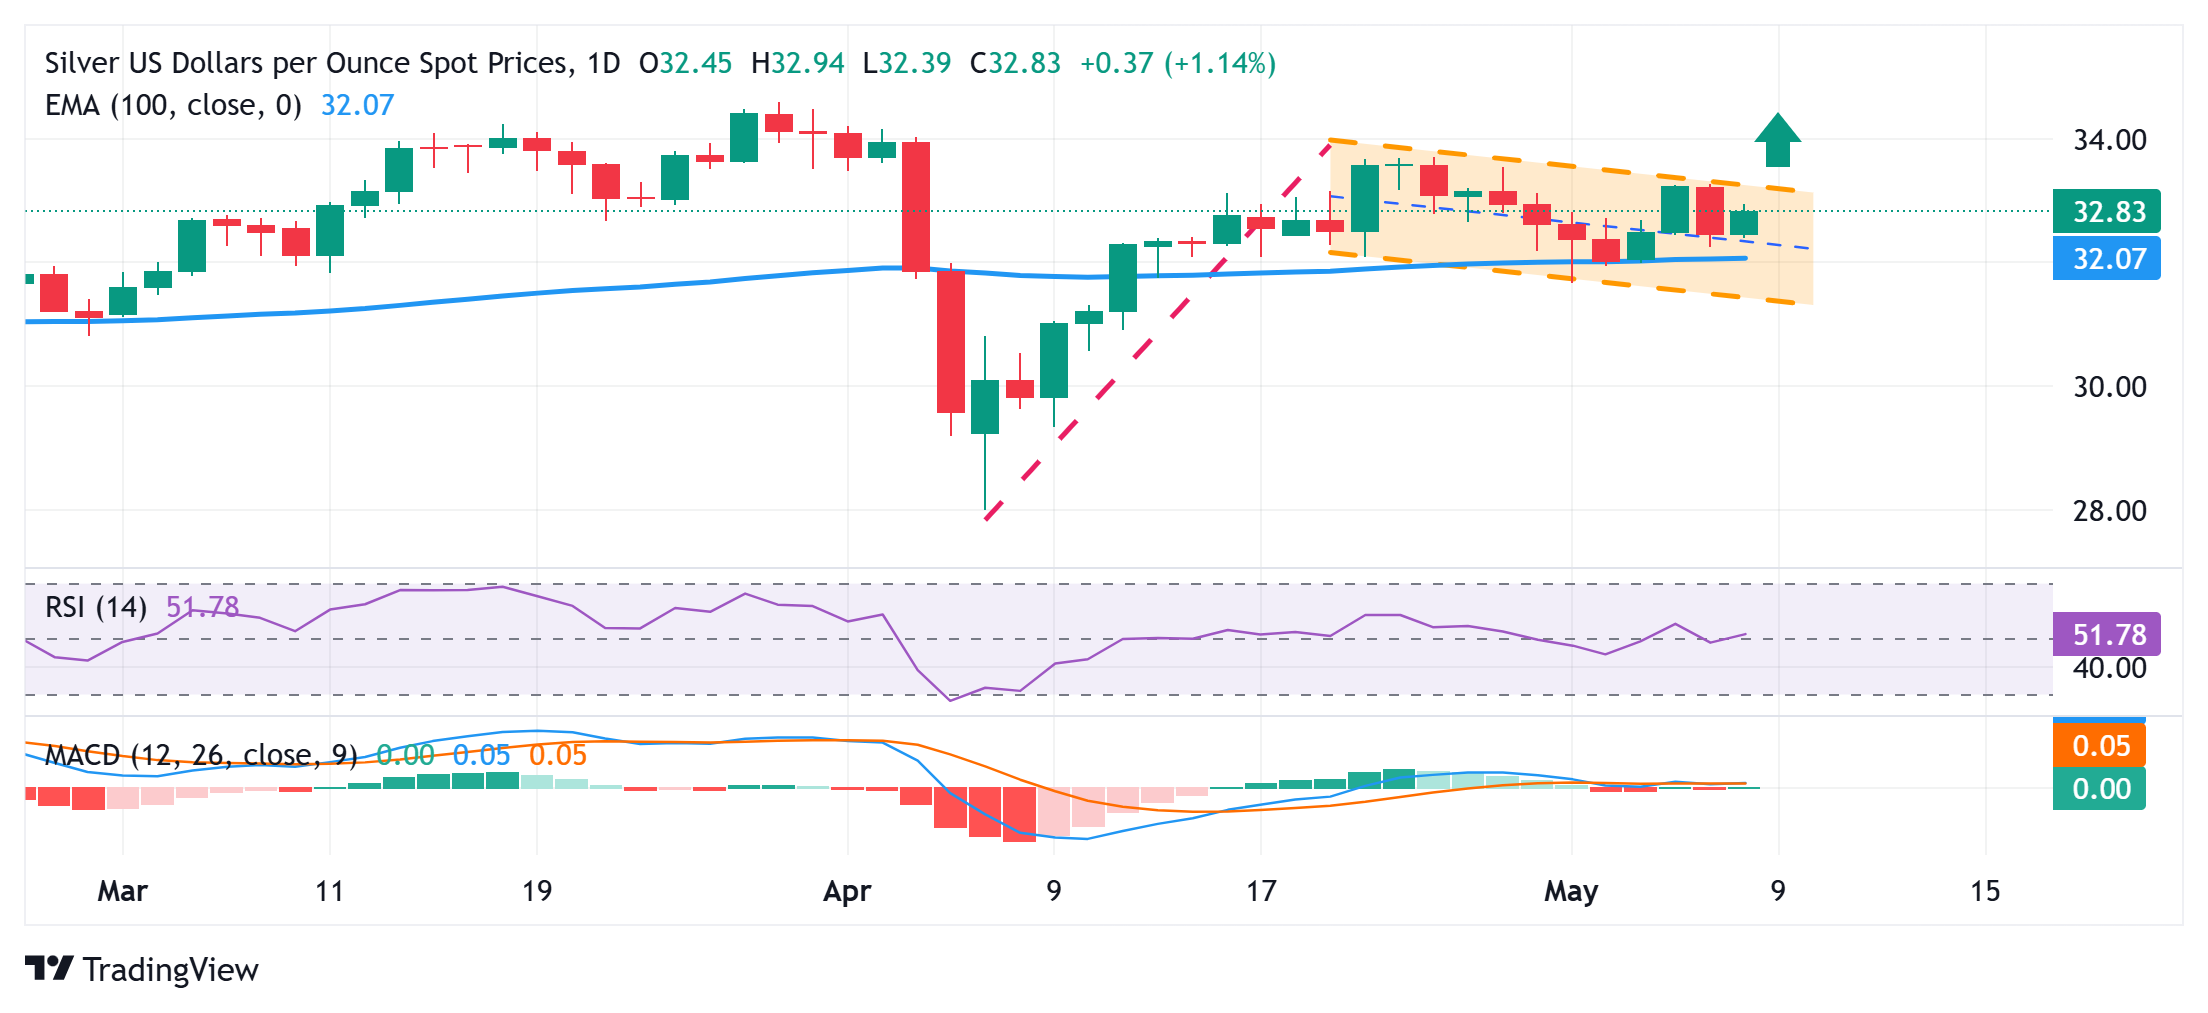
Silver daily chart

Octalas AI
شعار Octalas

الربح

الجميع يسارعون إلى خفض التكاليف. أما نحن، فنسرع نحو تحقيق الأرباح.

ابدأ البيع من خلال تقديم الخدمات

مجانًا لمدة 14 يومًا · لا حاجة لبطاقة ائتمان
الربح من خلال الذكاء الاصطناعي

مقالات ذات صلة

اترك تعليقًا

لن يتم نشر عنوان بريدك الإلكتروني. الحقول الإلزامية مميزة بعلامة *

زر «العودة إلى الأعلى»