S&P 500 — US Large Cap Index
 FTSE 100 — UK Blue Chips
 Euro Stoxx 50 — Eurozone Leaders
 DAX 40 — German Equities
 CAC 40 — French Market Index
 Nikkei 225 — Japan Benchmark
 Hang Seng — Hong Kong Index
 Shanghai Composite — China Mainland
 ASX 200 — Australian Market
 TSX Composite — Canada Index
 Nifty 50 — India Large Cap
 STI Index — Singapore Market
 KOSPI — South Korea Index
 Bovespa — Brazil Equities
 JSE Top 40 — South Africa Index
 IPC Index — Mexico Market
TRUMP, Brett, Solayer: Here’s why meme coins are in the green as Bitcoin’s momentum falters

- The Official Trump meme coin consolidates gains on Thursday following the announcement of a dinner that the US President will attend in May.
- Bitcoin’s drop from weekly highs could be a healthy pullback ahead of another push towards $100,000.
- Brett bulls show signs of exhaustion after a near 150% increase from April’s low at $0.0235.
- Solayer’s uptrend is steady as bulls advance price discovery, aiming for new all-time highs.
The cryptocurrency market climbed higher on Tuesday and Wednesday, building on improving risk-on sentiment after United States (US) President Donald Trump softened his tone on the Federal Reserve (Fed) Chair Jerome Powell and China. Bitcoin (BTC) surged, reaching a 51-day high of $94,696. Altcoins, including meme coins, rallied behind BTC, with some, such as Official Trump (TRUMP), Brett, and Solayer (Layer), holding onto recent gains at the time of writing on Thursday, although prices across the market signal a potential retracement.
Trump meme coin explodes ahead of President Trump’s dinner
The team behind the Official Trump meme coin announced on Wednesday that it will host a dinner for the token’s top 220 holders, where they will meet President Trump. This exclusive dinner will take place at the Trump National Club in Washington, DC on May 22.
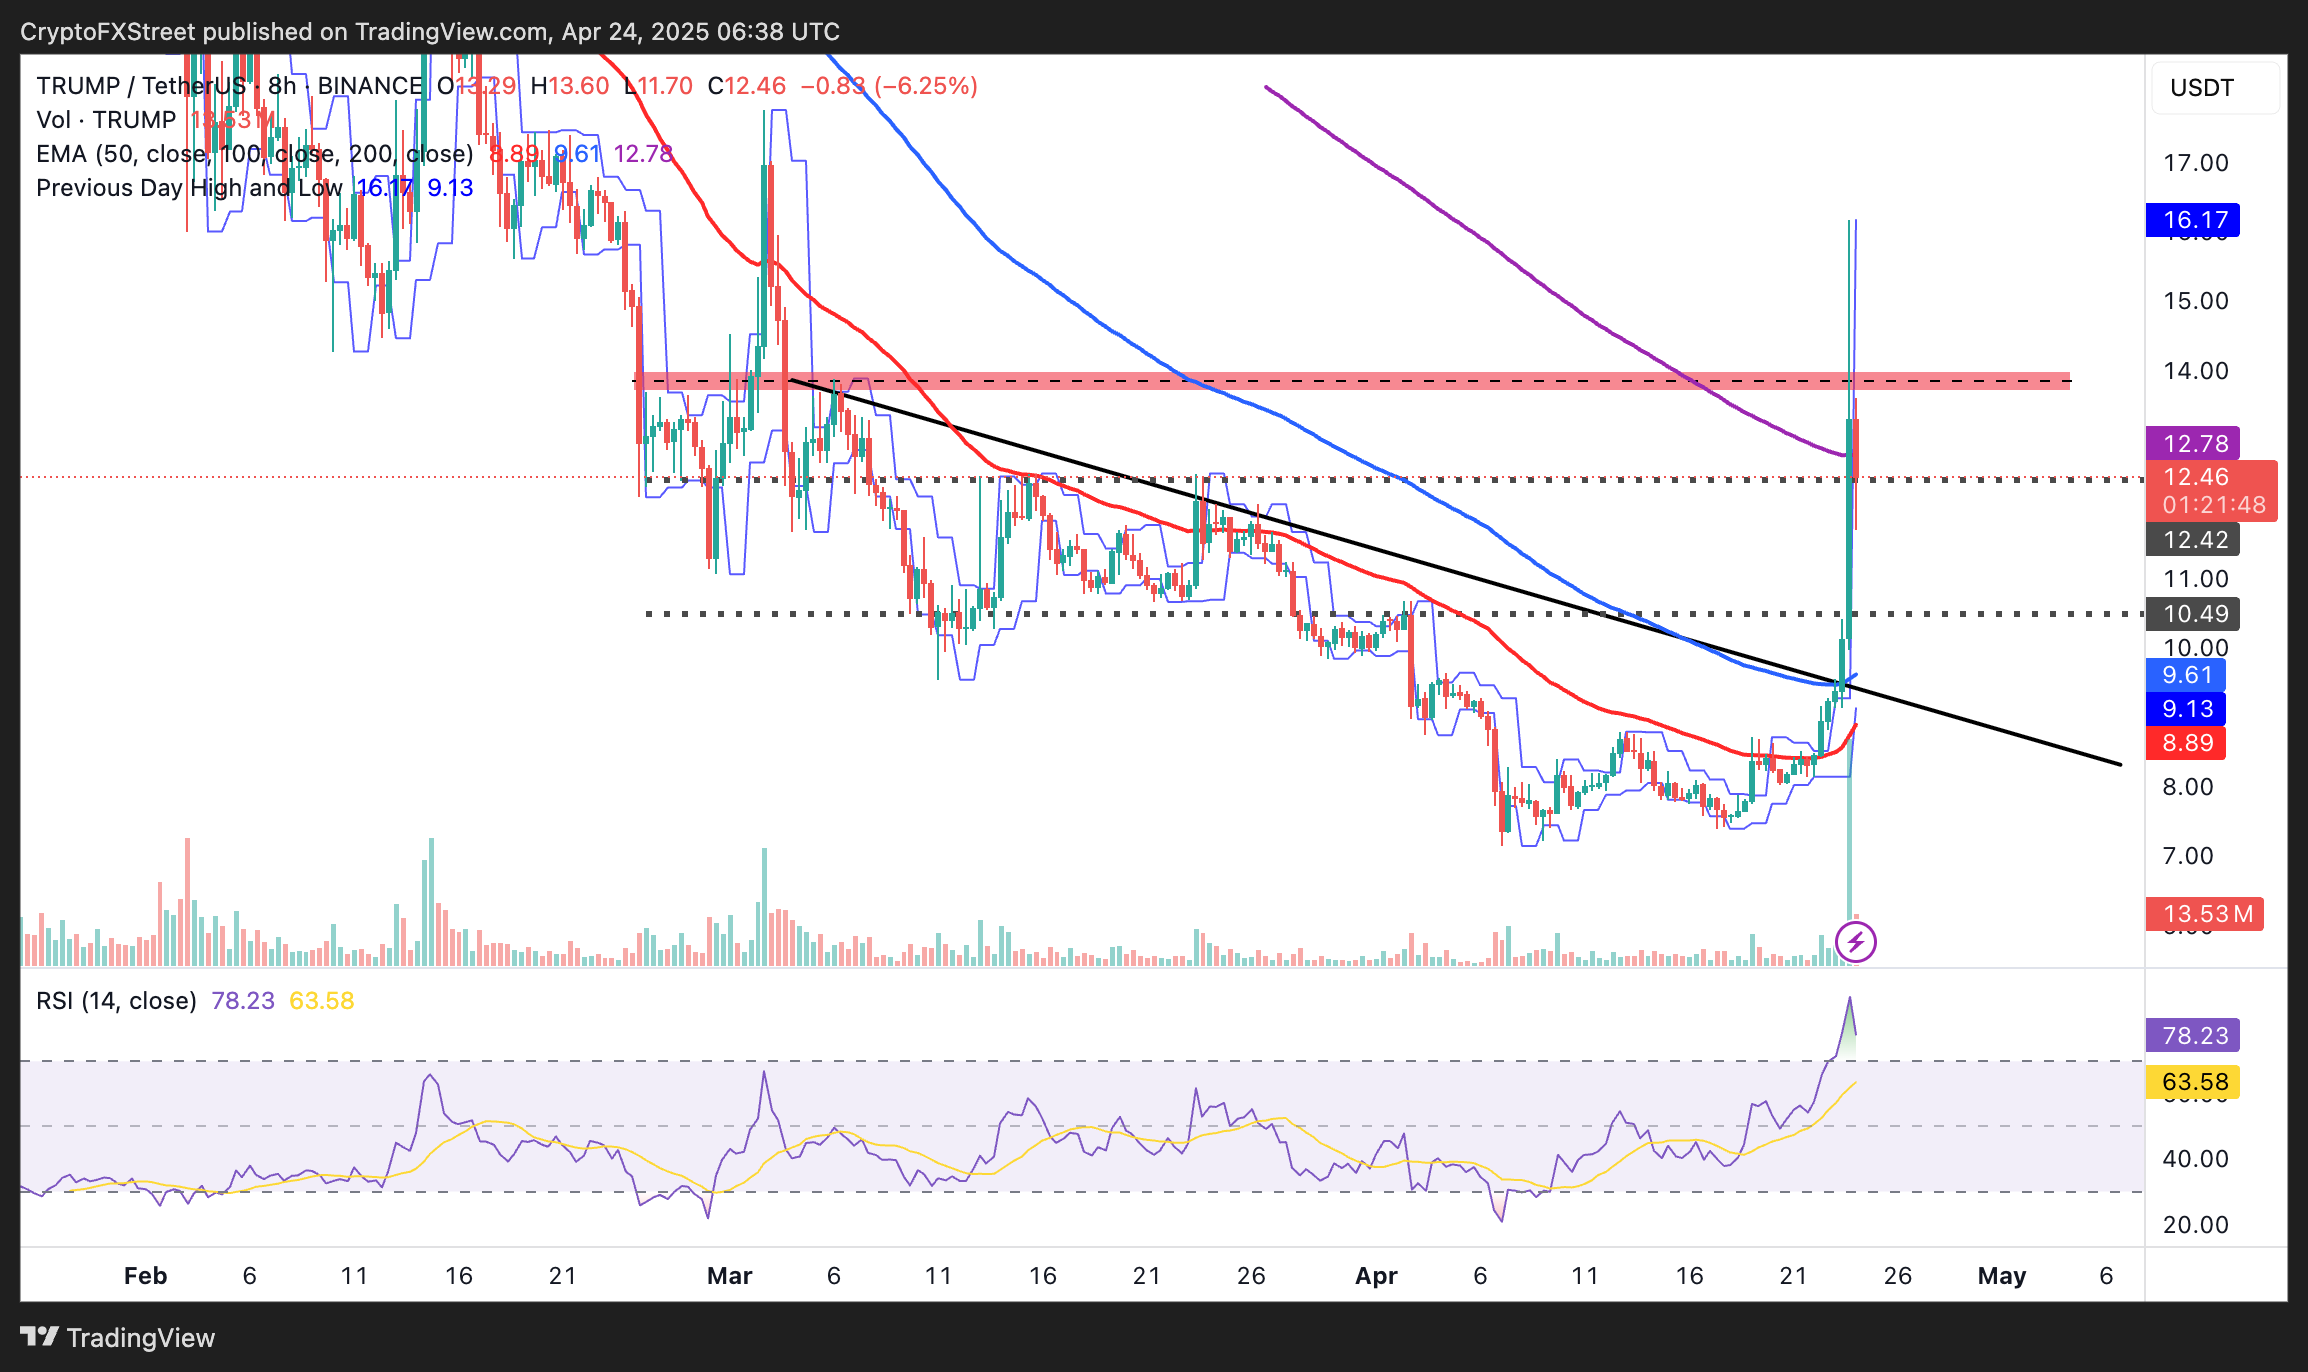
TRUMP exploded in double-digit gains following the announcement, reaching a daily high of $16.17. However, the meme coin has since clawed back some of the gains, possibly due to profit-taking.
TRUMP/USDT 8-hour chart
However, the Relative Strength Index (RSI) indicator on the 8-hour chart holds at overbought territory at 77.03, signaling a potential reversal in the coming sessions and days. With the token trading below the 8-hour 200 Exponential Moving Average (EMA) at the time of writing, TRUMP could stretch the retracement to $10.50, accentuated by potential profit-taking. Beyond this area, the 100 EMA at $9.61 and the 50 EMA at $8.89 highlight other key support levels.
Brett retraces from the previous day’s high
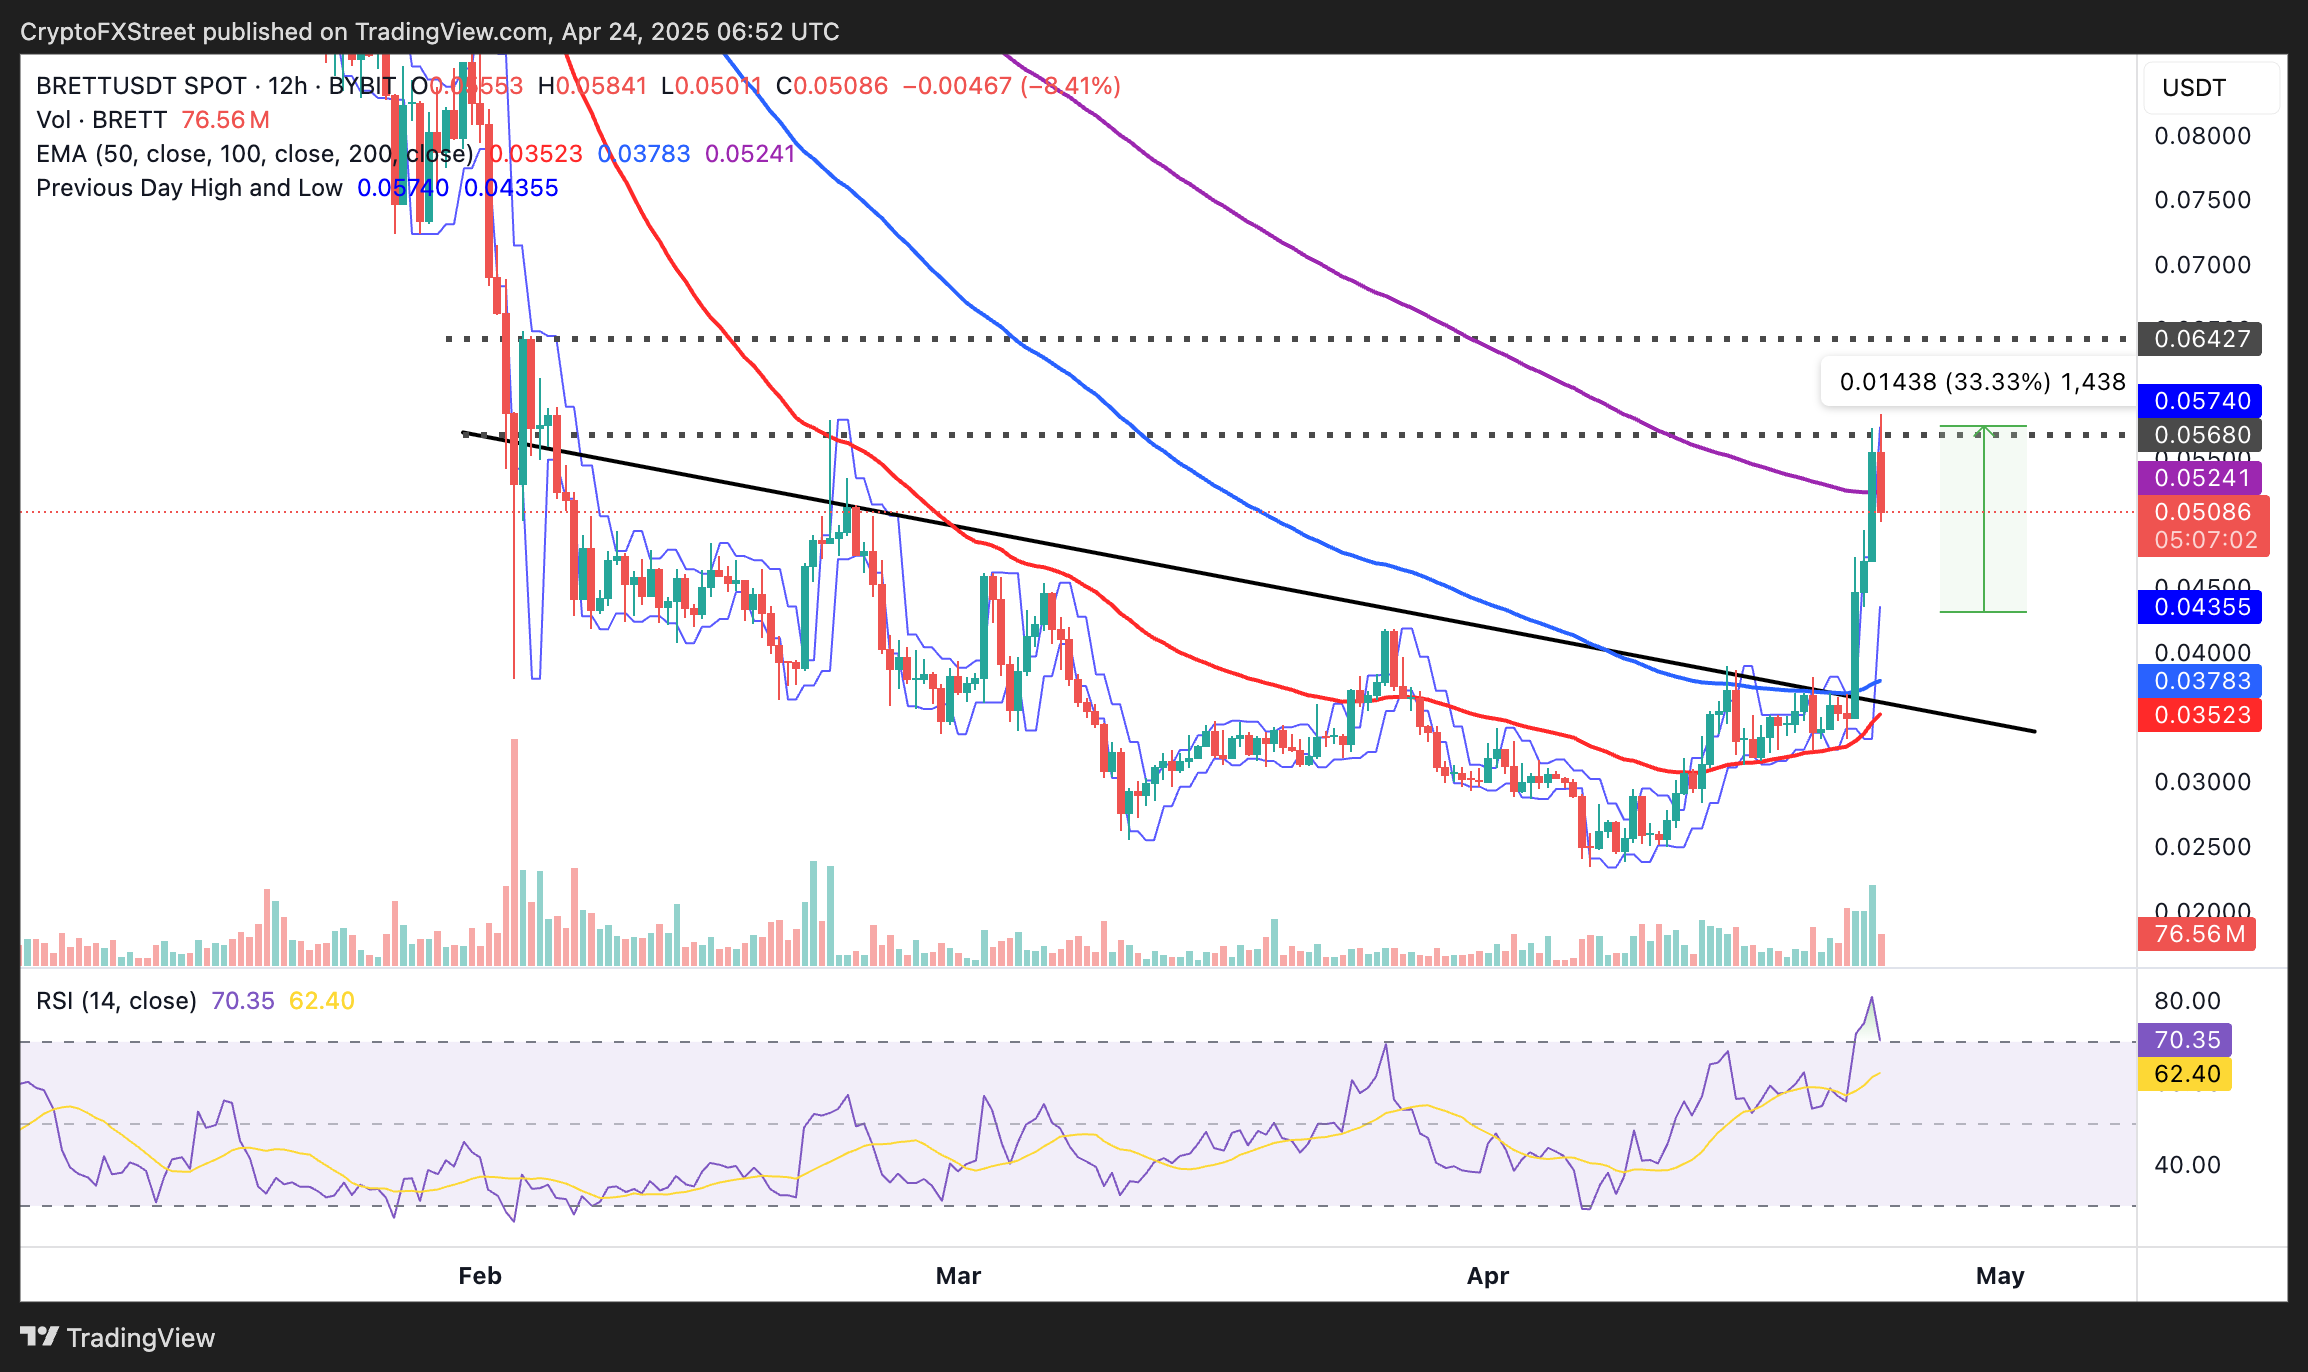
Brett’s price increased 24% on Wednesday, extending gains from April’s low of $0.0235 and topping at $0.0574. Despite this impressive performance, the meme coin, reflecting a broader market-wide sentiment, retraces and trades at $0.0508 at the time of writing on Thursday.
After lifting into overbought territory on Wednesday, the RSI at 70.16 hints at an extended retracement unless bulls push to reclaim position above the 12-hour 200 EMA at $0.0524. Such a move could sustain investor interest in Brett, paving the way for gains above $0.0642, a resistance last tested in February.
BRETT/USDT 12-hour chart
Solayer enters a new phase of price discovery
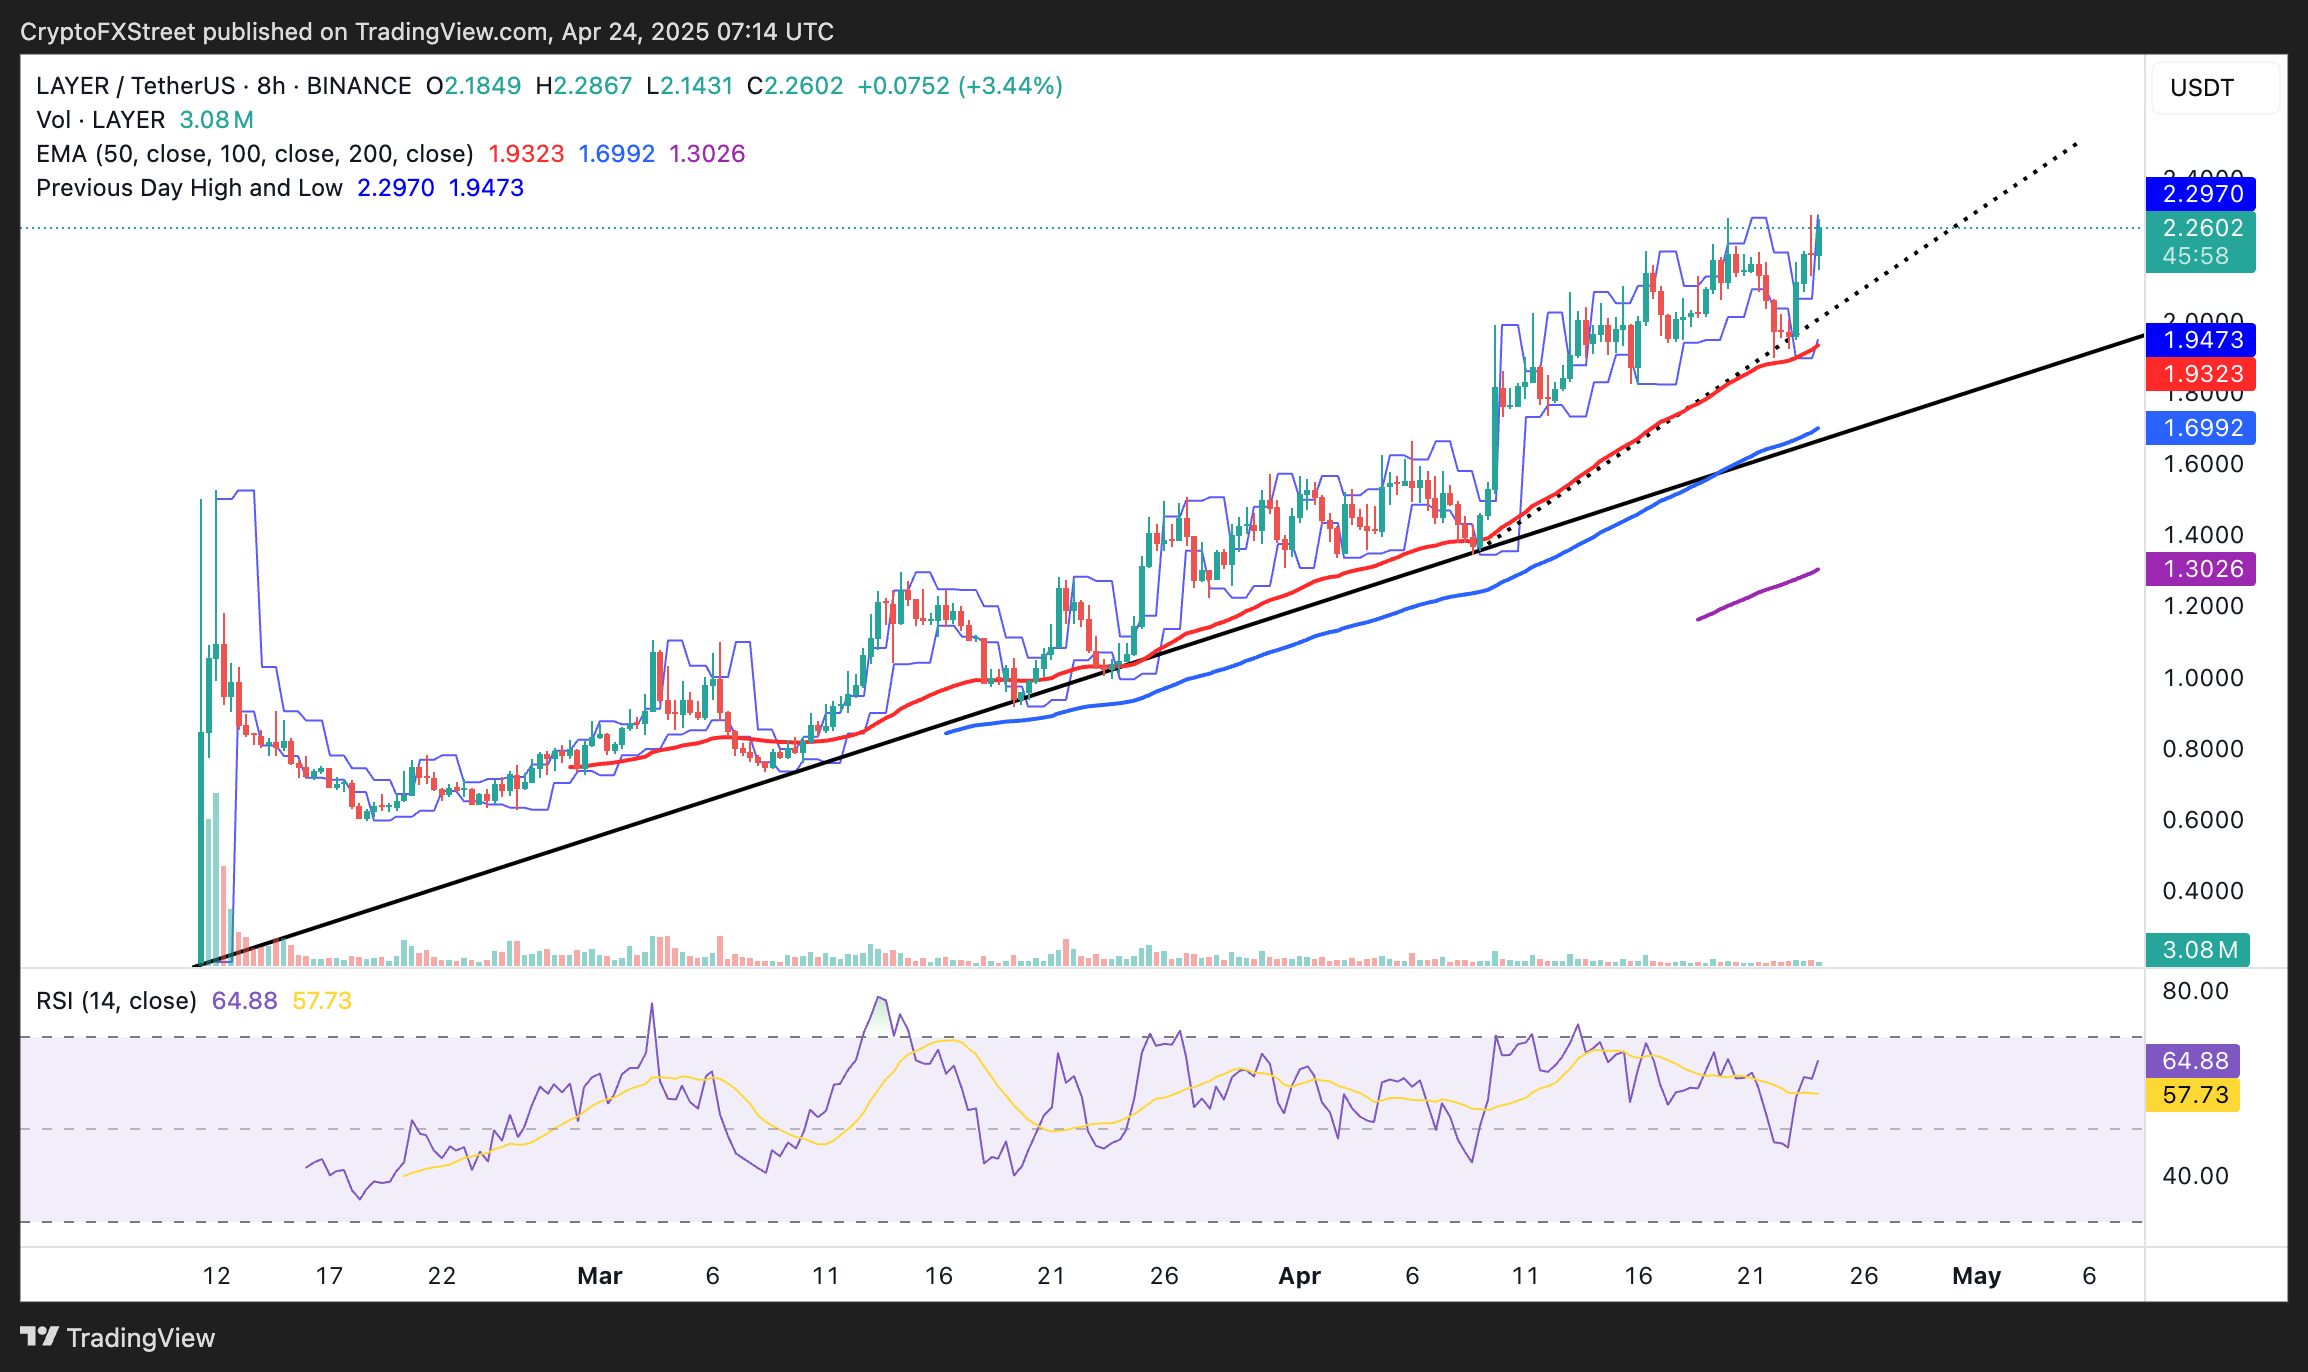
Solayer’s price relentlessly edges higher, hitting a new milestone at $2.29 (its current all-time high) and trading at $2.23 at the time of writing on Thursday. The token has maintained a position above an ascending trendline since its listing on Binance in February. LAYER sits above the 8-hour 50, 100 and 200 EMAs, as observed on the chart below.
LAYER/USDT 8-hour chart
With the RSI indicator at 63.98 and pointing upward, Solayer has room to grow, likely continuing its price discovery phase. Traders could closely monitor the RSI indicator and volume for signs of exhaustion, particularly if the RSI reaches overbought levels. Alongside moving averages, ascending trendlines could offer strong support if the trend reverses.