S&P 500 — US Large Cap Index
 FTSE 100 — UK Blue Chips
 Euro Stoxx 50 — Eurozone Leaders
 DAX 40 — German Equities
 CAC 40 — French Market Index
 Nikkei 225 — Japan Benchmark
 Hang Seng — Hong Kong Index
 Shanghai Composite — China Mainland
 ASX 200 — Australian Market
 TSX Composite — Canada Index
 Nifty 50 — India Large Cap
 STI Index — Singapore Market
 KOSPI — South Korea Index
 Bovespa — Brazil Equities
 JSE Top 40 — South Africa Index
 IPC Index — Mexico Market
- Silver price may rise toward the upper ascending channel boundary around $79.30.
- The 14-day Relative Strength Index stands at 70.51, indicating overbought conditions and stretched momentum.
- The primary support lies at the nine-day EMA of $71.02.
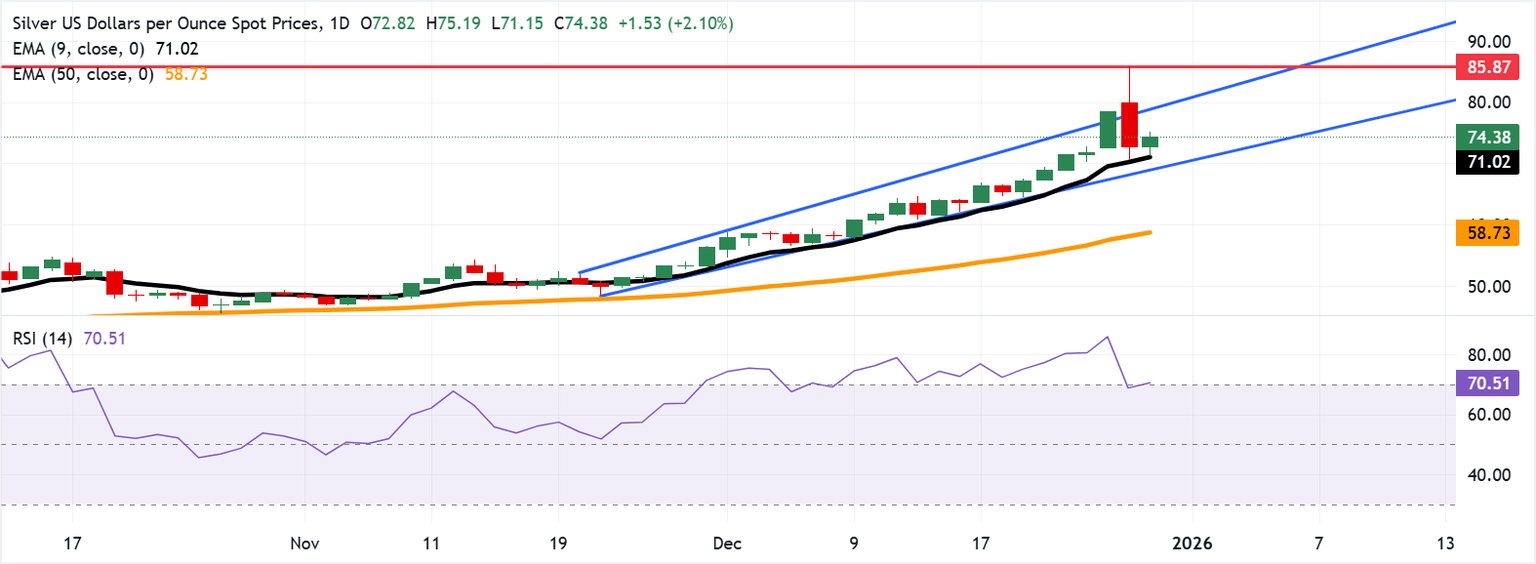
Silver price (XAG/USD) gains more than 2% after registering a steep drop of more than 7% in the previous session, trading around $74.40 per troy ounce during the early European hours on Tuesday. Traders engaged in aggressive profit-taking after the XAG/USD pair hit a record high of $85.87 in the previous session.
The technical analysis of the daily chart timeframe suggests the price of the precious metal moves upwards within an ascending channel pattern, strengthening the bullish bias. The 14-day Relative Strength Index (RSI) stands at 70.51 (overbought), signaling stretched momentum.
The nine-day Exponential Moving Average (EMA) rises above the 50-day EMA, and the price holds well above both, framing a strong bullish trend. The short-term average has steepened in recent sessions, reinforcing upside bias.
Immediate resistance aligns at the upper boundary of the ascending channel around $79.30. A break above the channel would help the Silver price to approach the record high of $85.87, which was recorded on December 29.
A sustained push through the channel could extend gains toward new cycle highs, while failure to clear it would encourage consolidation. With moving averages trending higher and positive momentum intact, dips would attract buyers, and the trend would remain supported above the short-term average.
On the downside, support is seen at the nine-day EMA of $71.02, followed by the lower ascending channel boundary around $69.00. Further declines below this confluence support zone would open the doors for the Silver price to explore the region around the 50-day EMA at $58.73.