S&P 500 — US Large Cap Index
 FTSE 100 — UK Blue Chips
 Euro Stoxx 50 — Eurozone Leaders
 DAX 40 — German Equities
 CAC 40 — French Market Index
 Nikkei 225 — Japan Benchmark
 Hang Seng — Hong Kong Index
 Shanghai Composite — China Mainland
 ASX 200 — Australian Market
 TSX Composite — Canada Index
 Nifty 50 — India Large Cap
 STI Index — Singapore Market
 KOSPI — South Korea Index
 Bovespa — Brazil Equities
 JSE Top 40 — South Africa Index
 IPC Index — Mexico Market
- Zcash extends the uptrend for the fifth consecutive day, recording over 370% gains in October so far.
- Pi Network breaks out of a descending triangle pattern, rising nearly 20% in the last 24 hours.
- Pump.fun steadies after a 15% jump on Sunday, with bulls eyeing the $0.005000 psychological mark.
Zcash (ZEC), Pi Network (PI), and Pump.fun (PUMP) emerge as the top performers among the top 100 cryptocurrencies in the last 24 hours, with double-digit gains. The recovery in ZEC, PI, and PUMP aligns with rising bullish momentum, signaling further gains if the broader cryptocurrency market holds steady.
Zcash rally aims for a fresh record high
Zcash edges higher by 12% at press time on Monday, extending the 17% gains from Sunday. With the fifth consecutive day of an uptrend, the privacy coin approaches the all-time high of $372 and the R1 Pivot Point at $381, both of which serve as resistance levels on the 4-hour chart.
A decisive close above $381 could frame the R2 Pivot Point as the primary breakout target at $436.
The momentum indicators on the 4-hour chart maintain a bullish incline as the Moving Average Convergence Divergence (MACD) extends the uptrend with rising green histogram bars above the zero line.
At the same time, the Relative Strength Index (RSI) reads 73 on the same chart, remains overbought, suggesting heightened buying pressure.
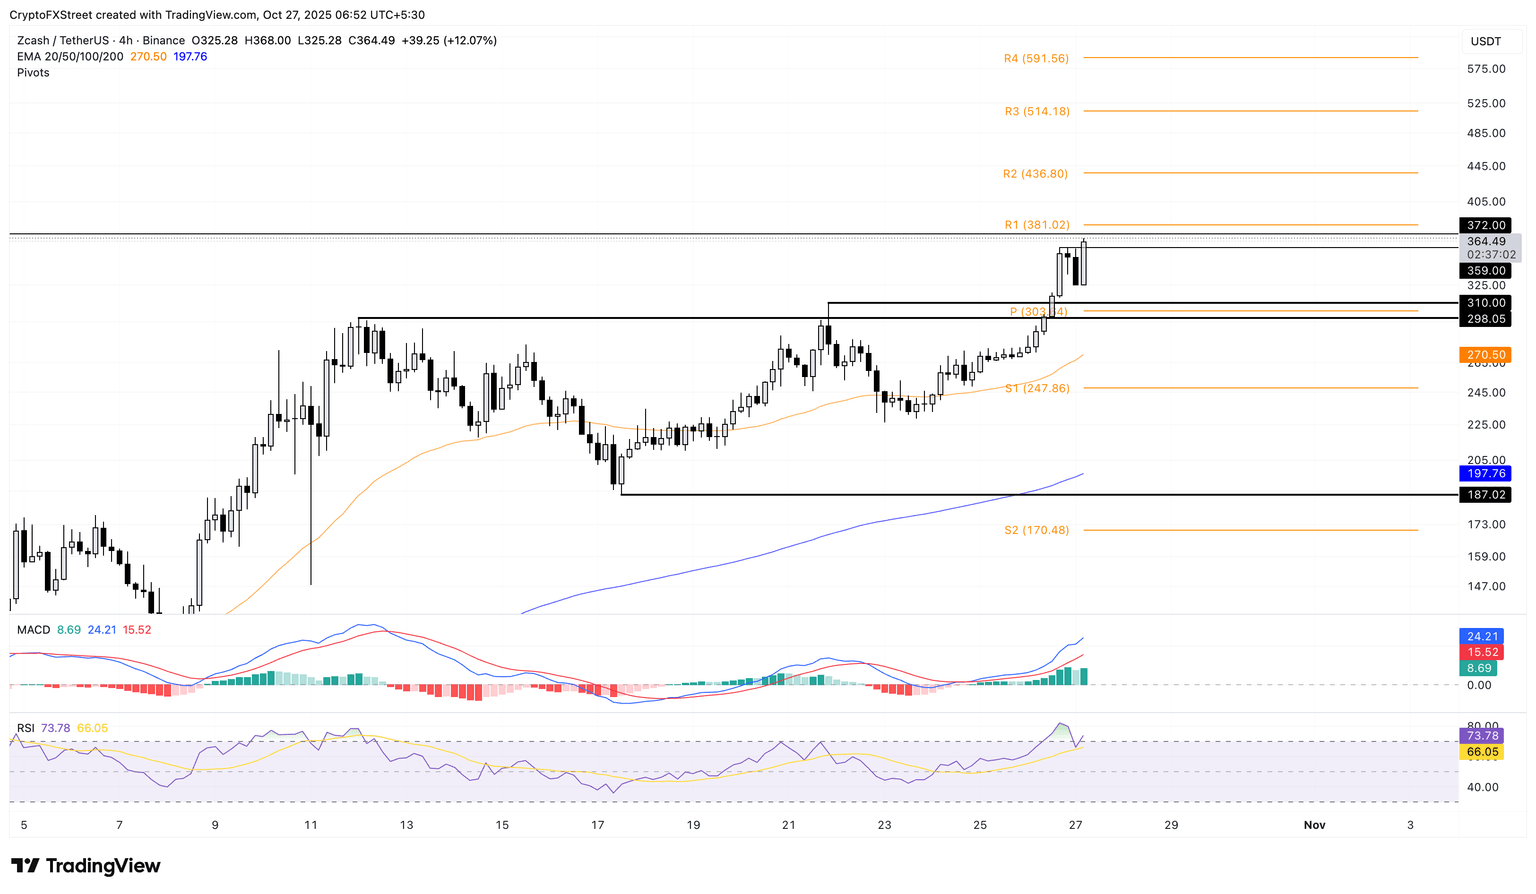
ZEC/USDT 4-hour price chart.
On the flip side, the crucial support level for Zcash is the central Pivot Point at $303.
Pi Network bounces back with strong bullish momentum
Pi Network trades above $0.2500 at press time on Monday, approaching the 50-day Exponential Moving Average (EMA) at $0.2627. The PI token is up 13% on the day so far, adding to the 7% gains from Sunday.
If PI exceeds this dynamic resistance, it could target the $0.3220 level, which previously acted as a key support level in late September.
The MACD and signal line are in a steady upward trend following the October 18 crossover, indicating that buying pressure is on the rise. Additionally, the RSI at 60 shows room for further growth before reaching the overbought zone.
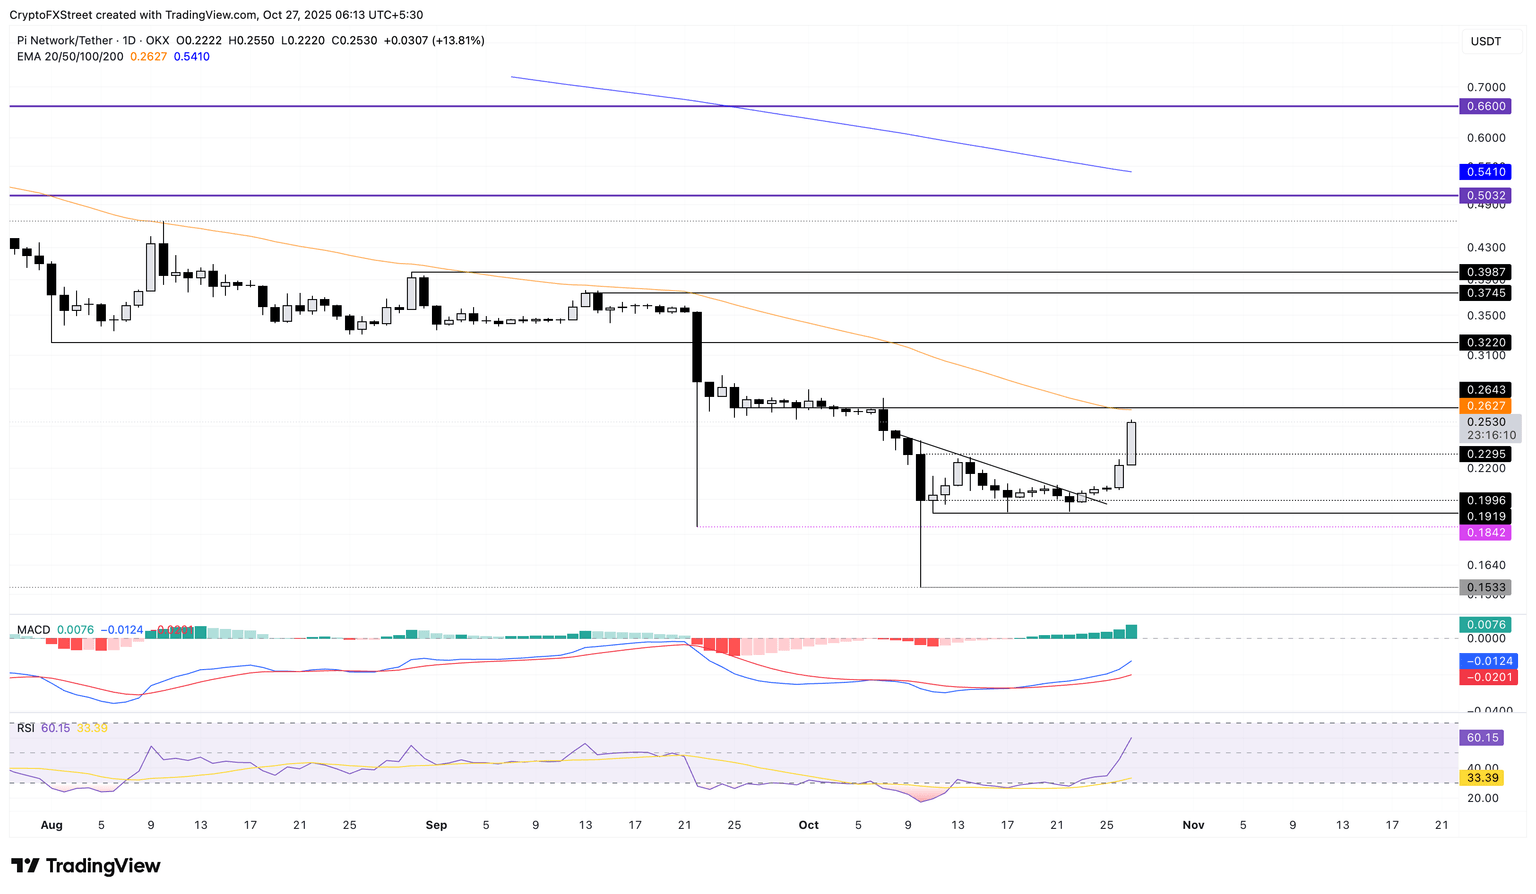
PI/USDT daily price chart.
Looking down, the key support for PI remains at $0.1919, marked by the October 11 low.
Pump.fun recovery hits the 50-day EMA
Pump.fun holds steady above the 50-day EMA at $0.004788 at the time of writing on Monday. The PUMP token has added 1% on the day so far, following the 15% rise from the previous day.
The Pump.fun bulls eye the central Pivot Point at $0.006057, if the uptrend sustains above the 50-day EMA.
Corroborating the bullish potential of the launchpad token, the MACD indicator shows a steady rise in the average lines, with three consecutive green bars above the zero line following a crossover on Saturday. Similarly, an RSI of 53, crossing above the halfway line, indicates a rise in buying pressure.
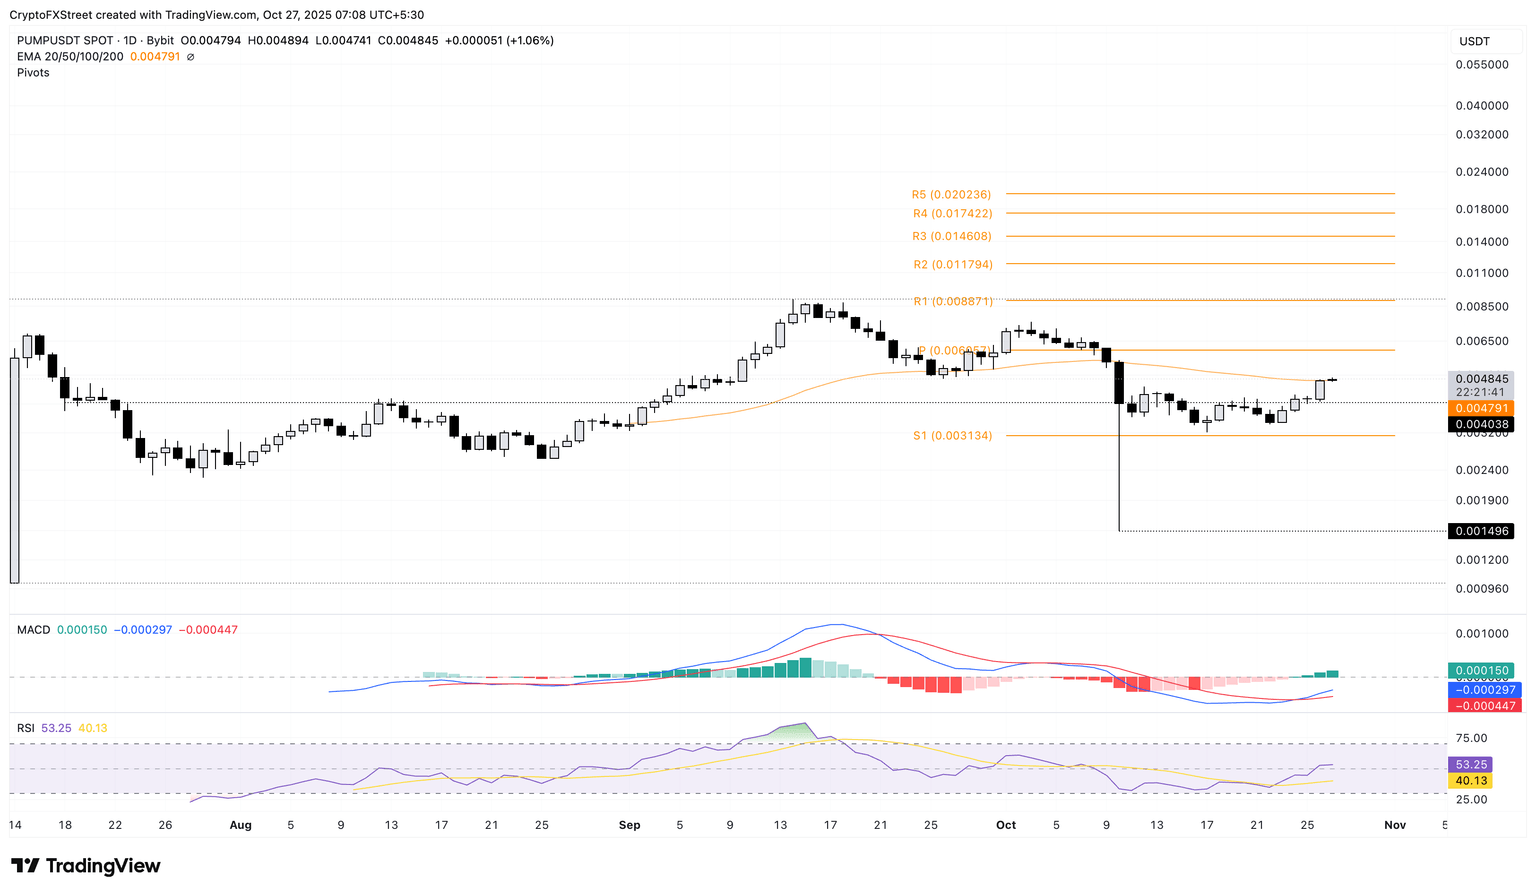
PUMP/USDT daily price chart.
On the other hand, a reversal in PUMP from the 50-day EMA at $0.004788 could retest the $0.004000 round figure, followed by the $0.003134 level, marked by the S1 Pivot Point.