S&P 500 — US Large Cap Index
 FTSE 100 — UK Blue Chips
 Euro Stoxx 50 — Eurozone Leaders
 DAX 40 — German Equities
 CAC 40 — French Market Index
 Nikkei 225 — Japan Benchmark
 Hang Seng — Hong Kong Index
 Shanghai Composite — China Mainland
 ASX 200 — Australian Market
 TSX Composite — Canada Index
 Nifty 50 — India Large Cap
 STI Index — Singapore Market
 KOSPI — South Korea Index
 Bovespa — Brazil Equities
 JSE Top 40 — South Africa Index
 IPC Index — Mexico Market
- Bitcoin edges higher on Thursday, holding ground above the $60,000 mark.
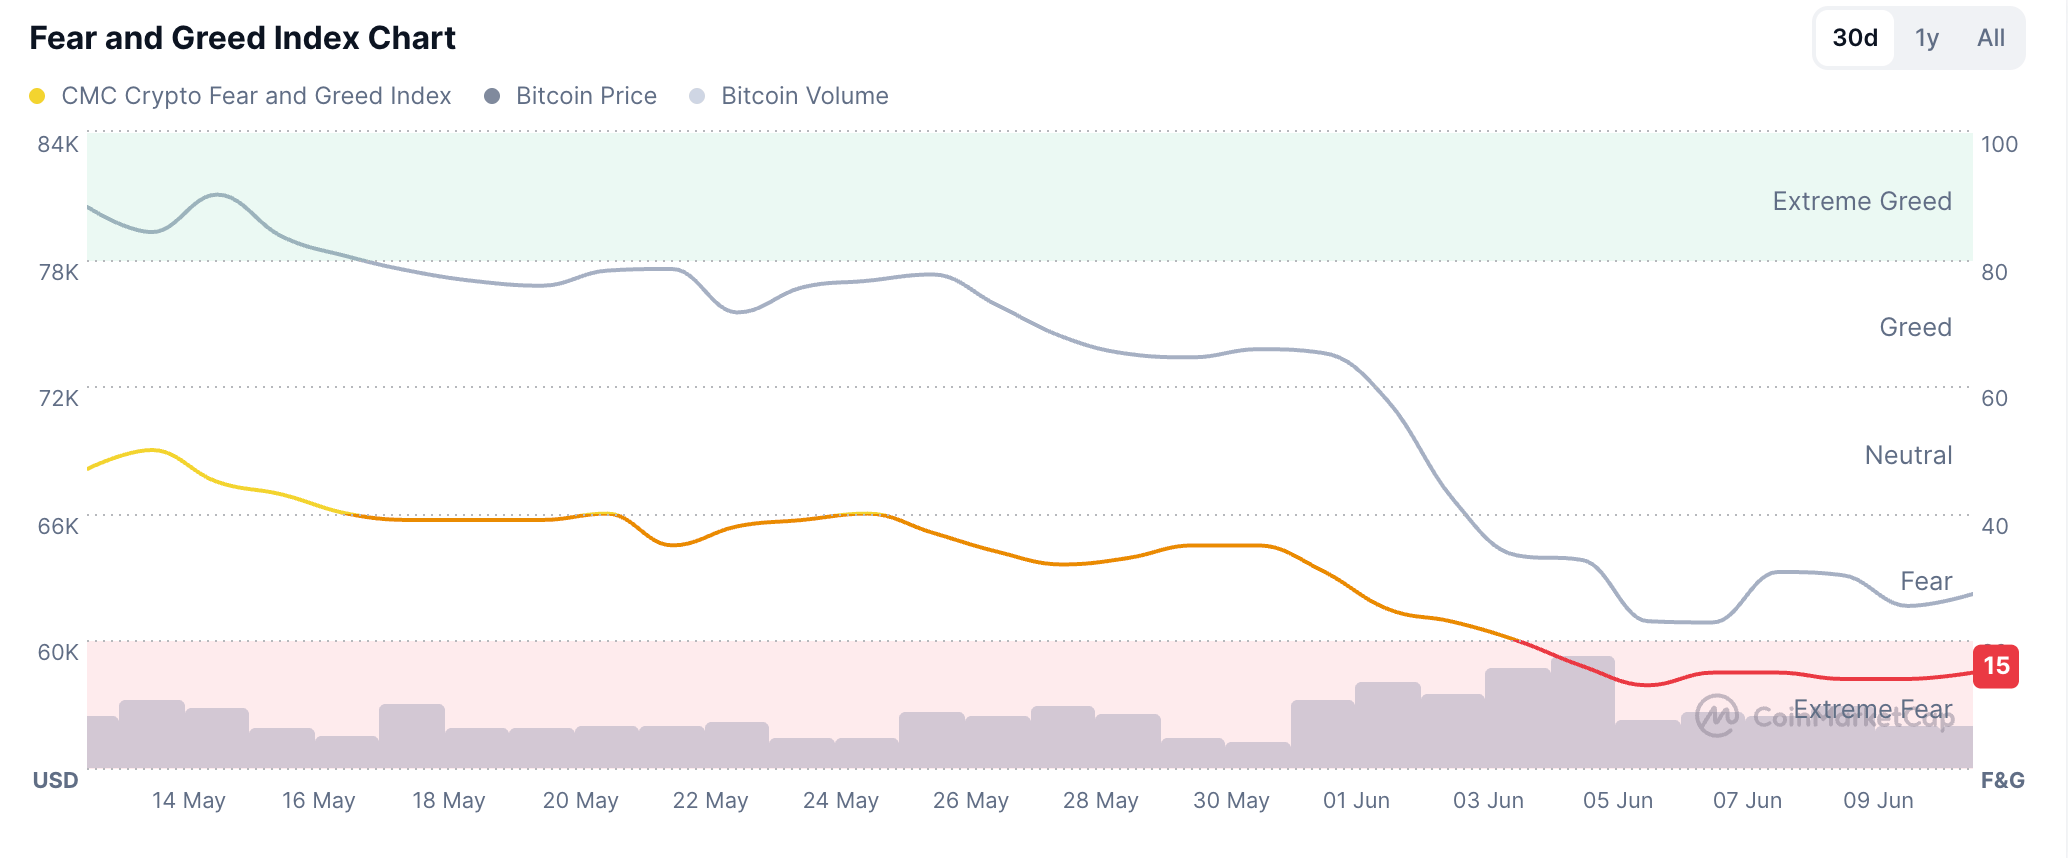
- Market sentiment remains heavy with Fear, and the Greed and Fear Index at 15 flashes extreme fear among investors.
- Curve DAO, World Liberty Financial, and Monero emerge as top performers over the last 24 hours.
The broader cryptocurrency market maintains risk-off sentiment as Bitcoin lingers above $62,000 at press time on Thursday. The mild recovery in BTC fails to lift the Fear and Greed Index, which at 15 continues to signal extreme fear among investors. Still, certain altcoins, Curve DAO (CRV), World Liberty Financial (WLFI), and Monero (XMR), have emerged as top performers over the last 24 hours.
Market sentiment remains grounded with Bitcoin below $65,000
CoinMarketCap’s Crypto Fear and Greed Index – which measures the prevailing sentiment in the crypto market – is at 15 on Thursday, remaining below 20 so far this week, reflecting extreme fear among investors following Bitcoin’s brief slip below $60,000 on Friday.
Bitcoin trades around $62,200 at press time on Thursday, maintaining a mild bearish near-term tone as price consolidates above the $60,000 psychological threshold following last week’s 14% decline. The 50-, 100-, and 200-day Exponential Moving Averages (EMAs) act as layered resistance well above price. From a technical perspective, the prior rising trendline, broken near $72,263.53, reinforces this overhead supply zone.
That said, momentum remains weak with the Relative Strength Index (RSI) at 27 staying in oversold territory and the Moving Average Convergence Divergence (MACD) and signal line remain in the negative zone, hinting that bearish pressure persists despite the stretched conditions.
Looking down, the $60,000 level remains the key notable support; a sustained break would expose deeper losses, while holding above this floor could allow an oversold bounce toward the cited resistance band.

On the topside, initial resistance is seen around the $65,000 round figure, then the 50-day EMA near $71,650, and finally the broken uptrend line near $72,264.
Top Gainers: Curve DAO, World Liberty Financial, and Monero extend gains
Curve DAO is up 8% at the time of writing on Thursday, marking its sixth consecutive day of recovery. The broader bias remains capped, with price holding below the 100- and 200-day EMAs at $0.2421 and $0.3045, respectively, despite attempts to stabilize above the shorter-term 50-day EMA at $0.2227.
The RSI near 57 indicates a steady increase in buying pressure, while a positive MACD crossover above its signal line hints at a recovering bullish momentum.
On the topside, immediate resistance is located at the 50% Fibonacci retracement at $0.2316, measured over the downswing from $0.2931 to $0.1700, followed by the 100-day EMA at $0.2421.
On the downside, initial support is seen at the 50-day EMA at $0.2227, followed by the 38.2% Fibonacci level at $0.1990, acting as a key medium-term floor if selling pressure resumes.
World Liberty Financial maintains a neutral-to-slightly constructive tone as it consolidates above the 50- and 100-period EMAs at $0.0575 and $0.0586, respectively. This positioning suggests dip-buying interest is emerging.
That said, mildly bullish momentum supports the recovery attempt, as the MACD and signal line rise above the zero line, while the RSI at 61 holds above the midline.
Initial resistance is aligned with the descending trend-line break area near $0.0605, with a more significant cap at the 200-period EMA around $0.0618, which WLFI must reclaim to unlock a stronger bullish phase.
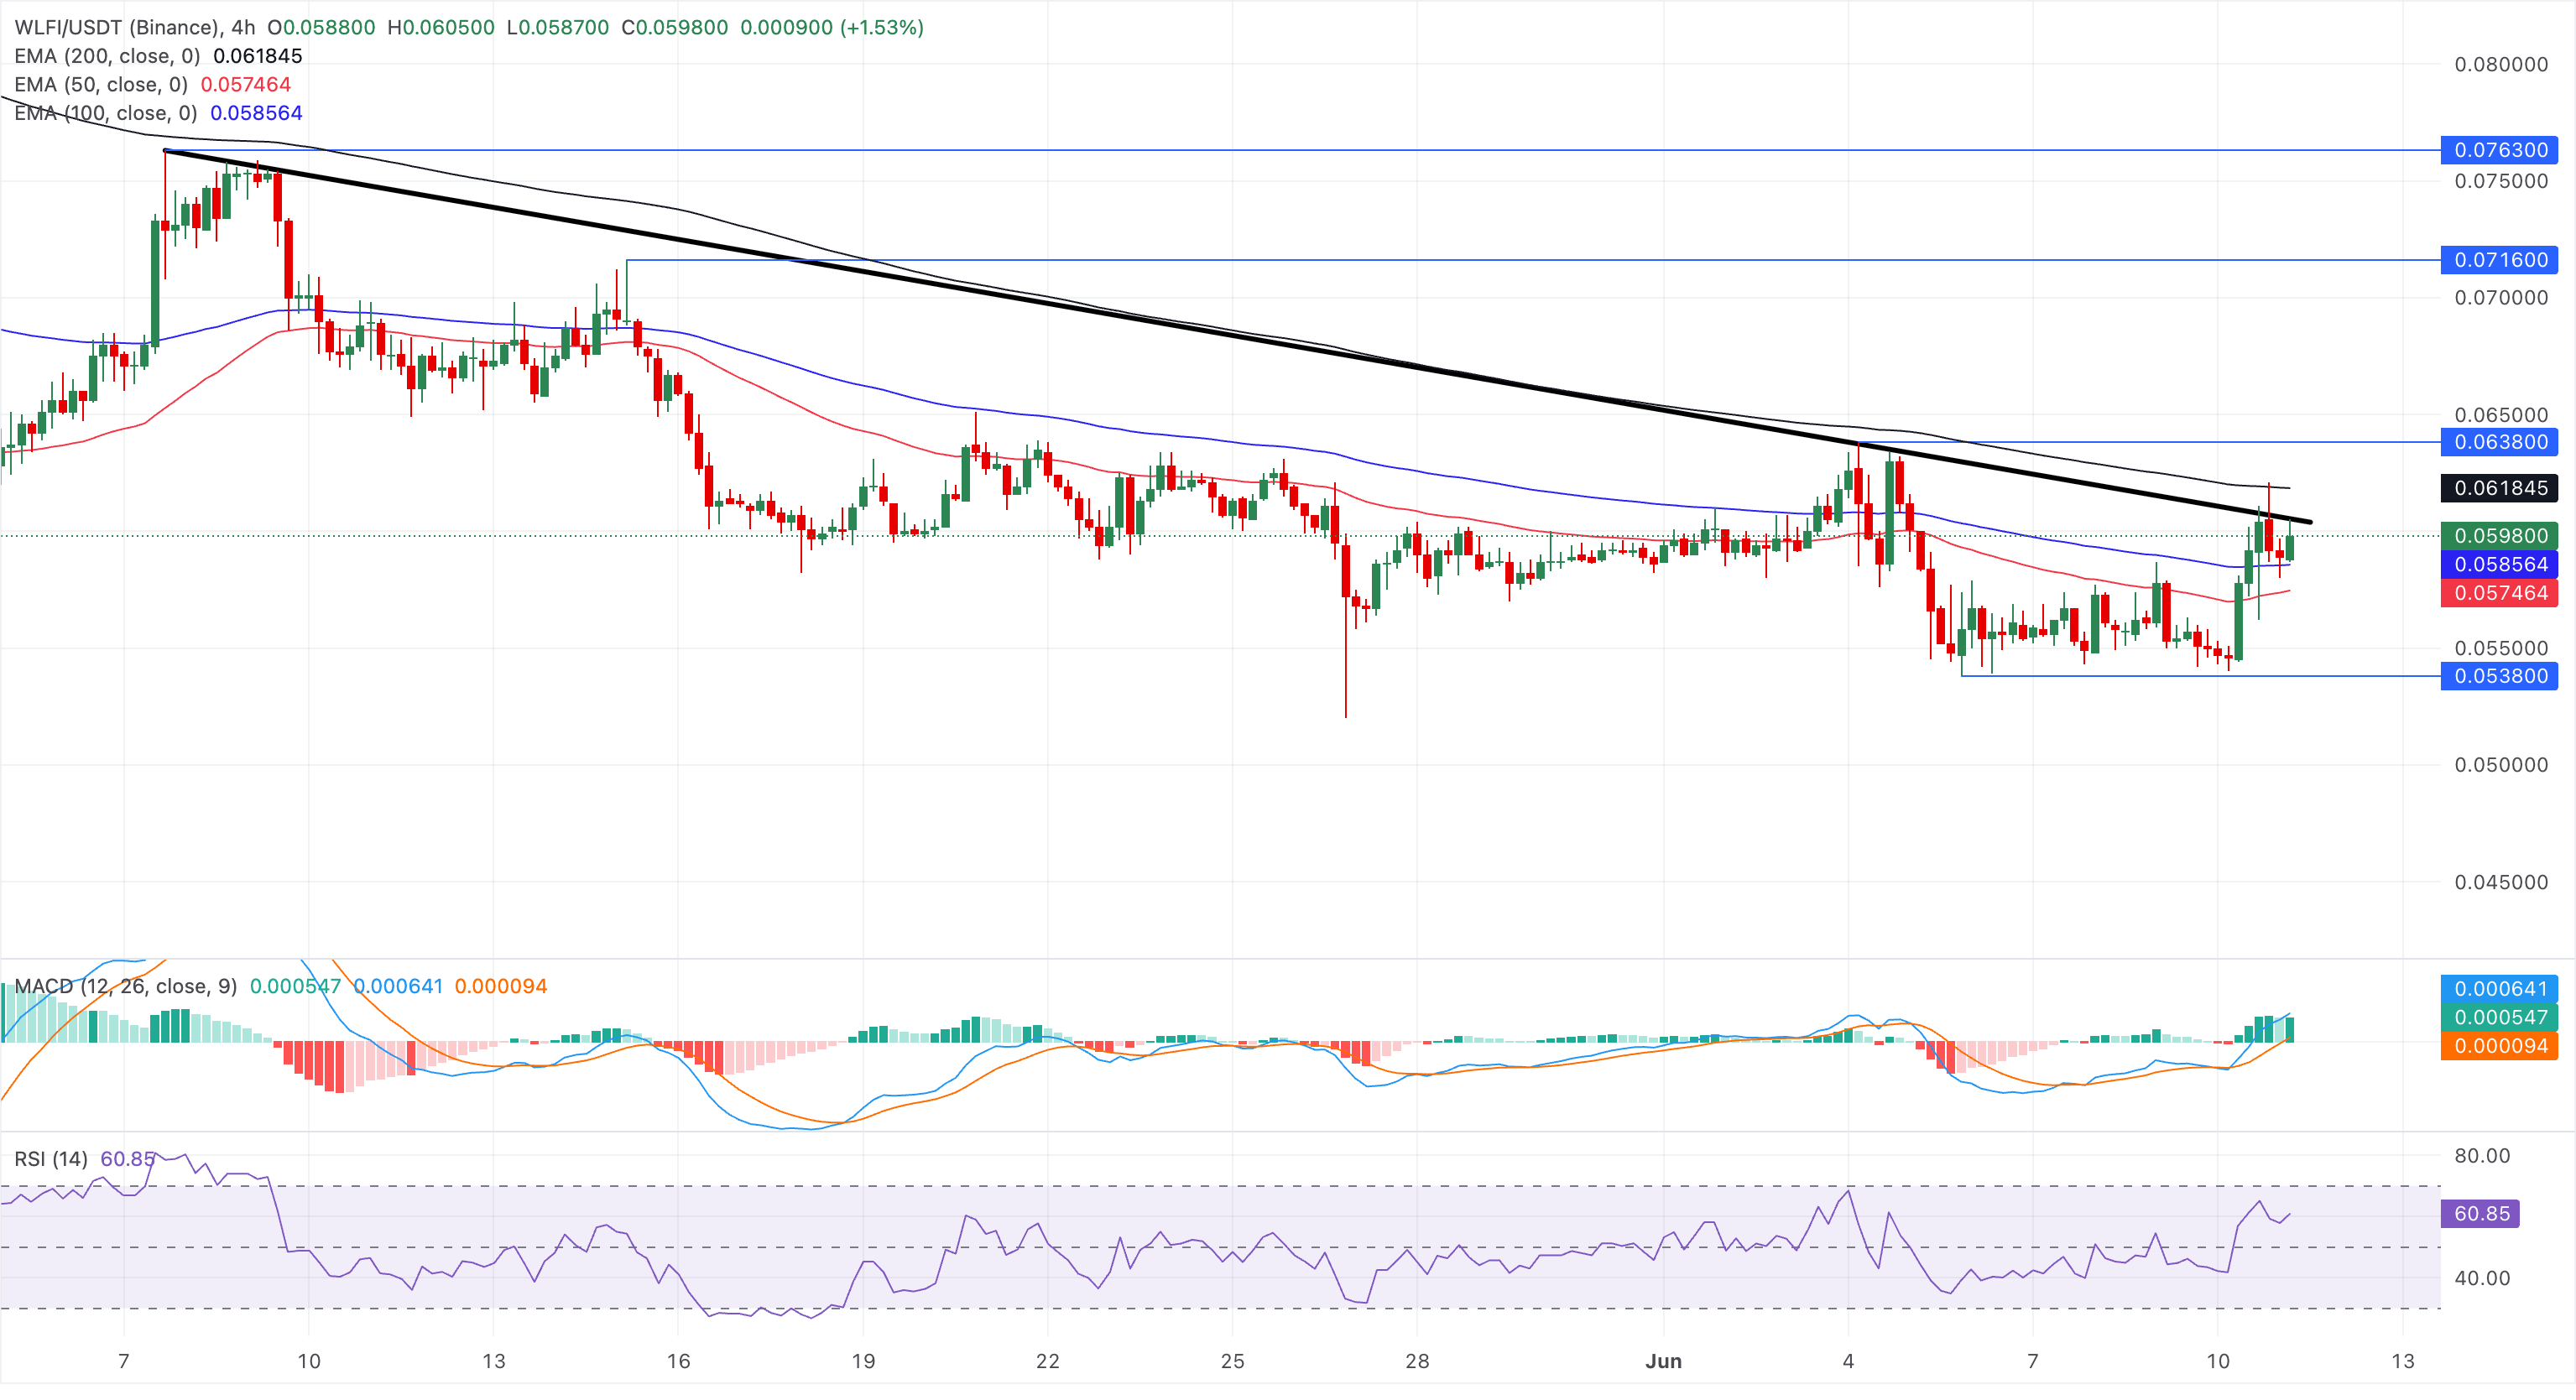
Immediate support is seen at the 100-period EMA at $0.0586, followed by the 50-period EMA near $0.0575, where a break lower would undermine the nascent positive bias and expose deeper retracements.
Monero trades around $340 at press time on Thursday, following a 7% jump the previous day. XMR maintains a mildly bearish near‑term tone as it remains below the 50‑day EMA at $361, along with the 100‑day EMA at $367 and the 200‑day EMA at $367, forming a dense overhead cap.
Momentum readings align with this capped structure, as the RSI hovers around a neutral‑to‑soft 47 while the MACD remains in negative territory, though its latest uptick suggests downside pressure may be easing rather than reversing.
On the topside, initial resistance is located at the 23.6% Fibonacci retracement of the broader downswing at $355, followed by the 50‑day EMA near $361.
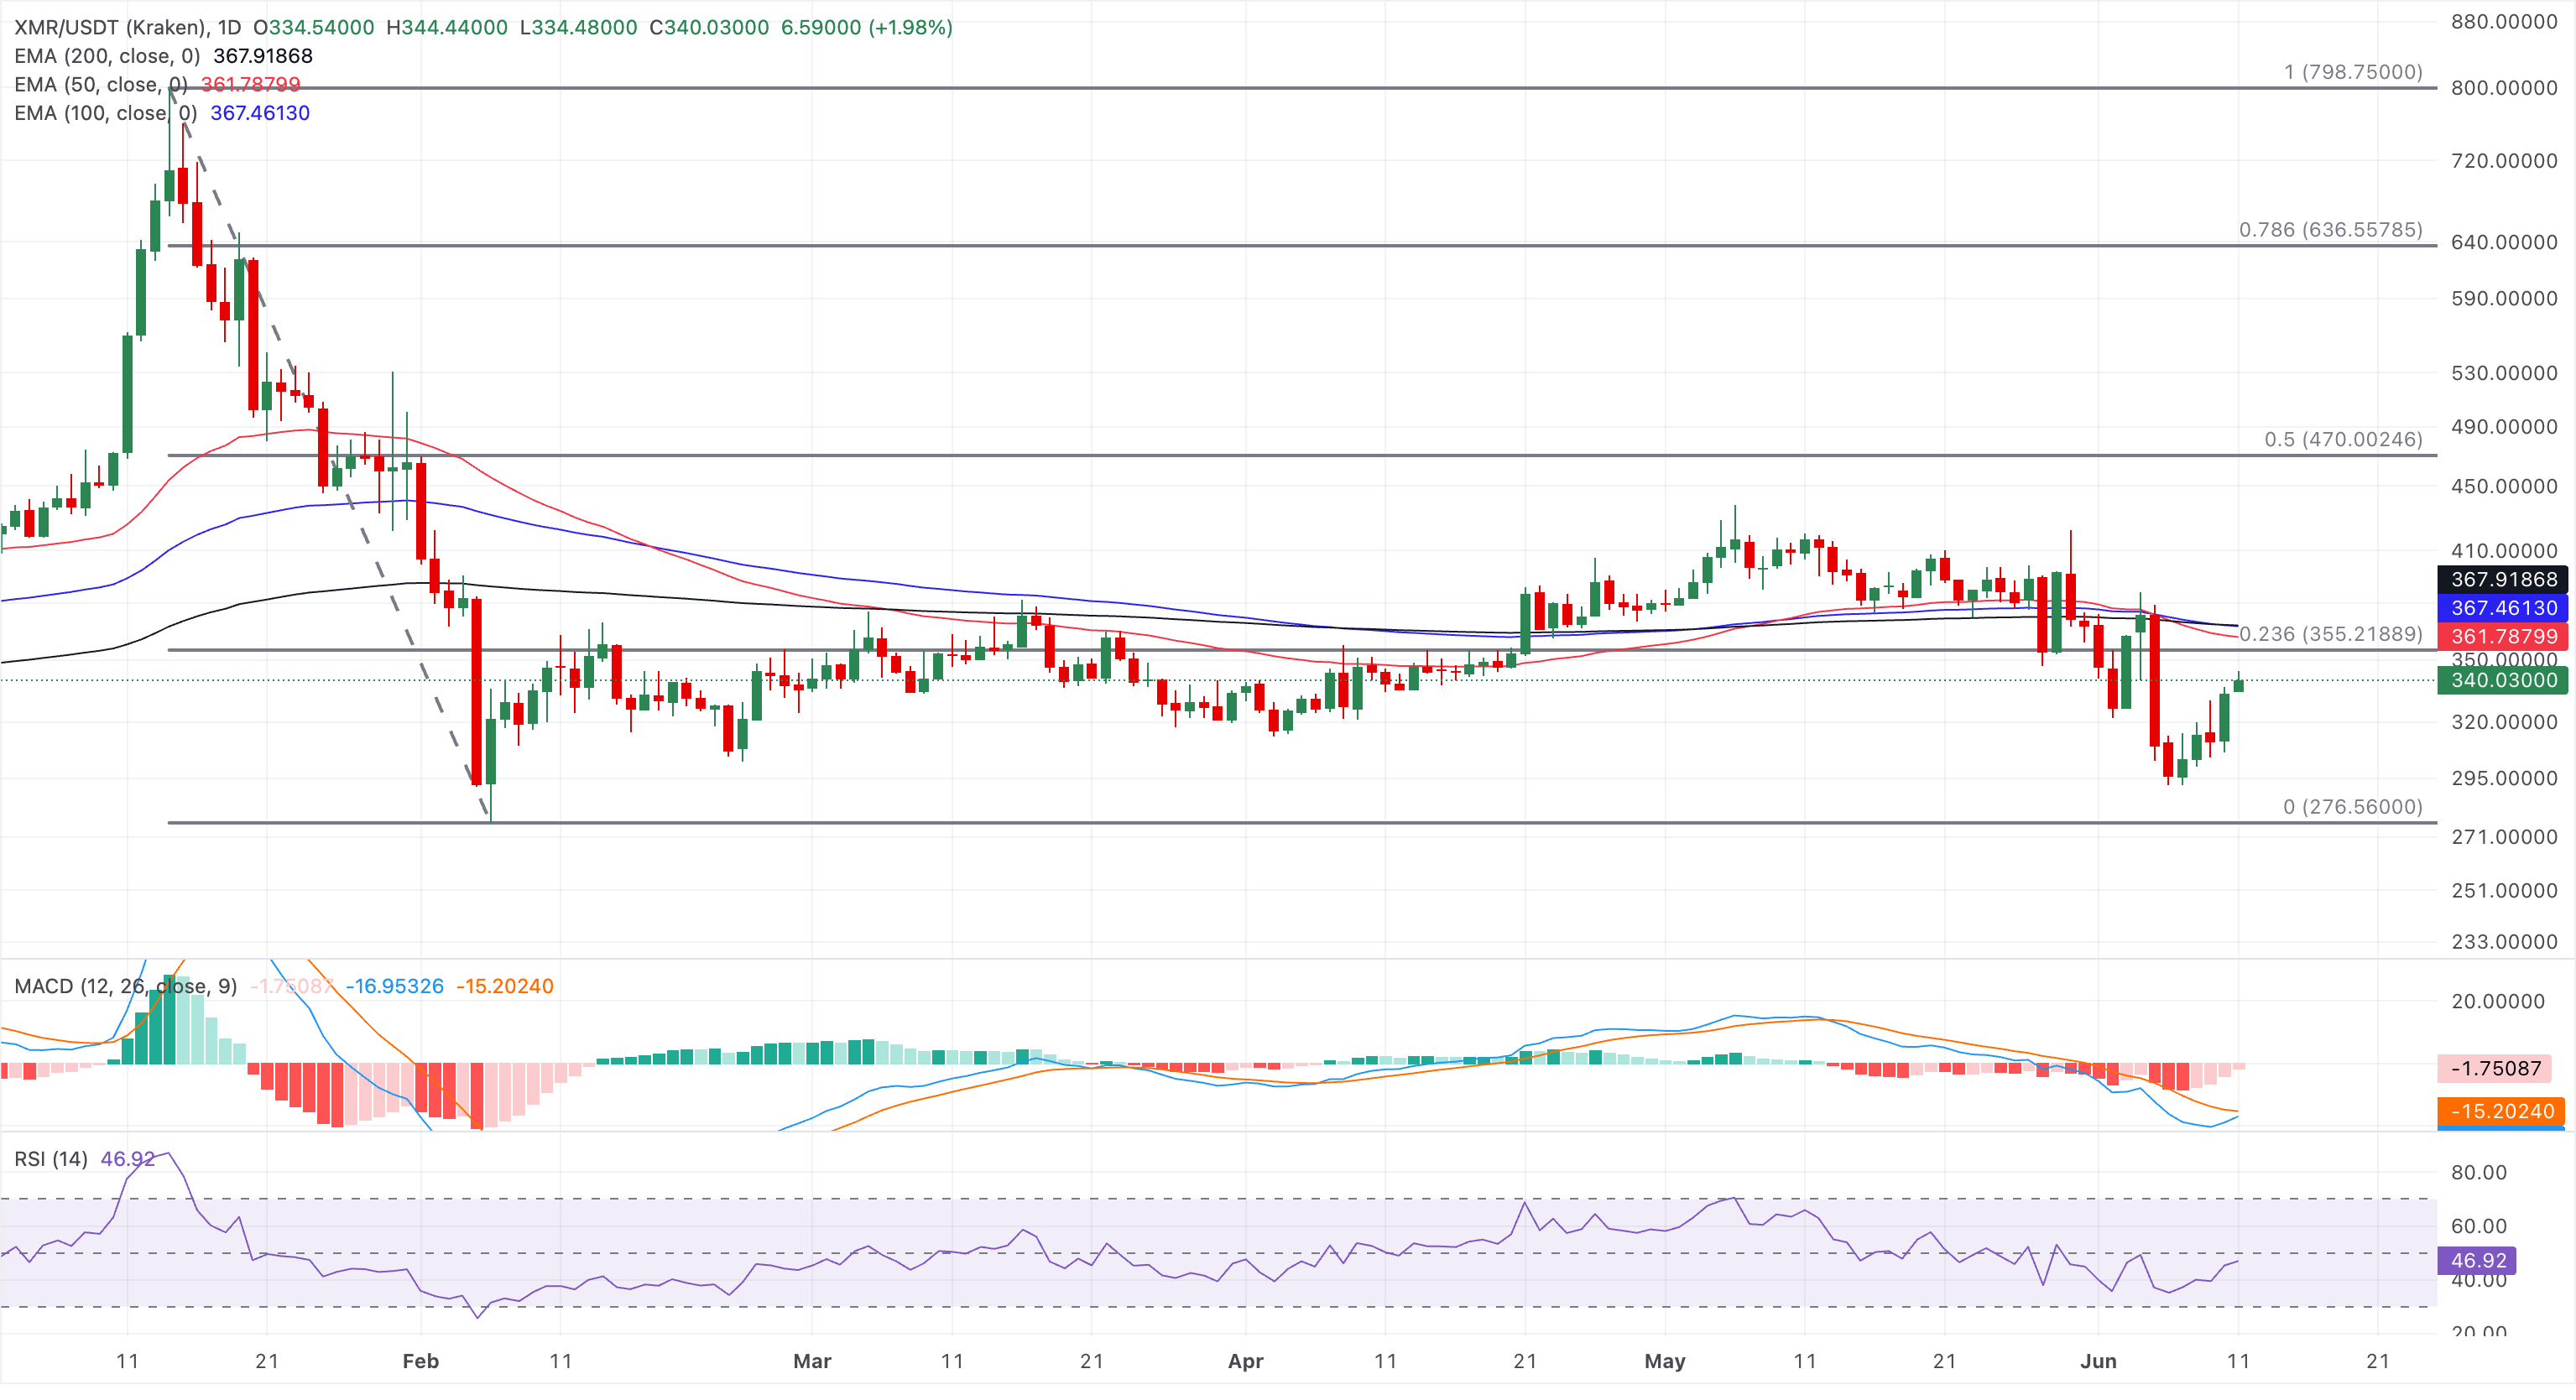
On the flip side, structural support is much lower at the prior swing low around $276.56, with the absence of closer Fibonacci or moving‑average floors suggesting that any renewed selling could see price gravitate back toward that base if the current rebound from recent lows stalls under the EMA cluster.