S&P 500 — US Large Cap Index
 FTSE 100 — UK Blue Chips
 Euro Stoxx 50 — Eurozone Leaders
 DAX 40 — German Equities
 CAC 40 — French Market Index
 Nikkei 225 — Japan Benchmark
 Hang Seng — Hong Kong Index
 Shanghai Composite — China Mainland
 ASX 200 — Australian Market
 TSX Composite — Canada Index
 Nifty 50 — India Large Cap
 STI Index — Singapore Market
 KOSPI — South Korea Index
 Bovespa — Brazil Equities
 JSE Top 40 — South Africa Index
 IPC Index — Mexico Market
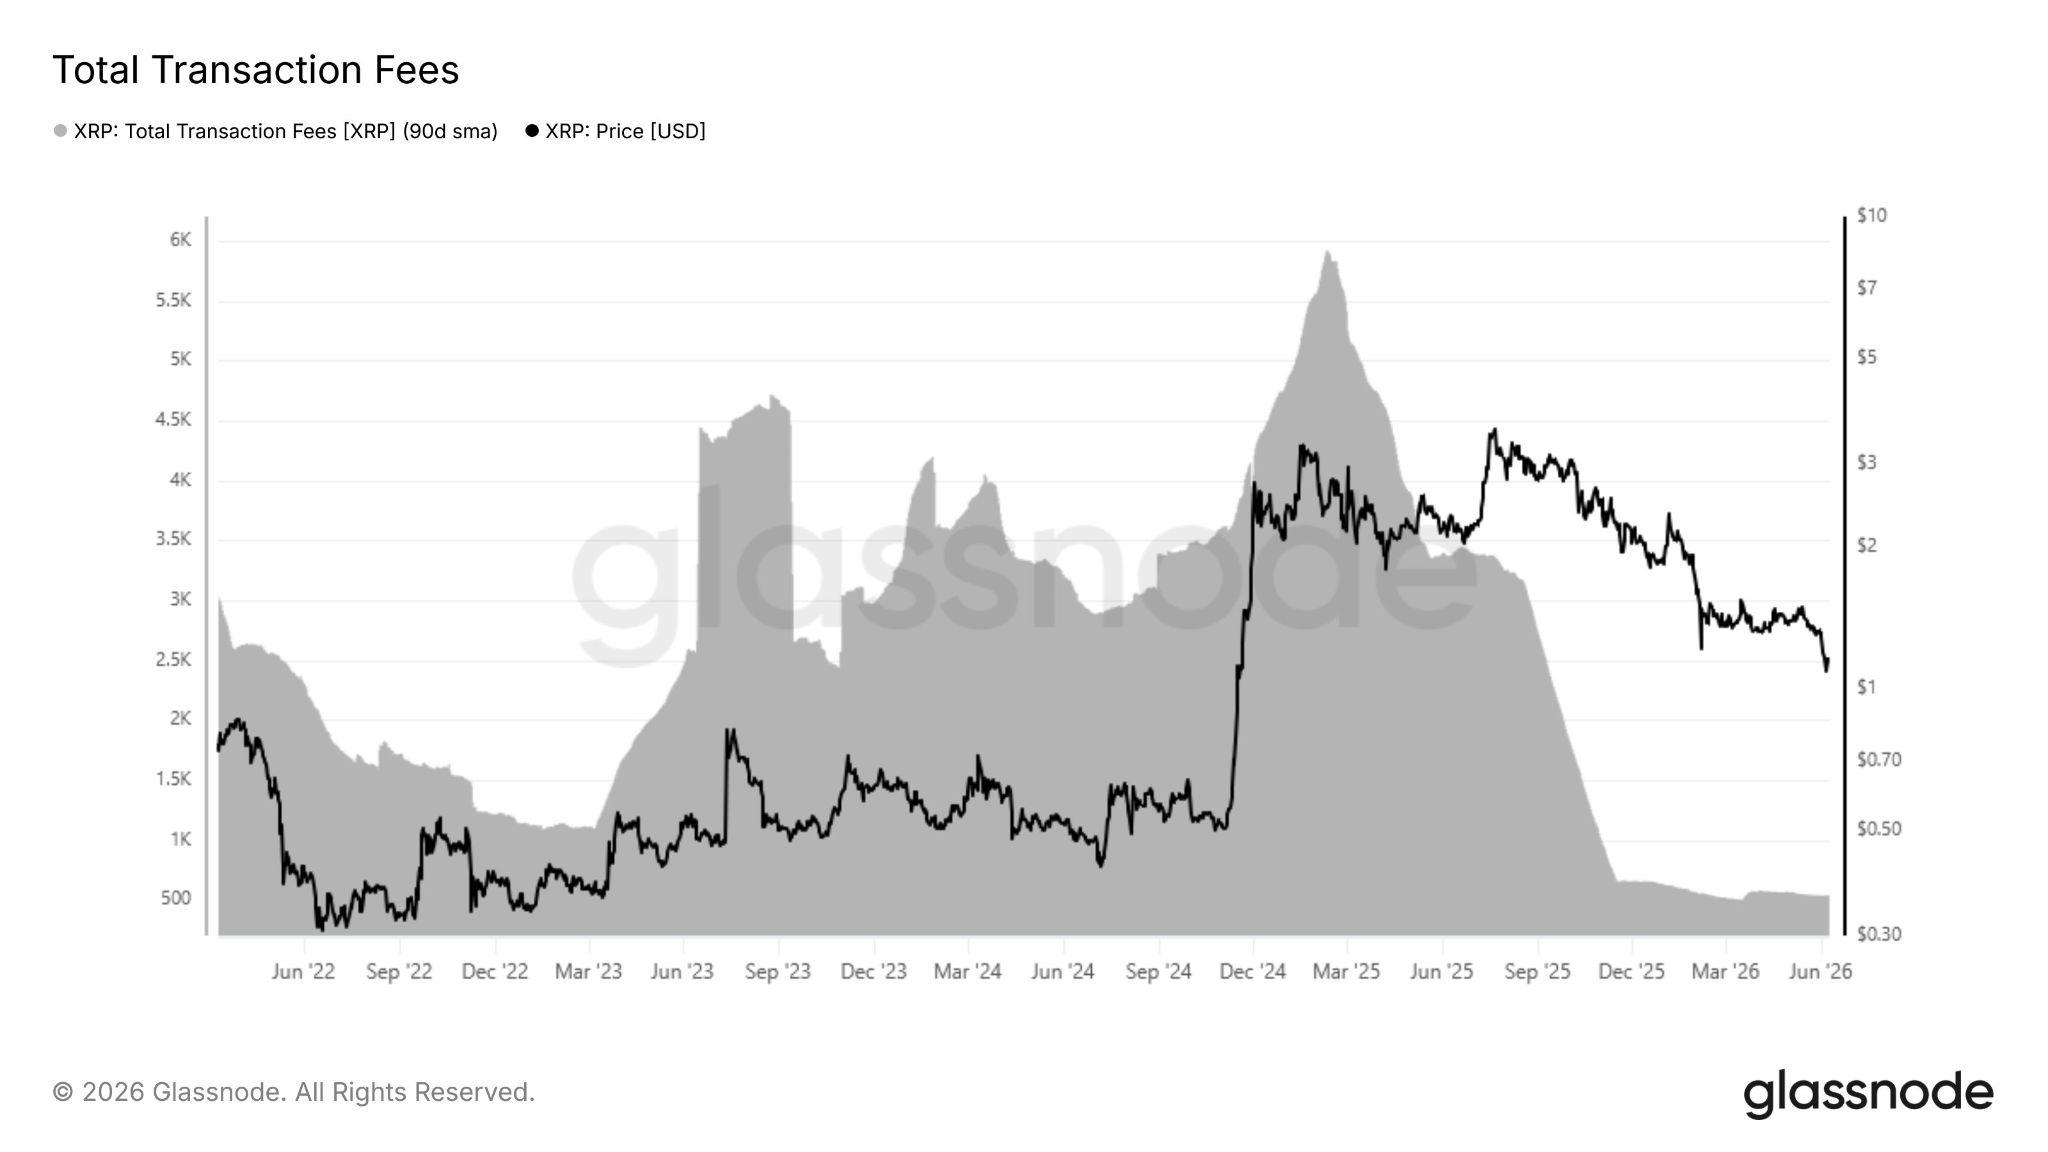
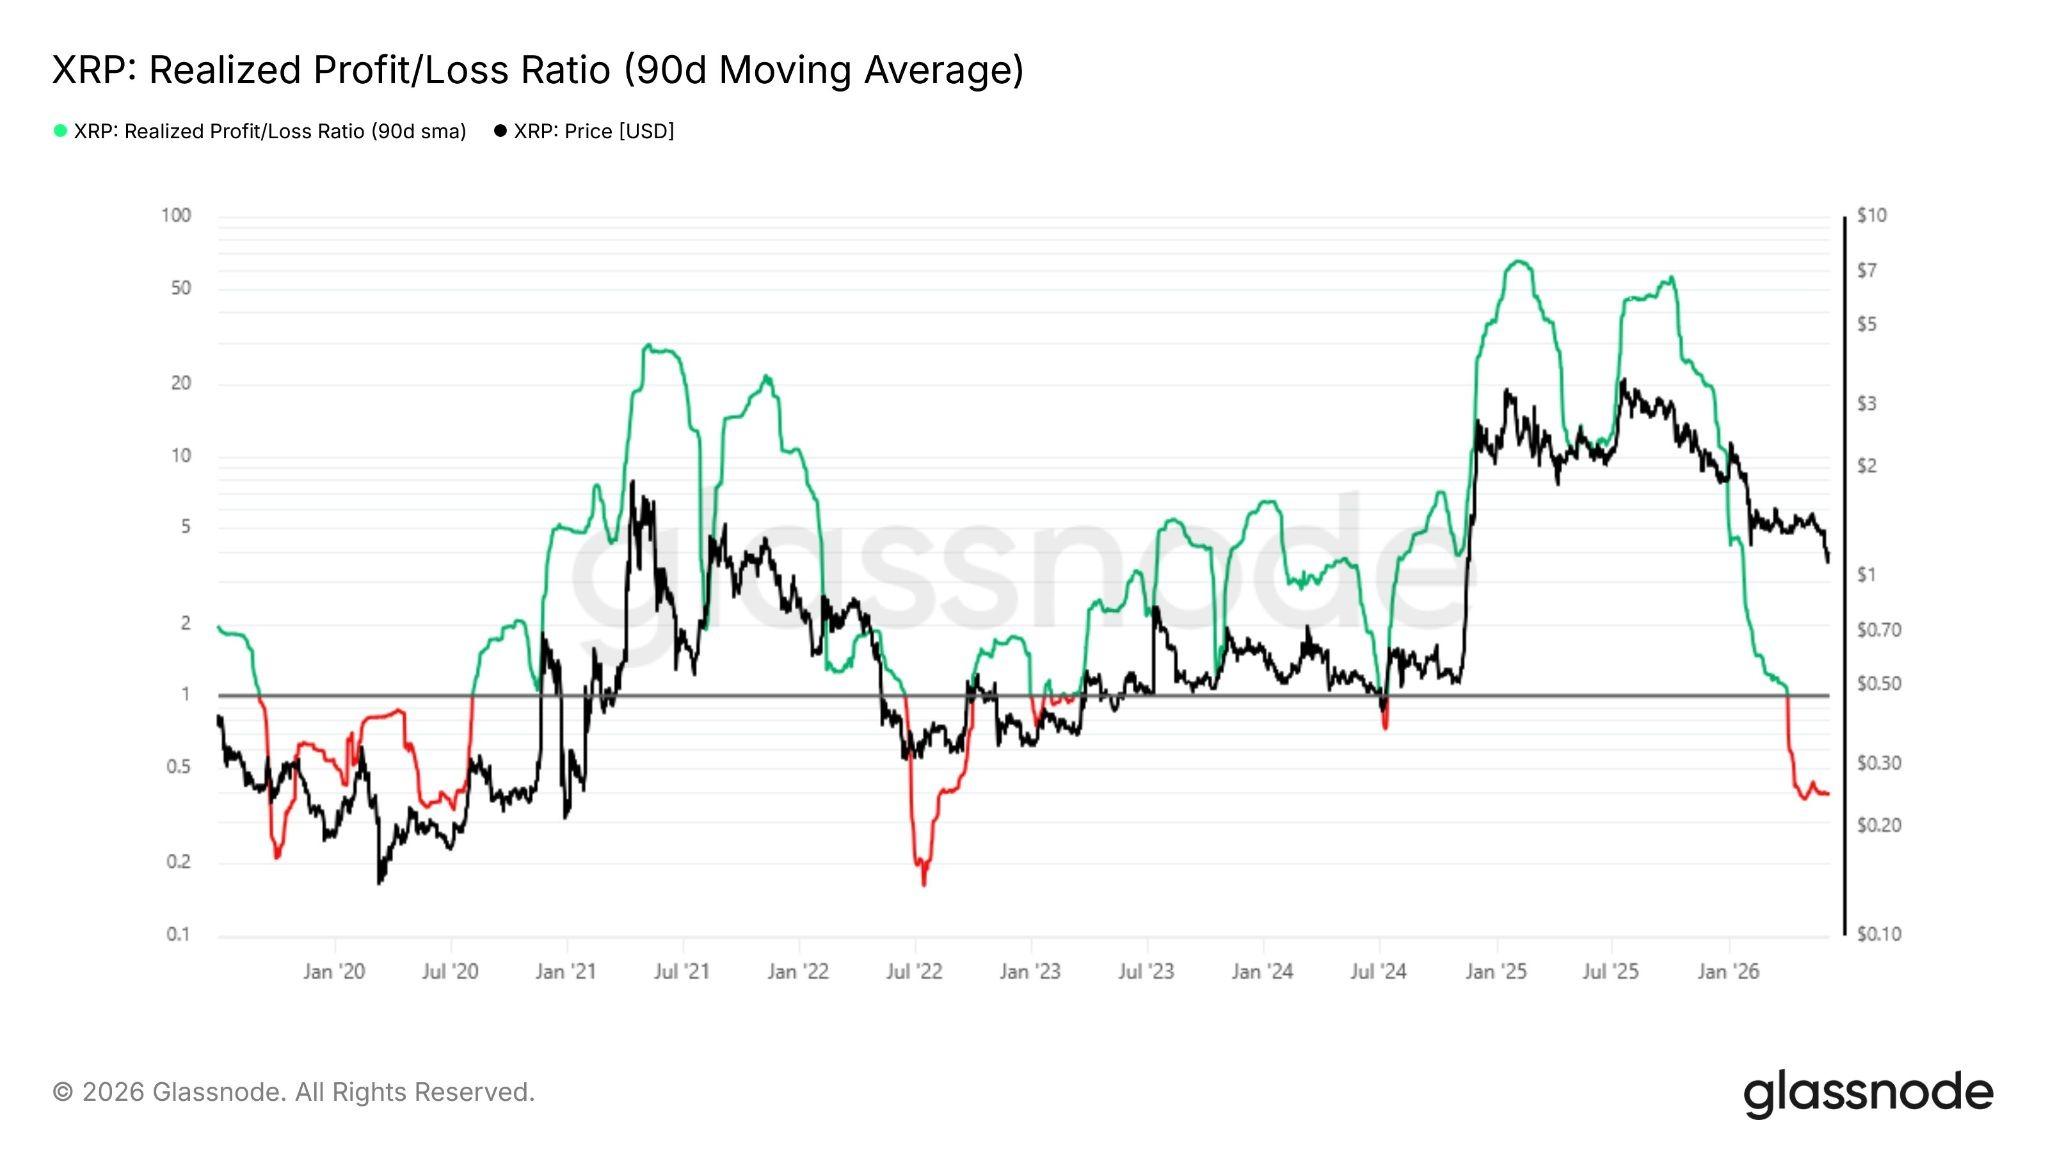
XRP’s (XRP) onchain activity has contracted sharply since its 2025 peak. The 90-day network fee average fell by 91.5%, while the realized profit-to-loss ratio dropped to 0.38 from 50, according to Glassnode.
The decline in activity and profitability comes as traders identify the $1.00-$0.65 region as a major area of interest.
XRP profit-taking flips to network capitulation
According to Glassnode, the 90-day simple moving average of total fees paid on the XRP network has fallen to just 500 XRP from 5,900 XRP in February, a decline of 91.5%.
The network fees are often used as a proxy for transaction demand. The drop points to a sharp slowdown in activity following the speculative surge that carried XRP above $3 in the first half of 2025.
XRP investor behavior has also shifted. Glassnode reported that XRP’s 90-day realized profit-to-loss ratio has fallen to 0.38, meaning market participants are realizing $1 in losses for every $0.38 in profits.
In January and July 2025, when the XRP price peaked near $3.40, the ratio reached 50 as profit-taking dominated the onchain flows. That balance has now reversed. This indicates that a larger share of onchain coins are being sold below their acquisition cost, a pattern commonly seen during capitulation phases.
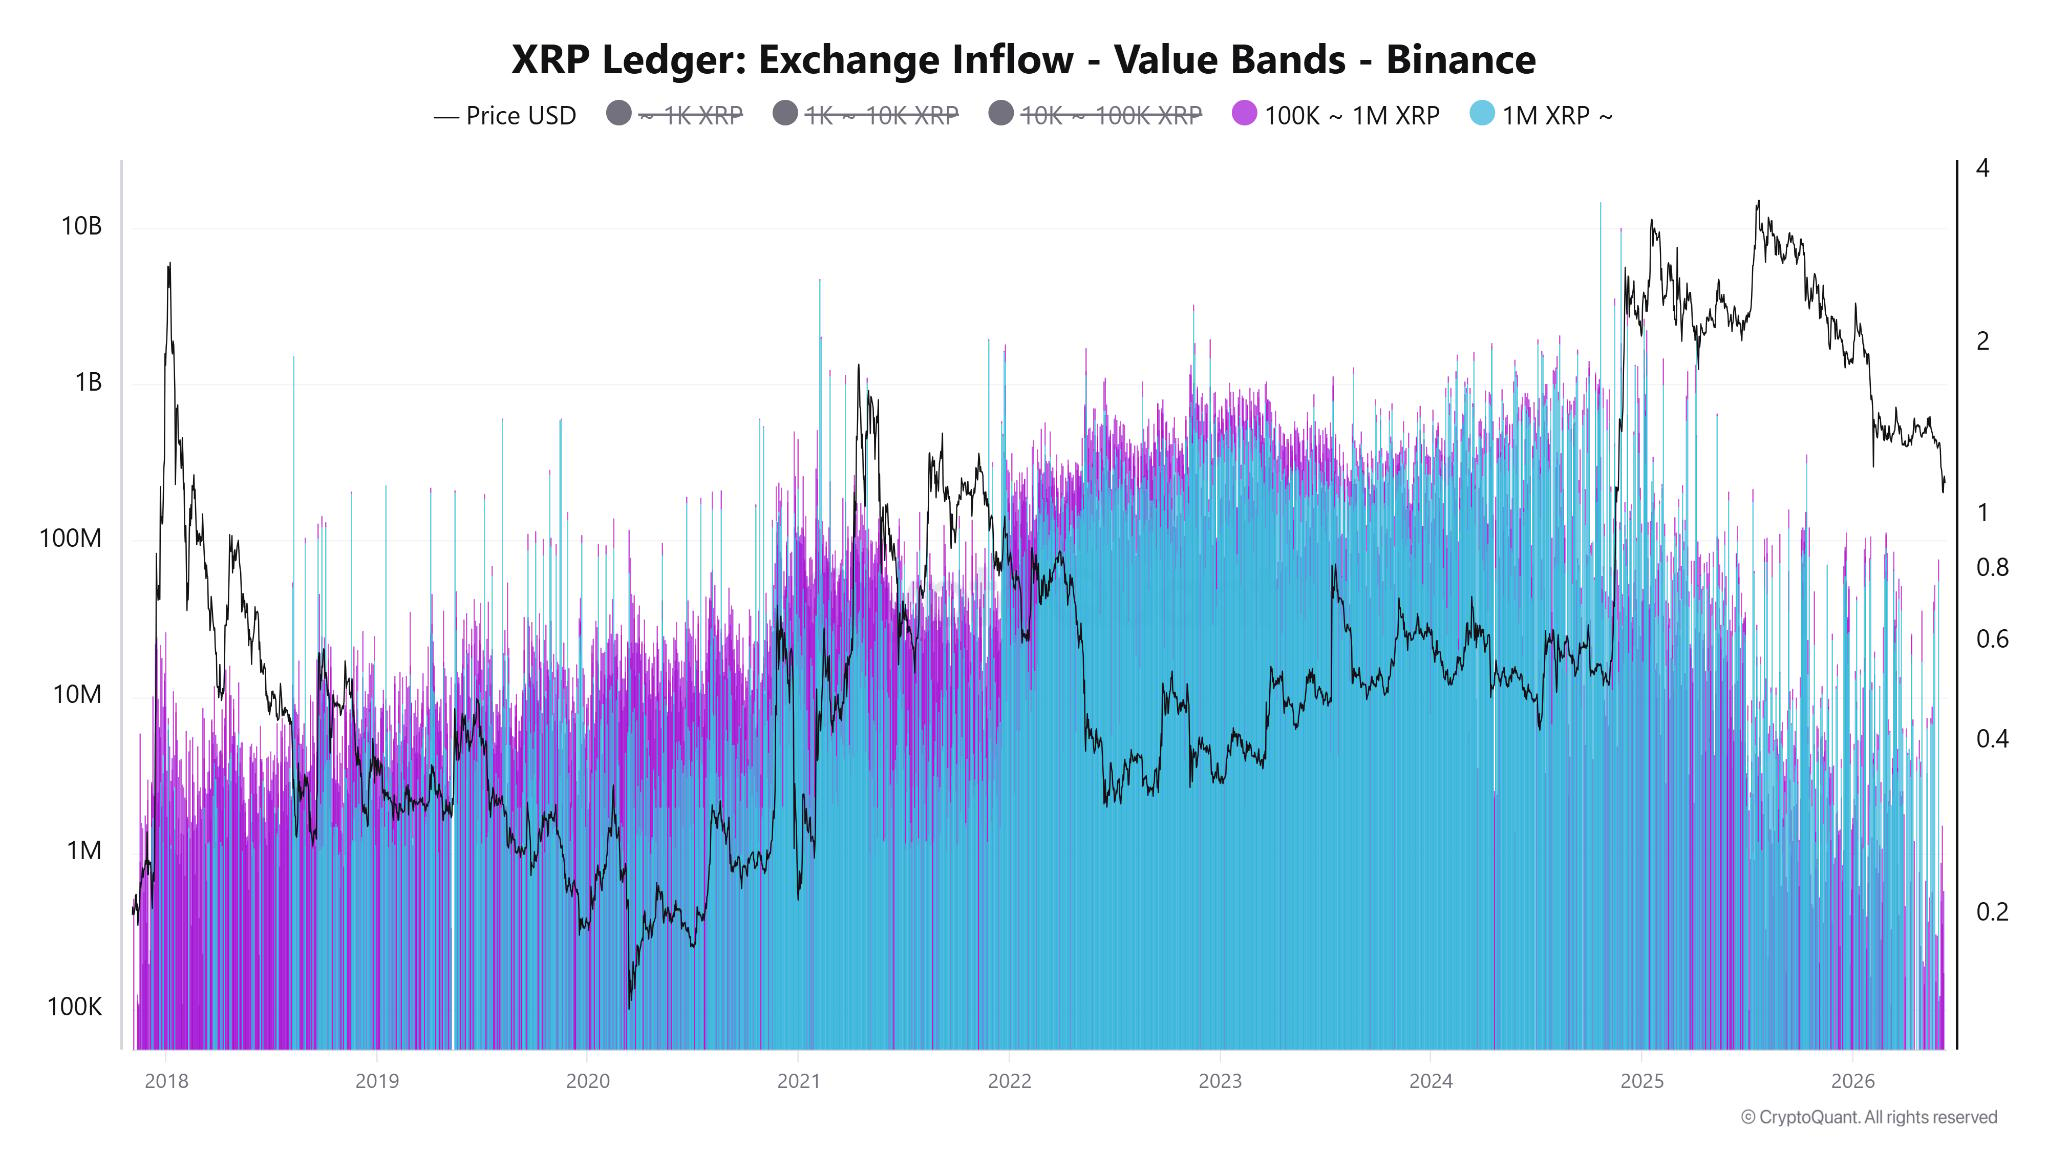
Exchange data offers a different view of holder activity. Crypto analyst Pelin Ay noted that transfers of more than 1 million XRP to Binance have declined since XRP’s 2025 peak.
Historically, major corrections were preceded by sharp increases in both the 100,000–1 million XRP and 1 million-plus XRP inflow cohorts as large holders moved tokens to exchanges.
The current data shows a sustained decline in exchange-bound XRP from large holders, with inflows from the 100,000–1 million XRP and 1 million-plus XRP cohorts decreasing by 15% and 20%, respectively, since October 2025.
The analyst said the latest price weakness appears more closely tied to leverage-driven liquidations and risk-off sentiment than aggressive distribution by large holders.
$0.63 is the key area for accumulation
XRP’s weekly chart highlights a cluster of technical levels between $1.00 and $0.65.
A large fair value gap spans roughly $0.63 to $1.00, created during XRP’s rapid rally in late 2024. The price has already started moving back toward that zone after losing support near $1.40.
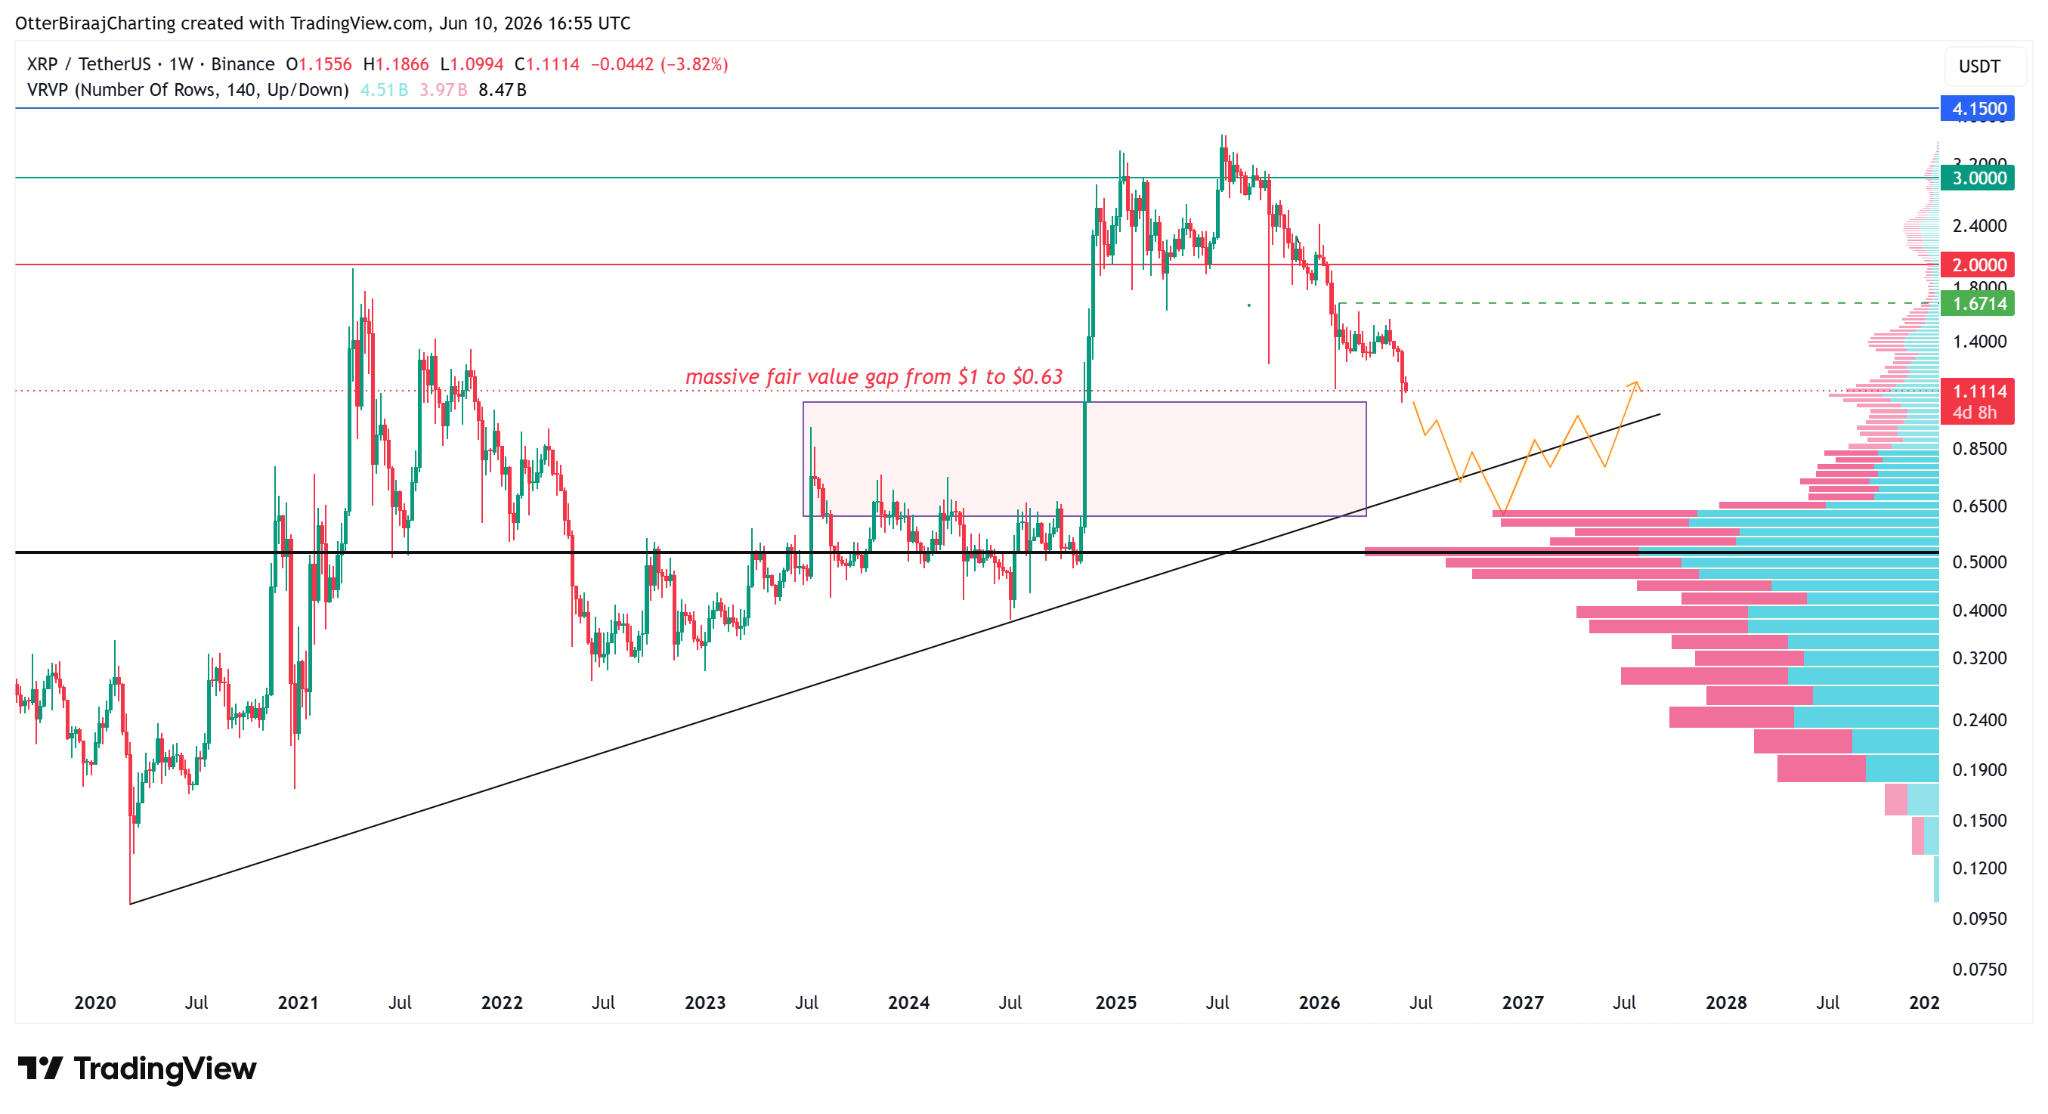
The visible-range volume profile data shows relatively light trading activity below current levels until a high-volume node around $0.50–$0.65. The point of control, which marks the price area with the highest traded volume, sits near $0.52–$0.55.
The same region aligns with XRP’s five-year ascending trendline, projected to intersect near $0.60–$0.65 in the coming months.
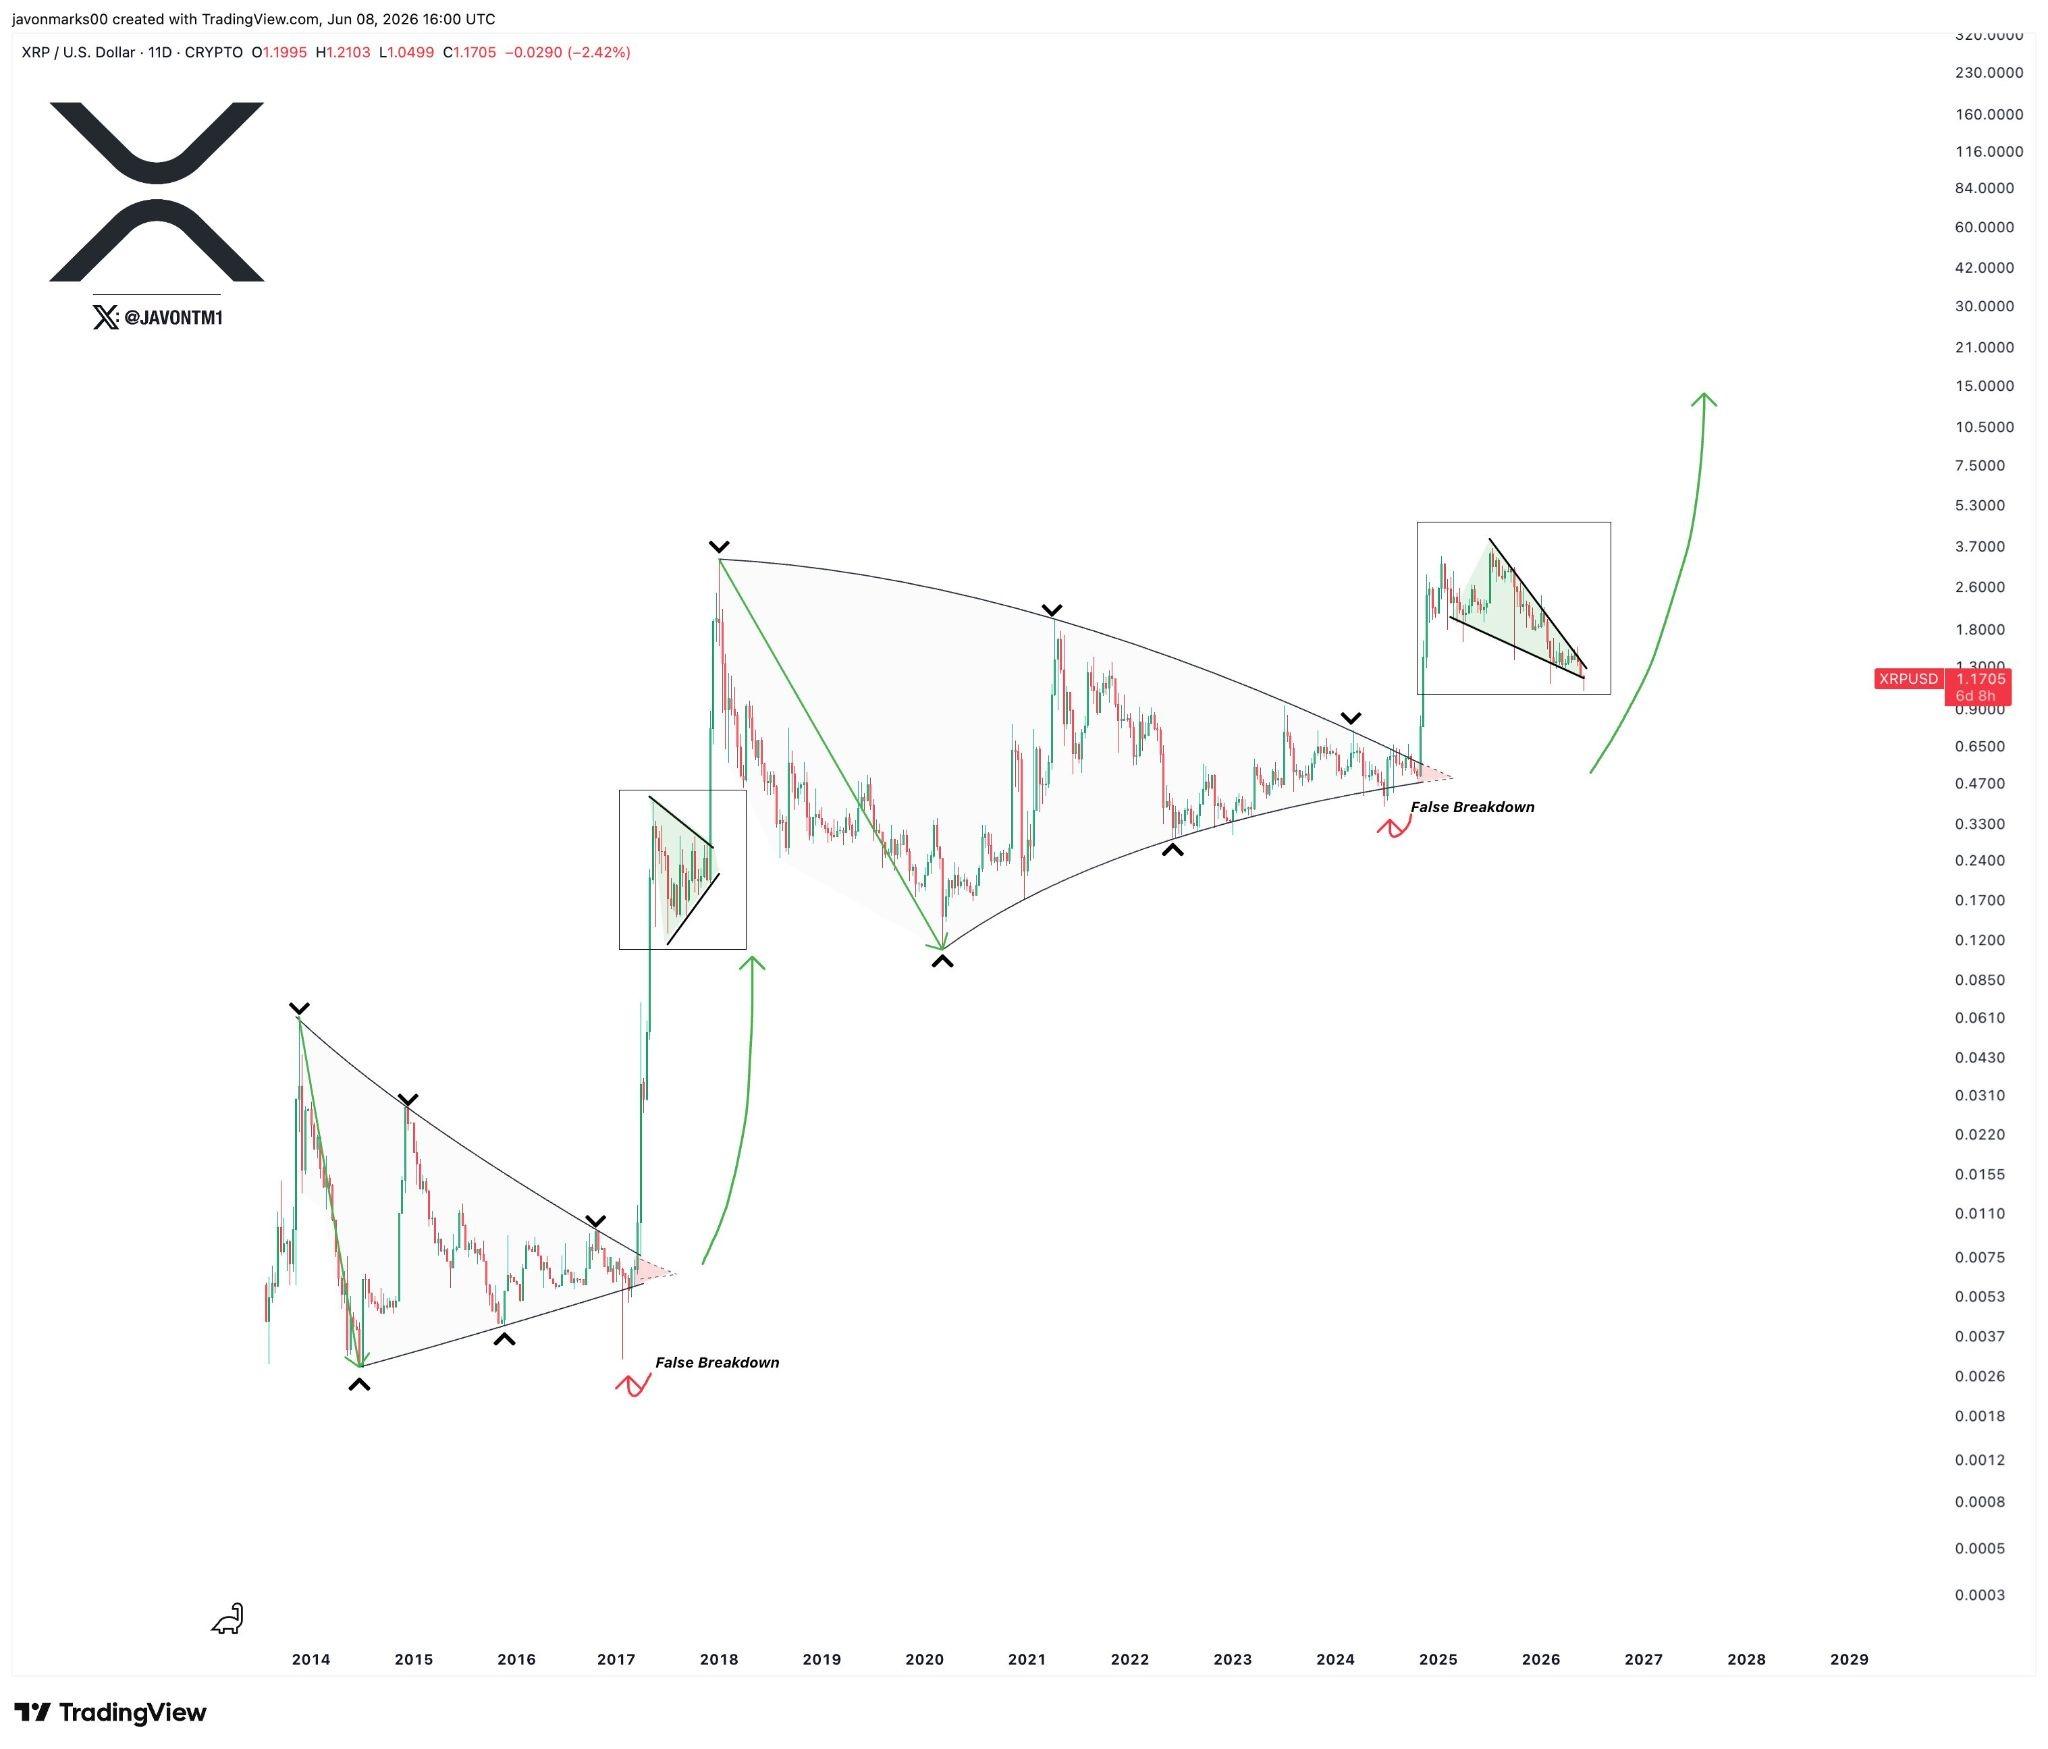
Some traders are already treating the zone as an accumulation range. Trader Crypto Patel identified $1.00 to $0.60 as a preferred buying range, while market analyst Javon Marks maintained his long-term breakout target of $15–$18, representing a 1,100% increase.