S&P 500 — US Large Cap Index
 FTSE 100 — UK Blue Chips
 Euro Stoxx 50 — Eurozone Leaders
 DAX 40 — German Equities
 CAC 40 — French Market Index
 Nikkei 225 — Japan Benchmark
 Hang Seng — Hong Kong Index
 Shanghai Composite — China Mainland
 ASX 200 — Australian Market
 TSX Composite — Canada Index
 Nifty 50 — India Large Cap
 STI Index — Singapore Market
 KOSPI — South Korea Index
 Bovespa — Brazil Equities
 JSE Top 40 — South Africa Index
 IPC Index — Mexico Market
Bitcoin, Ethereum, Ripple: BTC eyes $105K breakout, ETH holds key support, XRP targets $3

- Bitcoin price inches closer to the critical $105,000 resistance; a daily close above could open the path toward its all-time high.
- Ethereum finds solid footing near the 200-day EMA at $2,436, highlighting sustained bullish momentum.
- XRP approaches resistance at $2.72; a breakout could trigger a rally toward $3.00 .
Bitcoin (BTC), Ethereum (ETH), and Ripple (XRP) continue to show strength as the broader crypto market sustains its bullish momentum. BTC is testing a critical resistance level that could mark a fresh push toward record highs, while ETH remains supported by a key level, signaling potential for upward continuation. Meanwhile, XRP flirts with a major resistance zone, and a breakout here could spark renewed interest and gains.
Bitcoin’s key resistance at $105,000 may decide the next move
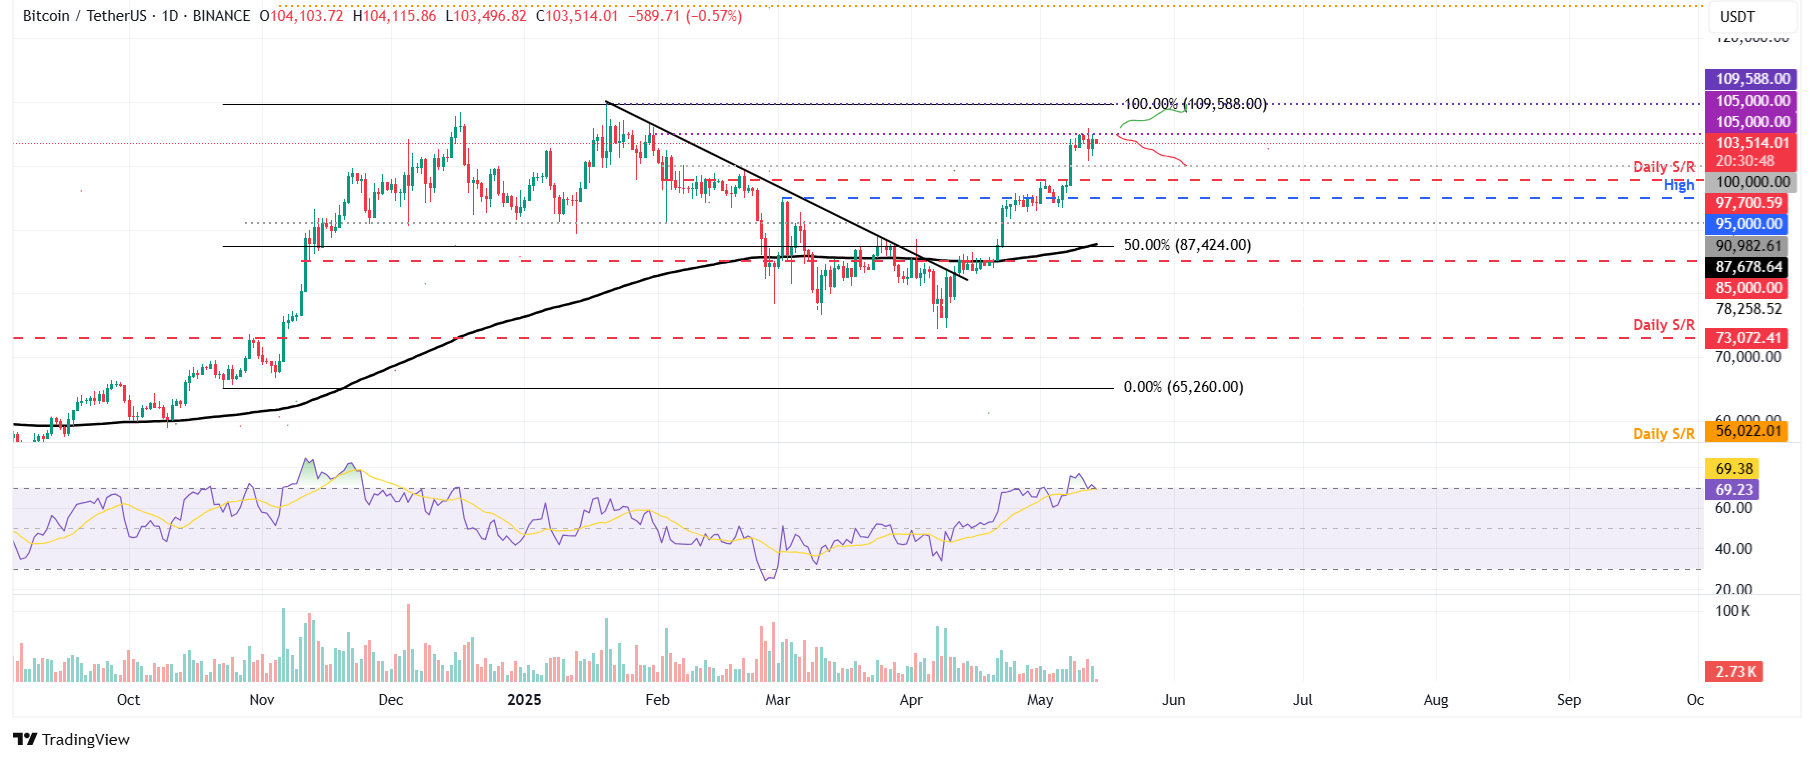
Bitcoin faced resistance at around $105,000 on Sunday, declining by 2% until the next day. However, BTC recovers slightly on Tuesday and retests the $105,000 level. At the time of writing on Wednesday, it trades down to around $103,600.
If BTC continues its pullback, it could extend the decline to retest the psychological support level at $100,000.
The Relative Strength Index (RSI) on the daily chart reads 69, slipping below its overbought level of 70 and pointing downwards, indicating a weakening bullish momentum. If the RSI continues to decline and moves below the neutral level of 50, it would lead to a sharp fall in Bitcoin prices.
BTC/USDT daily chart
However, if BTC recovers and closes above the $105,000 resistance level, it could open the door for a rally toward the all-time high of $109,588 set on January 20.
Ethereum finds support around its 200-day EMA
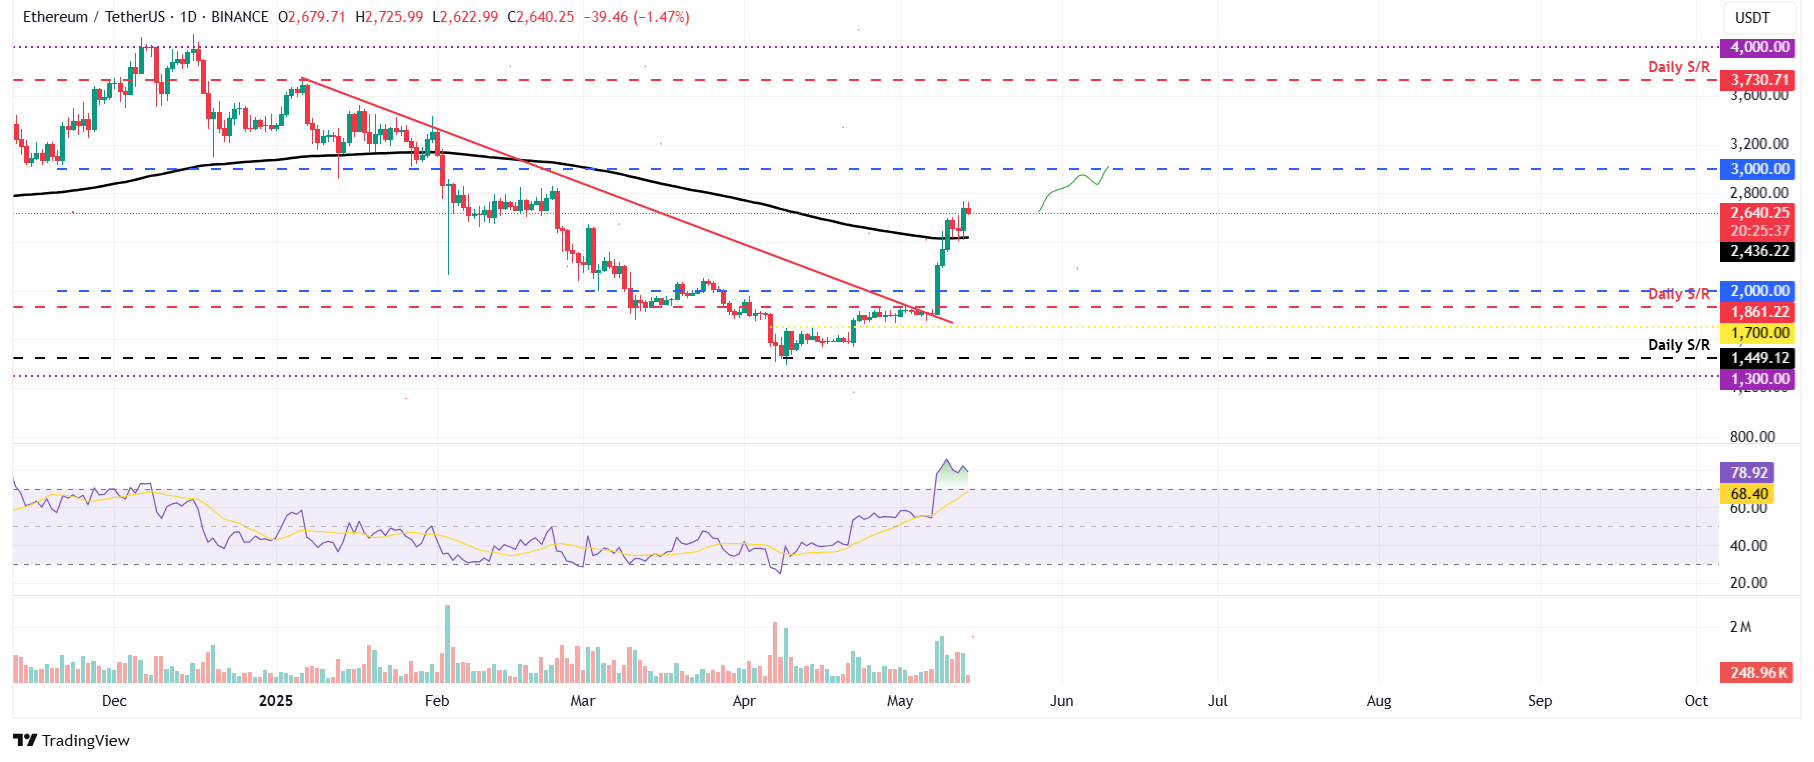
Ethereum price retested and found support around its 200-day Exponential Moving Average (EMA) around $2,436 on Monday and rallied 7.38% the next day. At the time of writing on Wednesday, it hovers at around $2,640.
If the 200-day EMA at $2,436 continues to hold as support, it could extend the rally to retest its key psychological level at $3,000.
The RSI on the daily chart reads 78 above its overbought levels of 70, indicating strong bullish momentum. However, traders should be cautious as the chances of a pullback are high due to its overbought condition. Another possibility is that the RSI remains above its overbought level of 70 and continues its upward trend.
ETH/USDT daily chart
On the other hand, if ETH faces a pullback, it could find support around its 200-day EMA at around $2,436.
XRP bulls could rally if it closes above the $2.72 resistance
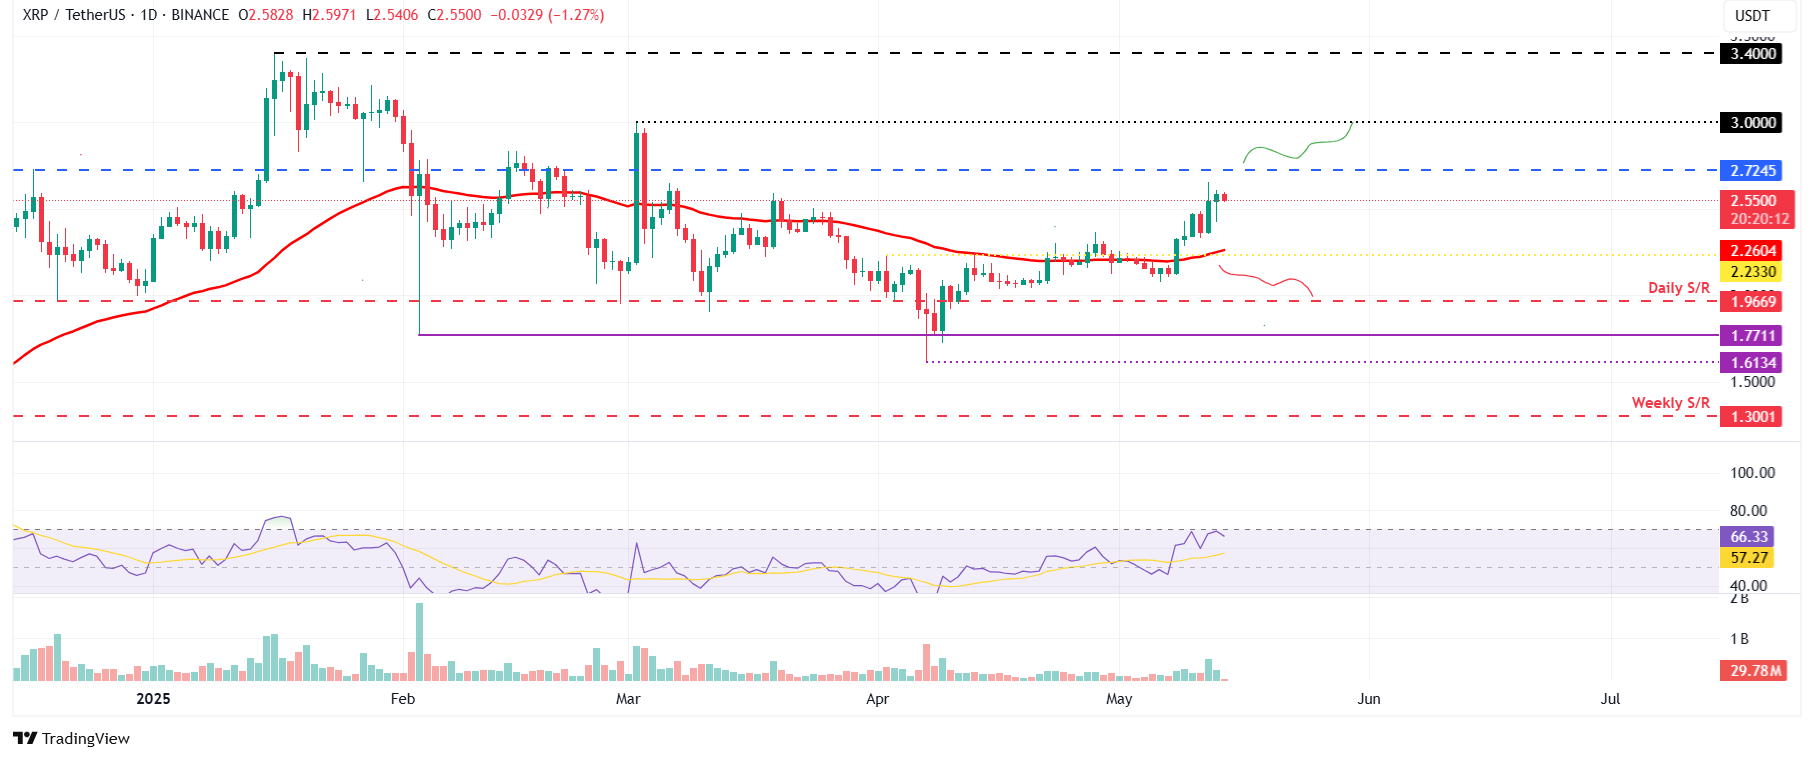
XRP price broke and closed above its 50-day EMA level at $2.26 on April 8 and rallied 21% until Tuesday. At the time of writing on Wednesday, it hovers at around $2.55.
If XRP continues its upward trend and closes above its daily resistance at $2.72, it could trigger a rally toward the psychological $3.00 barrier.
However, the RSI on the daily chart reads 66, rejecting from its overbought levels at 70 on Tuesday, indicating fading bullish momentum. The RSI must move above its current levels for the bullish momentum to be sustained.
XRP/USDT daily chart
Conversely, if XRP faces a pullback, it could extend the correction toward its 50-day EMA at $2.26.