- Bitcoin recovers slightly, trading above $60,000 after falling nearly 6% in the previous week.
- Ethereum attempts to stabilize after the recent correction, with the critical $1,500 support level holding firm.
- XRP steadies around the key $1.00 psychological level following its recent sell-off.
Bitcoin (BTC), Ethereum (ETH) and Ripple (XRP) are showing early signs of stabilization on Monday after a correction of nearly 6%, 8% and 7%, respectively, over the previous week. BTC reclaims $60,000, ETH is holding firmly above the critical $1,500 support level, while XRP is also attempting to stabilize around the key $1.00 psychological level. The price action of these top three cryptocurrencies is raising hopes of a short-term recovery after massive corrections.
Bitcoin’s mild recovery after a sharp correction
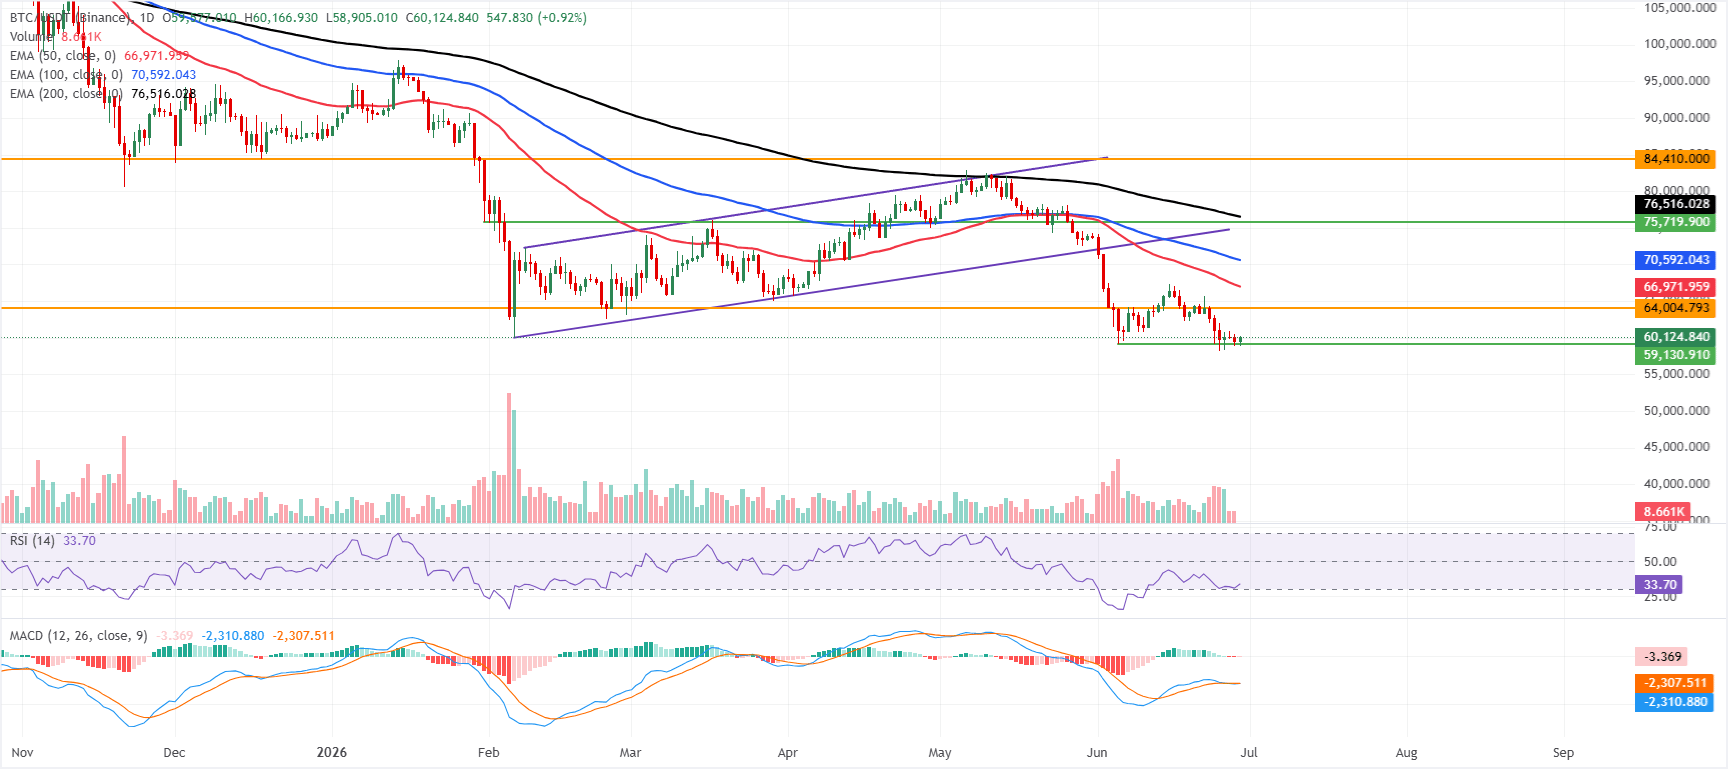
Bitcoin price recovers slightly, trading above $60,000, after losing over 6% in the previous week. However, BTC is maintaining a bearish bias as price remains below the 50-, 100-, and 200-day Exponential Moving Averages (EMAs) at $66,971, $70,592, and $76,516, respectively.
The Moving Average Convergence Divergence (MACD) indicator hovers near the zero line with a marginally negative reading, while the Relative Strength Index (RSI) at 33 sits just above oversold territory, hinting at fading bearish momentum but not yet signaling a decisive recovery.
On the topside, initial resistance emerges at the horizontal barrier around $64,004, ahead of the 50-day EMA at $66,971 and the 100-day EMA at $70,591, which collectively cap the upside and reinforce the broader downbeat structure. Further up, the 200-day EMA at $76,516 and the prior horizontal level at $84,410 form a wider resistance band that would need to be cleared for the medium-term outlook to shift back to bullish. The absence of nearby defined support leaves the pair vulnerable to further downside probes if selling pressure resumes.
Ethereum could rebound if the $1,500 support holds
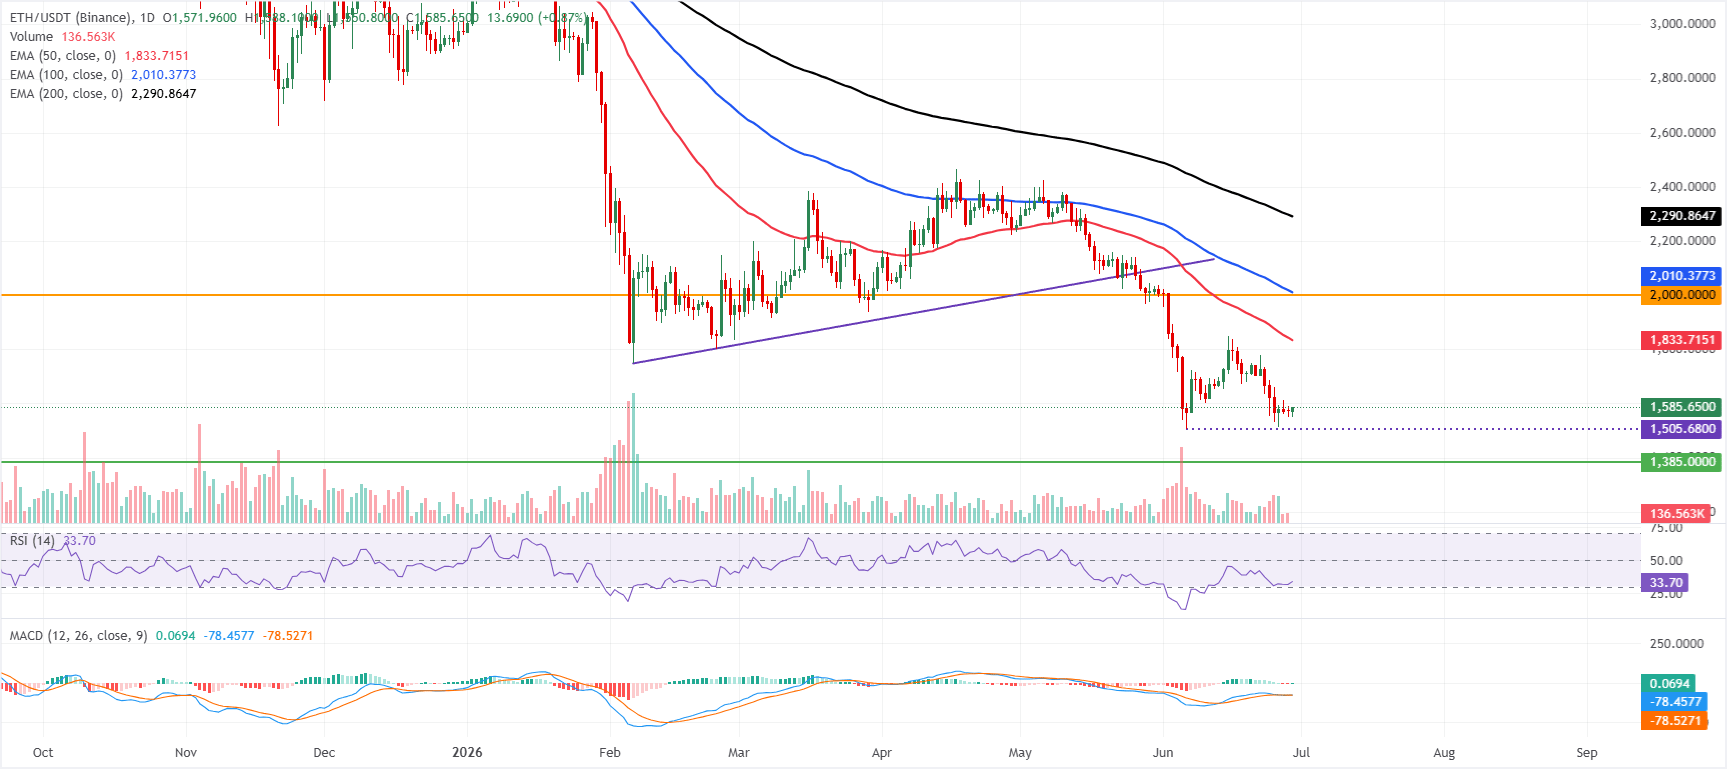
Ethereum price trades at $1,585 on Monday, finding support around the key $1,500 support zone. However, ETH is maintaining a bearish bias, with price remaining well below the 50-, 100-, and 200-day EMAs at $1,833, $2,010, and $2,290, respectively. ETH is attempting to stabilize after the recent slide, with the RSI ticking up to 33, just above oversold territory. At the same time, the MACD has turned marginally positive, hinting at fading downside momentum rather than a decisive bullish reversal.
On the topside, initial resistance emerges at the 50-day EMA near $1,833, ahead of the horizontal barrier at $2,000 and the 100-day EMA at $2,010, with the 200-day EMA at $2,290 reinforcing a broader cap on recovery attempts.
On the downside, the next meaningful support is seen at the $1,500 key psychological level, followed by the previously identified horizontal level around $1,385.00, where buyers could attempt to defend the medium-term floor if selling pressure resumes.
XRP steadies at key $1 mark
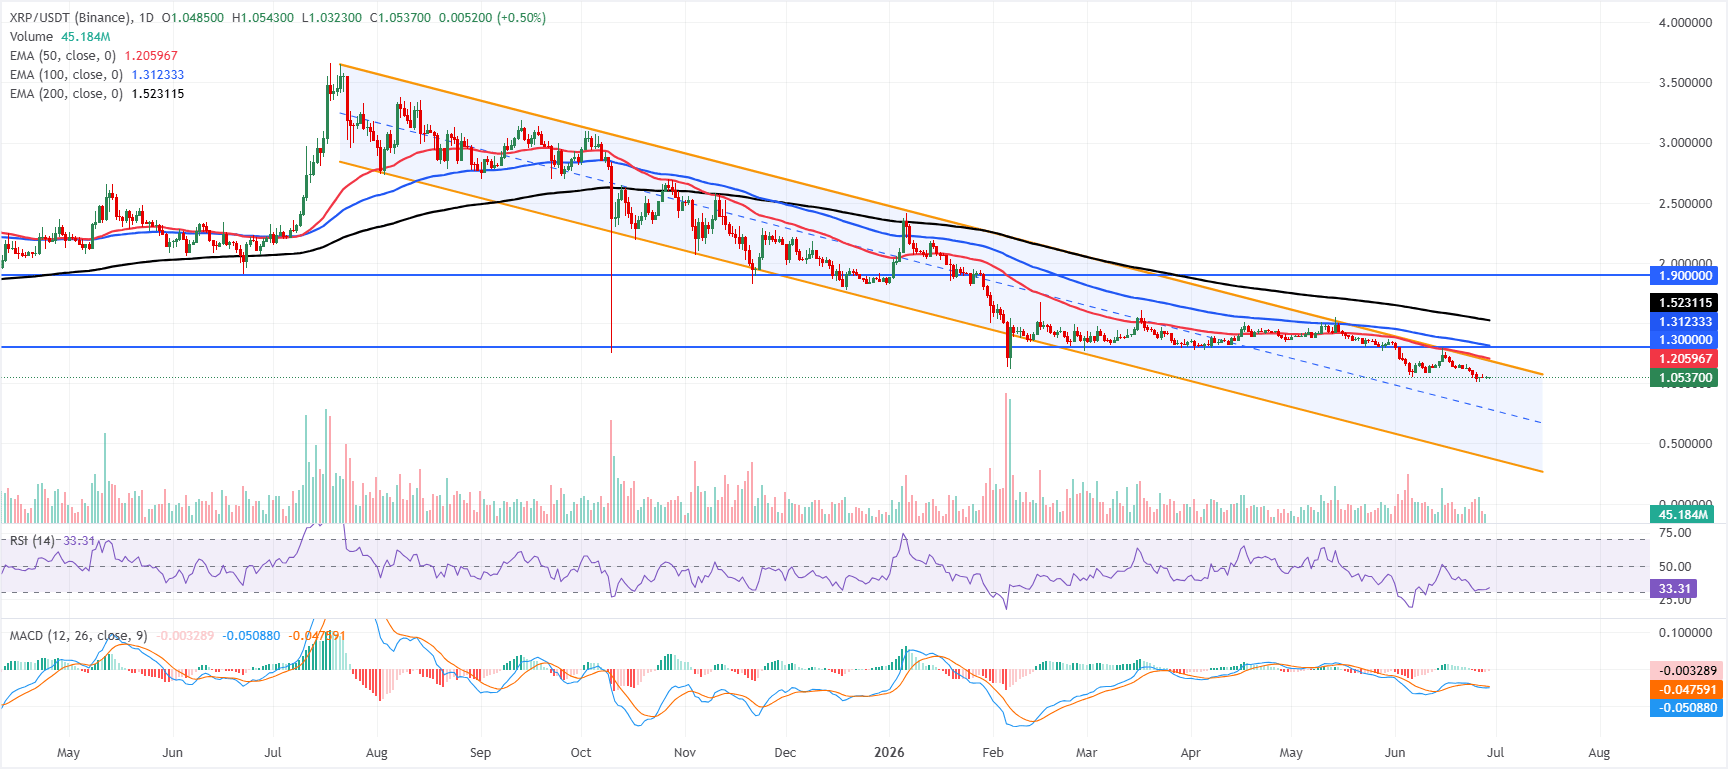
XRP price trades at $1.0542, maintaining a clear bearish bias as it sits well below the 50-, 100-, and 200-day EMAs at $1.2060, $1.3123, and $1.5231, respectively. Price also holds below the downward parallel channel reference at $1.1879 and the horizontal cap at $1.3000, reinforcing a technically capped structure. The RSI at 33 stays in weak territory just above oversold, while the MACD remains slightly negative, both indicators hinting that bearish momentum persists, albeit without a fresh acceleration.
On the topside, initial resistance is seen at the parallel channel level around $1.1879, followed by the nearby horizontal barrier at $1.3000 and the 50-day EMA at $1.2060. Additional supply is clustered higher at the 100-day EMA at $1.3123 and the 200-day EMA at $1.5231. A more distant structural ceiling emerges at the horizontal line near $1.9000.
On the downside, the next meaningful support is seen at the $1.000 key psychological level. Below this level, renewed selling could leave XRP vulnerable to further downside extension until new demand zones emerge on the chart.