- Bitcoin price edges below $91,000 after being rejected from a key resistance level the previous day.
- The Federal Reserve’s cautious and hawkish December rate cut weighs on BTC.
- On-chain data shows selling pressure is easing, increasing the chances of a relief rally.
Bitcoin (BTC) price edges down for the second consecutive day, trading below $91,000 at the time of writing on Thursday, driven by a broader market risk-averse sentiment following the US Federal Reserve’s (Fed) hawkish rate cut. Despite the current weakness, on-chain data suggests selling pressure is fading, hinting that the largest cryptocurrency by market capitalization could potentially recover in the upcoming days.
Fed’s cautious rate cut weighs on riskier assets
Bitcoin price softened slightly, closing at $92,015 on Wednesday following the Federal Open Market Committee (FOMC) meeting. In a widely expected move, the US Federal Reserve (Fed) lowered interest rates by 25 basis points to 3.50%-3.75% at the end of its two-day policy meeting but signaled a likely pause in January.
Adding to the cautious tone, policymakers projected only a one-quarter-percentage-point cut in 2026, the same outlook as in September, which tempered market expectations of two rate cuts and contributed to short-term pressure on risk assets.
This hawkish rate cut and the Fed’s cautious stance triggered a slight risk-off sentiment that was exacerbated by disappointing results from Oracle after the US close. All these factors weighed on riskier assets, with the largest cryptocurrency by market capitalization briefly slipping below $90,000.
On-chain data shows easing selling pressure
CryptoQuant’s weekly report on Wednesday highlights that selling pressure on Bitcoin is beginning to ease.
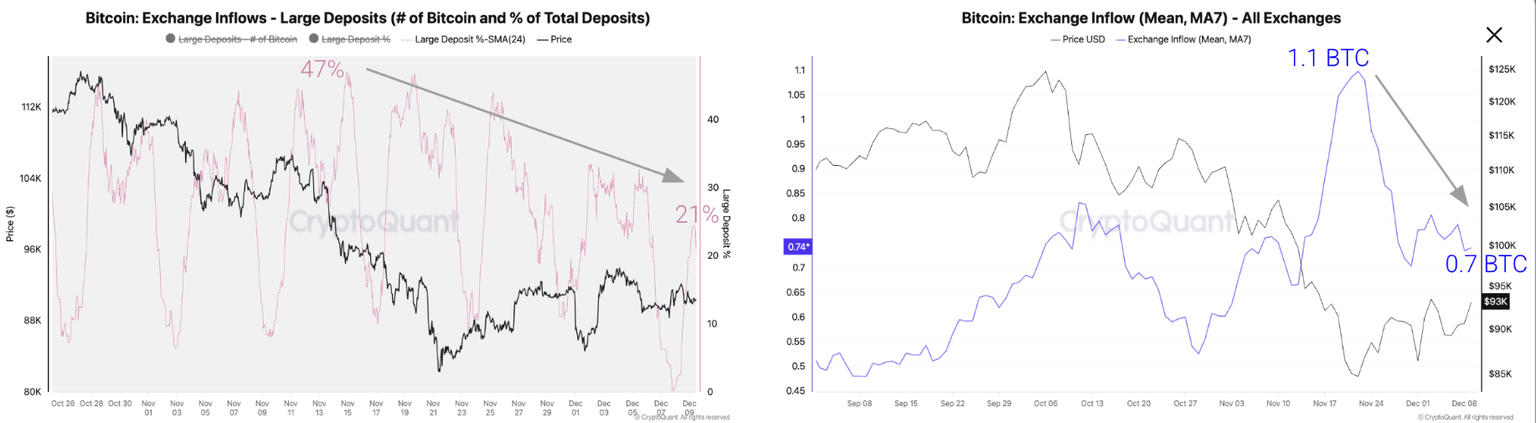
The report notes that exchange deposits eased as large players reduced their transfers to exchanges. The graph below shows that the share of total deposits from large players has declined from a 24-hour average high of 47% in mid-November to 21% as of Wednesday. At the same time, the average deposit has declined by 36%, from 1.1 BTC in November 22 to 0.7 BTC.
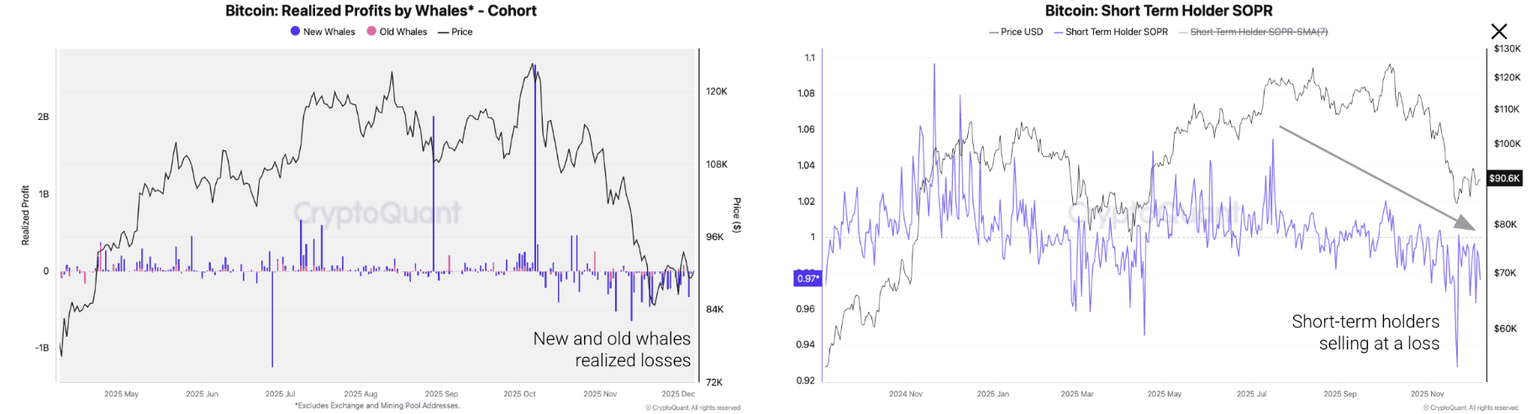
Moreover, downward pressure on Bitcoin’s price eased as large investors and short-term holders continued to realize losses. The chart below shows that on November 13, new and old whales realized the largest losses since July, $646 million, as prices first crossed below $100,000. Since then, these large investors have realized a total net loss of $3.2 billion. Meanwhile, short-term holders have been selling Bitcoin at a negative profit margin since mid-November (SOPR below 1), with the lowest reaching -7%. Historically, selling pressure eases when market participants realize they have incurred heavy losses.
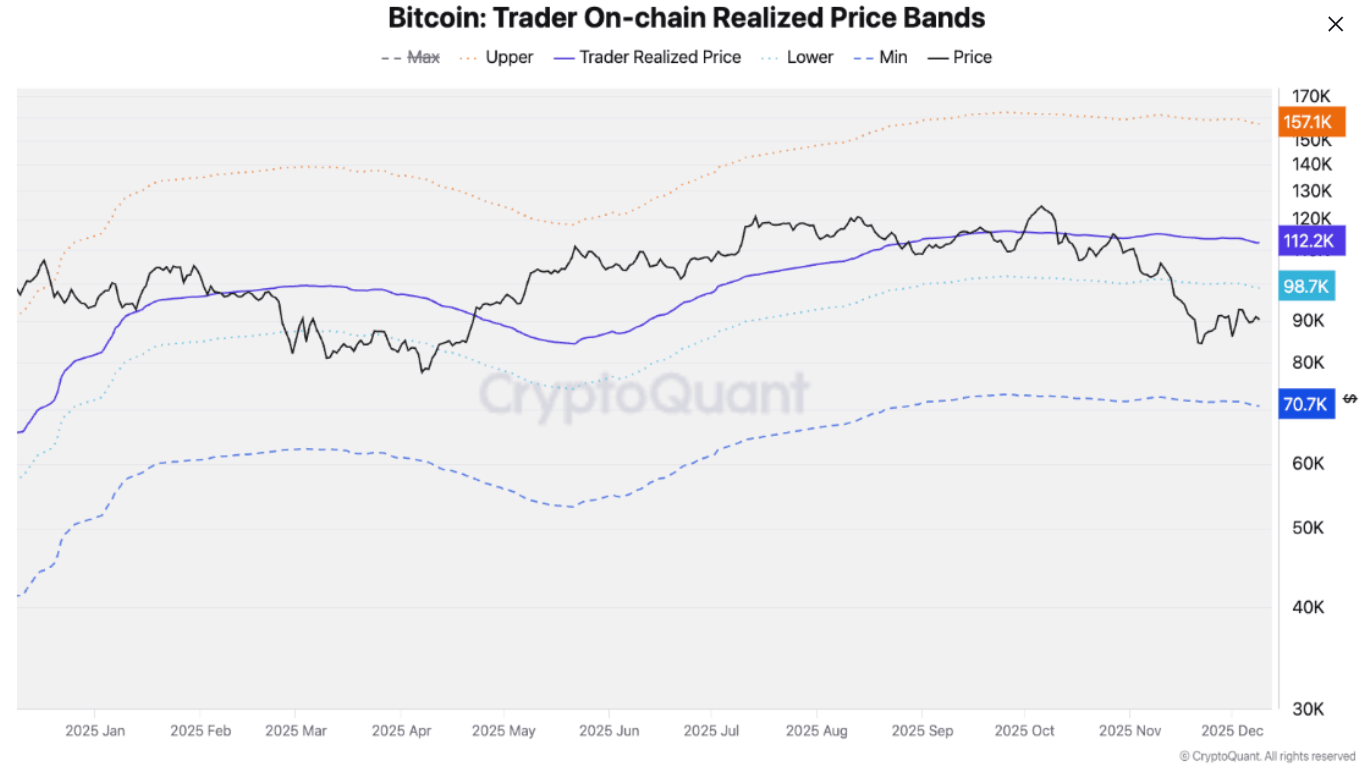
CryptoQuant concludes that, if selling pressure remains low, a relief rally could push Bitcoin back to $99,000. This level is the lower band of the Trader On-chain Realized Price bands, which is a price resistance during bear markets. After this level, the key price resistances are $102,000 (one-year moving average) and $112,000 (the Trader On-chain Realized price).
Some other signs of optimism come from ETFs
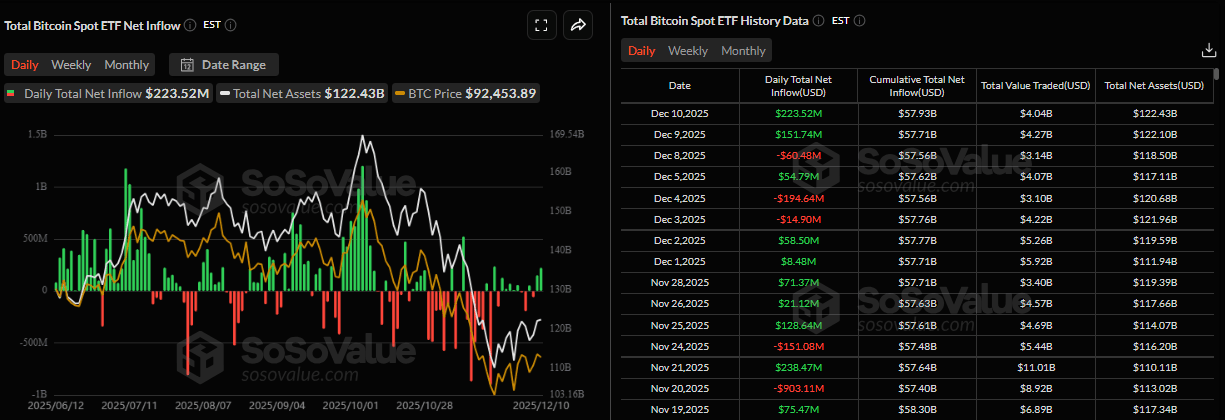
Institutional demand for Bitcoin shows a slight improvement. According to SoSoValue data, US-listed spot Bitcoin ETFs recorded $223.52 in inflows on Wednesday, the second consecutive day of inflows this week. For BTC to continue its recovery, the ETF inflows should intensify.
Bitcoin Price Forecast: BTC faces rejection from key resistance level
Bitcoin price was rejected at the 61.8% Fibonacci retracement level at $94,253 (drawn from the April low of $74,508 to the all-time high of $126,199 set in October) on Wednesday and declined slightly that day. At the time of writing on Thursday, it continues to trade down at around $90,300.
If BTC continues its correction, the next key support is at $85,569, which aligns with the 78.6% Fibonacci retracement level.
The Relative Strength Index (RSI) on the daily reads 44, below its neutral level of 50 and pointing downward, indicating bearish momentum is increasing.
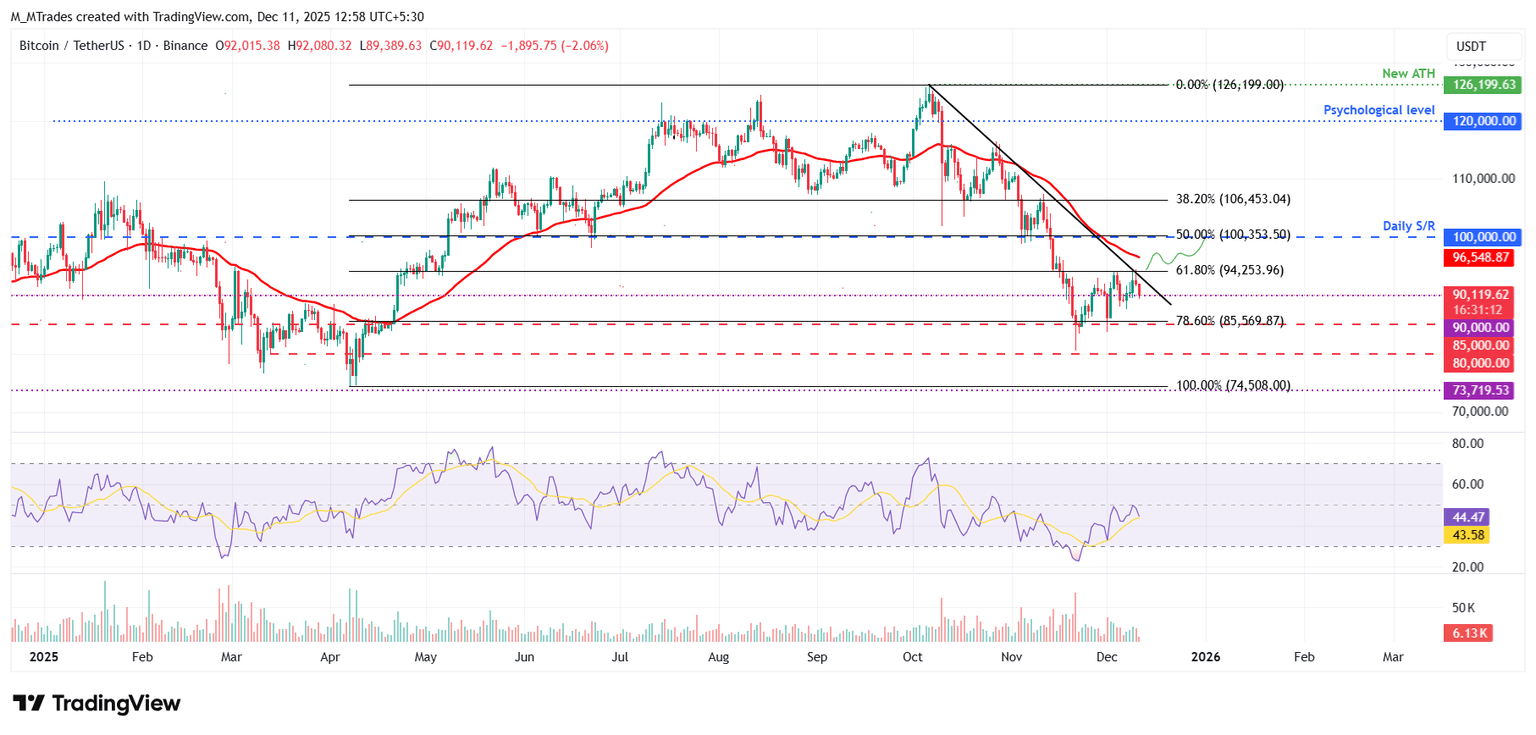
Looking up, if BTC recovers and closes above the $94,253 resistance level, the next key area to watch is the $100,000 psychological level.