S&P 500 — US Large Cap Index
 FTSE 100 — UK Blue Chips
 Euro Stoxx 50 — Eurozone Leaders
 DAX 40 — German Equities
 CAC 40 — French Market Index
 Nikkei 225 — Japan Benchmark
 Hang Seng — Hong Kong Index
 Shanghai Composite — China Mainland
 ASX 200 — Australian Market
 TSX Composite — Canada Index
 Nifty 50 — India Large Cap
 STI Index — Singapore Market
 KOSPI — South Korea Index
 Bovespa — Brazil Equities
 JSE Top 40 — South Africa Index
 IPC Index — Mexico Market
- Bitcoin holds above the $112,500 level, but recovery remains subdued as whales reduce exposure.
- Ethereum struggles to hold above $4,100 as risk-off sentiment manifests in ETF outflows.
- XRP exhibits subtle signs of recovery, supported by the 100-day EMA.
Bitcoin (BTC) is paring intraday losses, trading above $112,500 at the time of writing on Wednesday. Due to extreme volatility this week, the BTC price dipped to $111,042 earlier in the day amid intense risk-off sentiment, particularly among the whales.
If the short-term support at $111,868 holds, Bitcoin could steady its recovery toward $116,000, but traders must be cautious, considering the volatility in the broader cryptocurrency market.
Altcoins, including Ethereum (ETH) and Ripple (XRP), are also struggling to shake off bearish shackles, but downside risks still linger.
Data spotlight: Whales de-risk as Bitcoin struggles
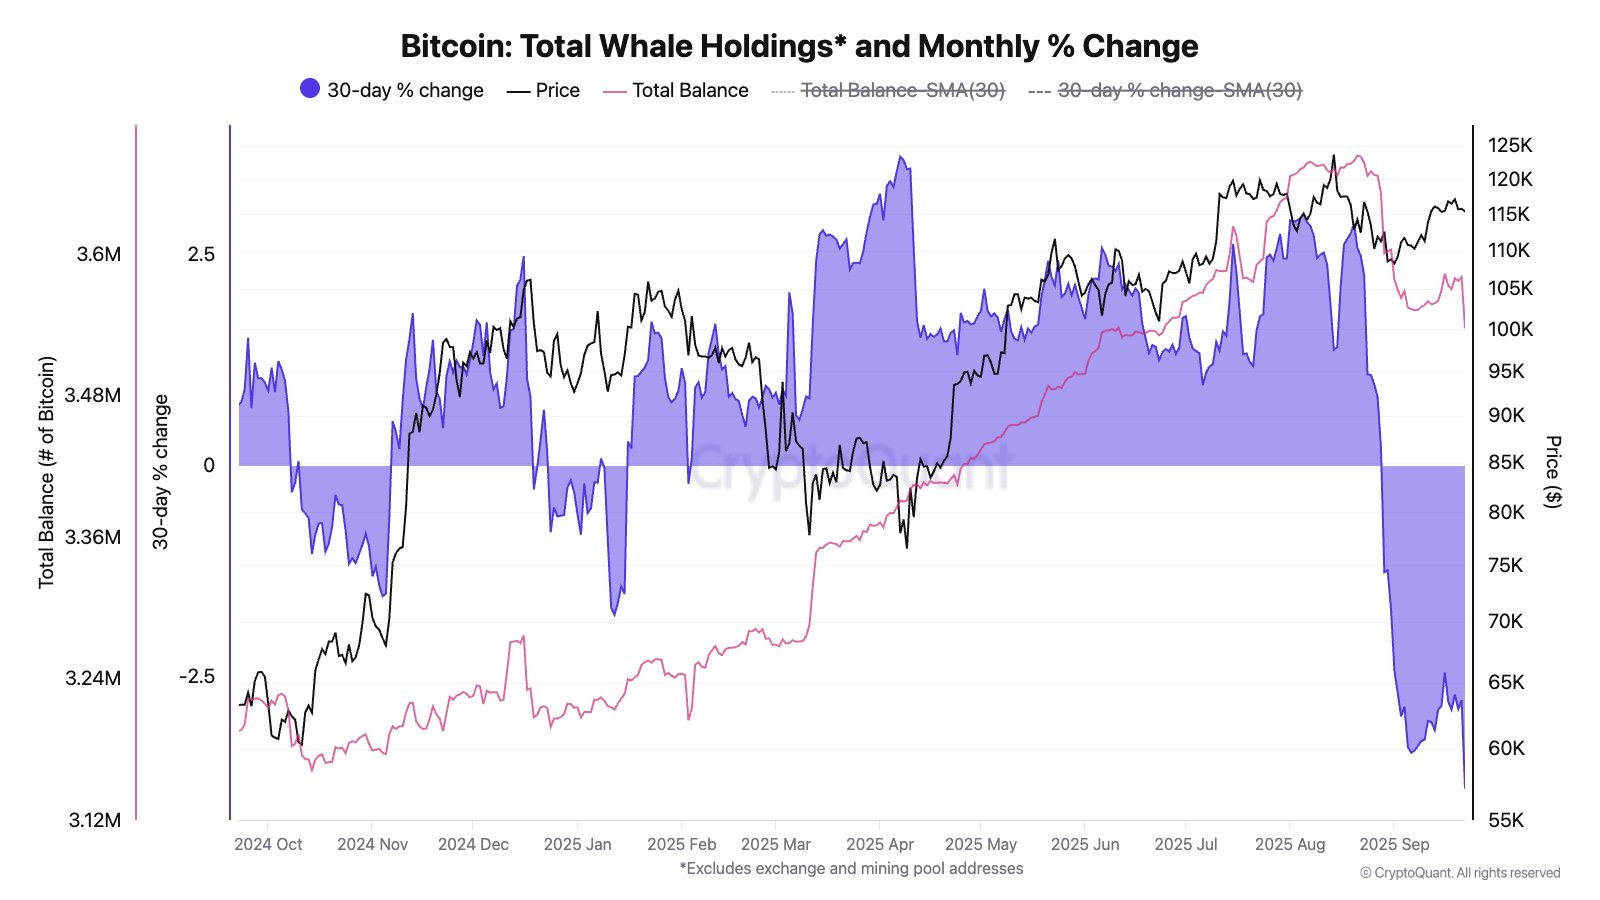
The amount of BTC held by large-volume holders, also known as whales, has declined drastically over the last two months, contributing to the current market volatility.
According to CryptoQuant data, whales have reduced their holdings by 147,000 BTC valued at $16.5 billion at the current exchange rate of $112,500 per Bitcoin. The chart below illustrates the significant decline in the total balance held by whales every month, which may be contributing to suppressed prices.
Bitcoin whale holdings | Source: CryptoQuant
If this de-risking trend persists, short-term recovery could be a pipe dream, increasing the chances of the Bitcoin price dropping below the $110,000 level.
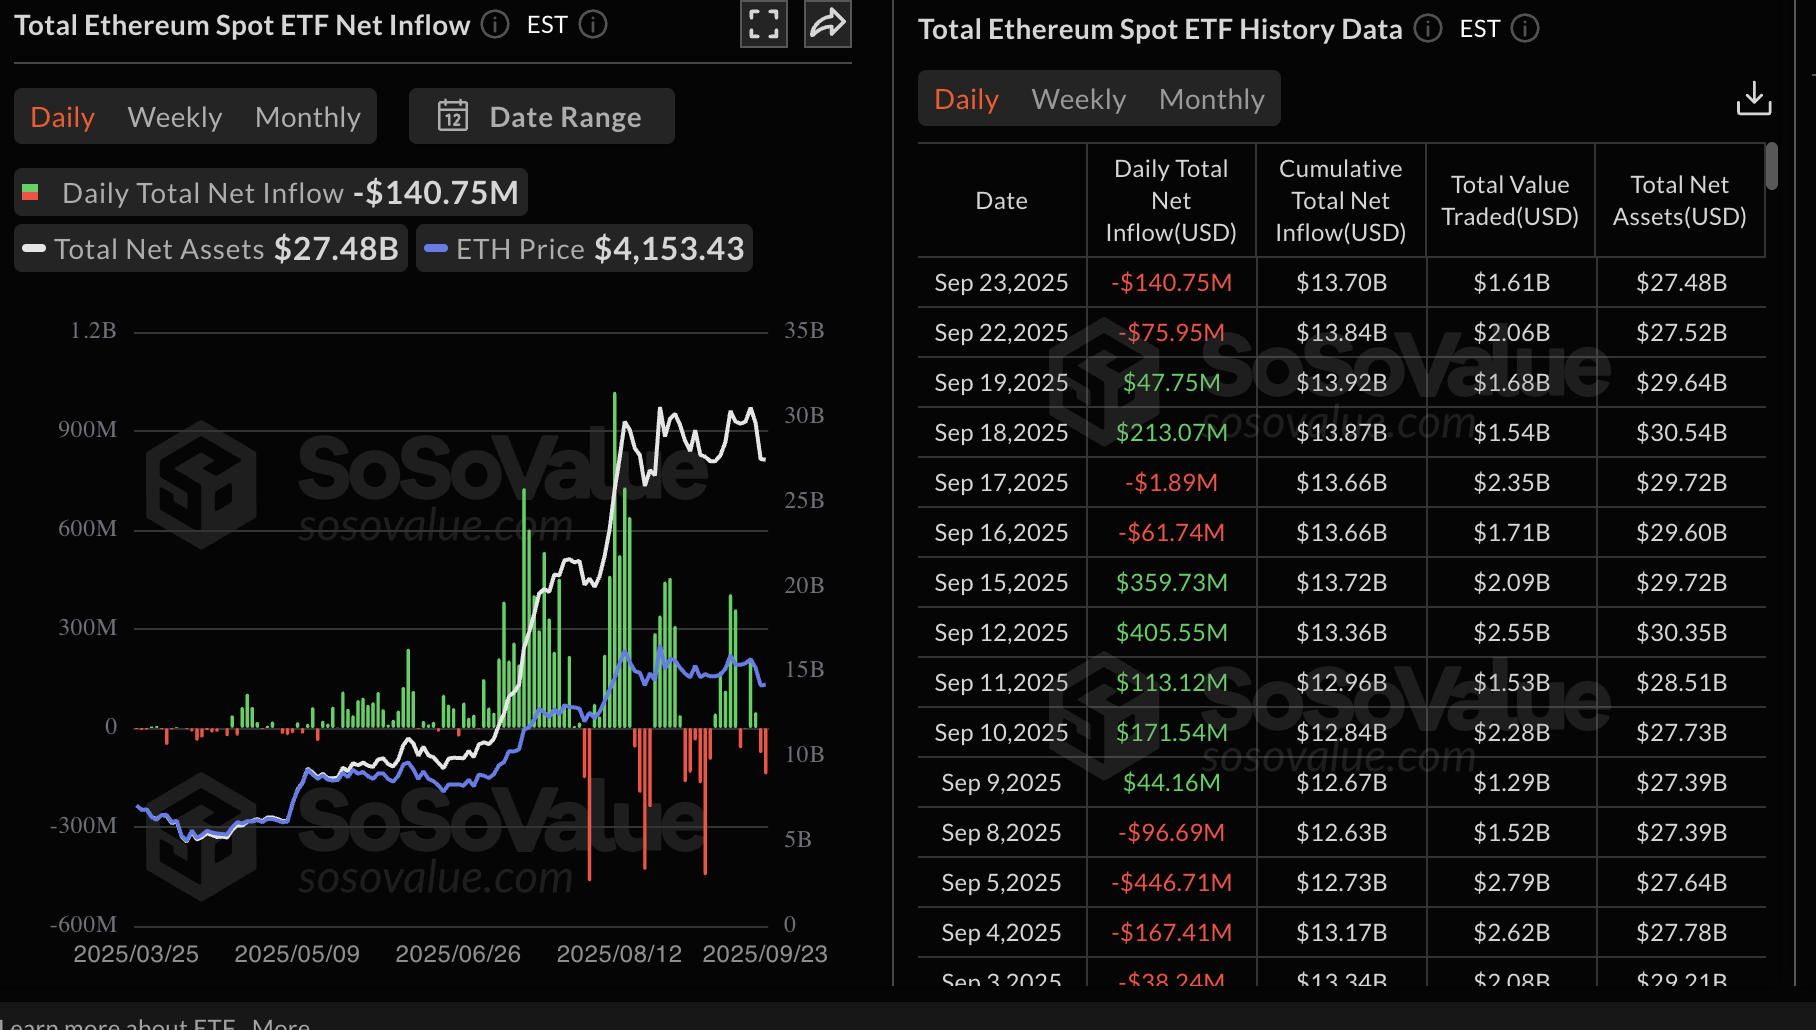
The volatility in the cryptocurrency market has also impacted institutional demand for crypto-related financial products, with Ethereum spot Exchange Traded Funds (ETFs) experiencing two consecutive days of outflows by Tuesday.
According to SoSoValue data, ETH ETFs in the United States (US) saw outflows of approximately $141 million on Tuesday and $76 million on Monday.
Ethereum ETF stats | Source: SoSoValue
Should institutional demand remain suppressed in the coming days, the anticipated breakout toward ETH’s all-time high of $4,956 would be delayed in favor of further losses below the $4,000 level.
Chart of the day: Bitcoin holds key support
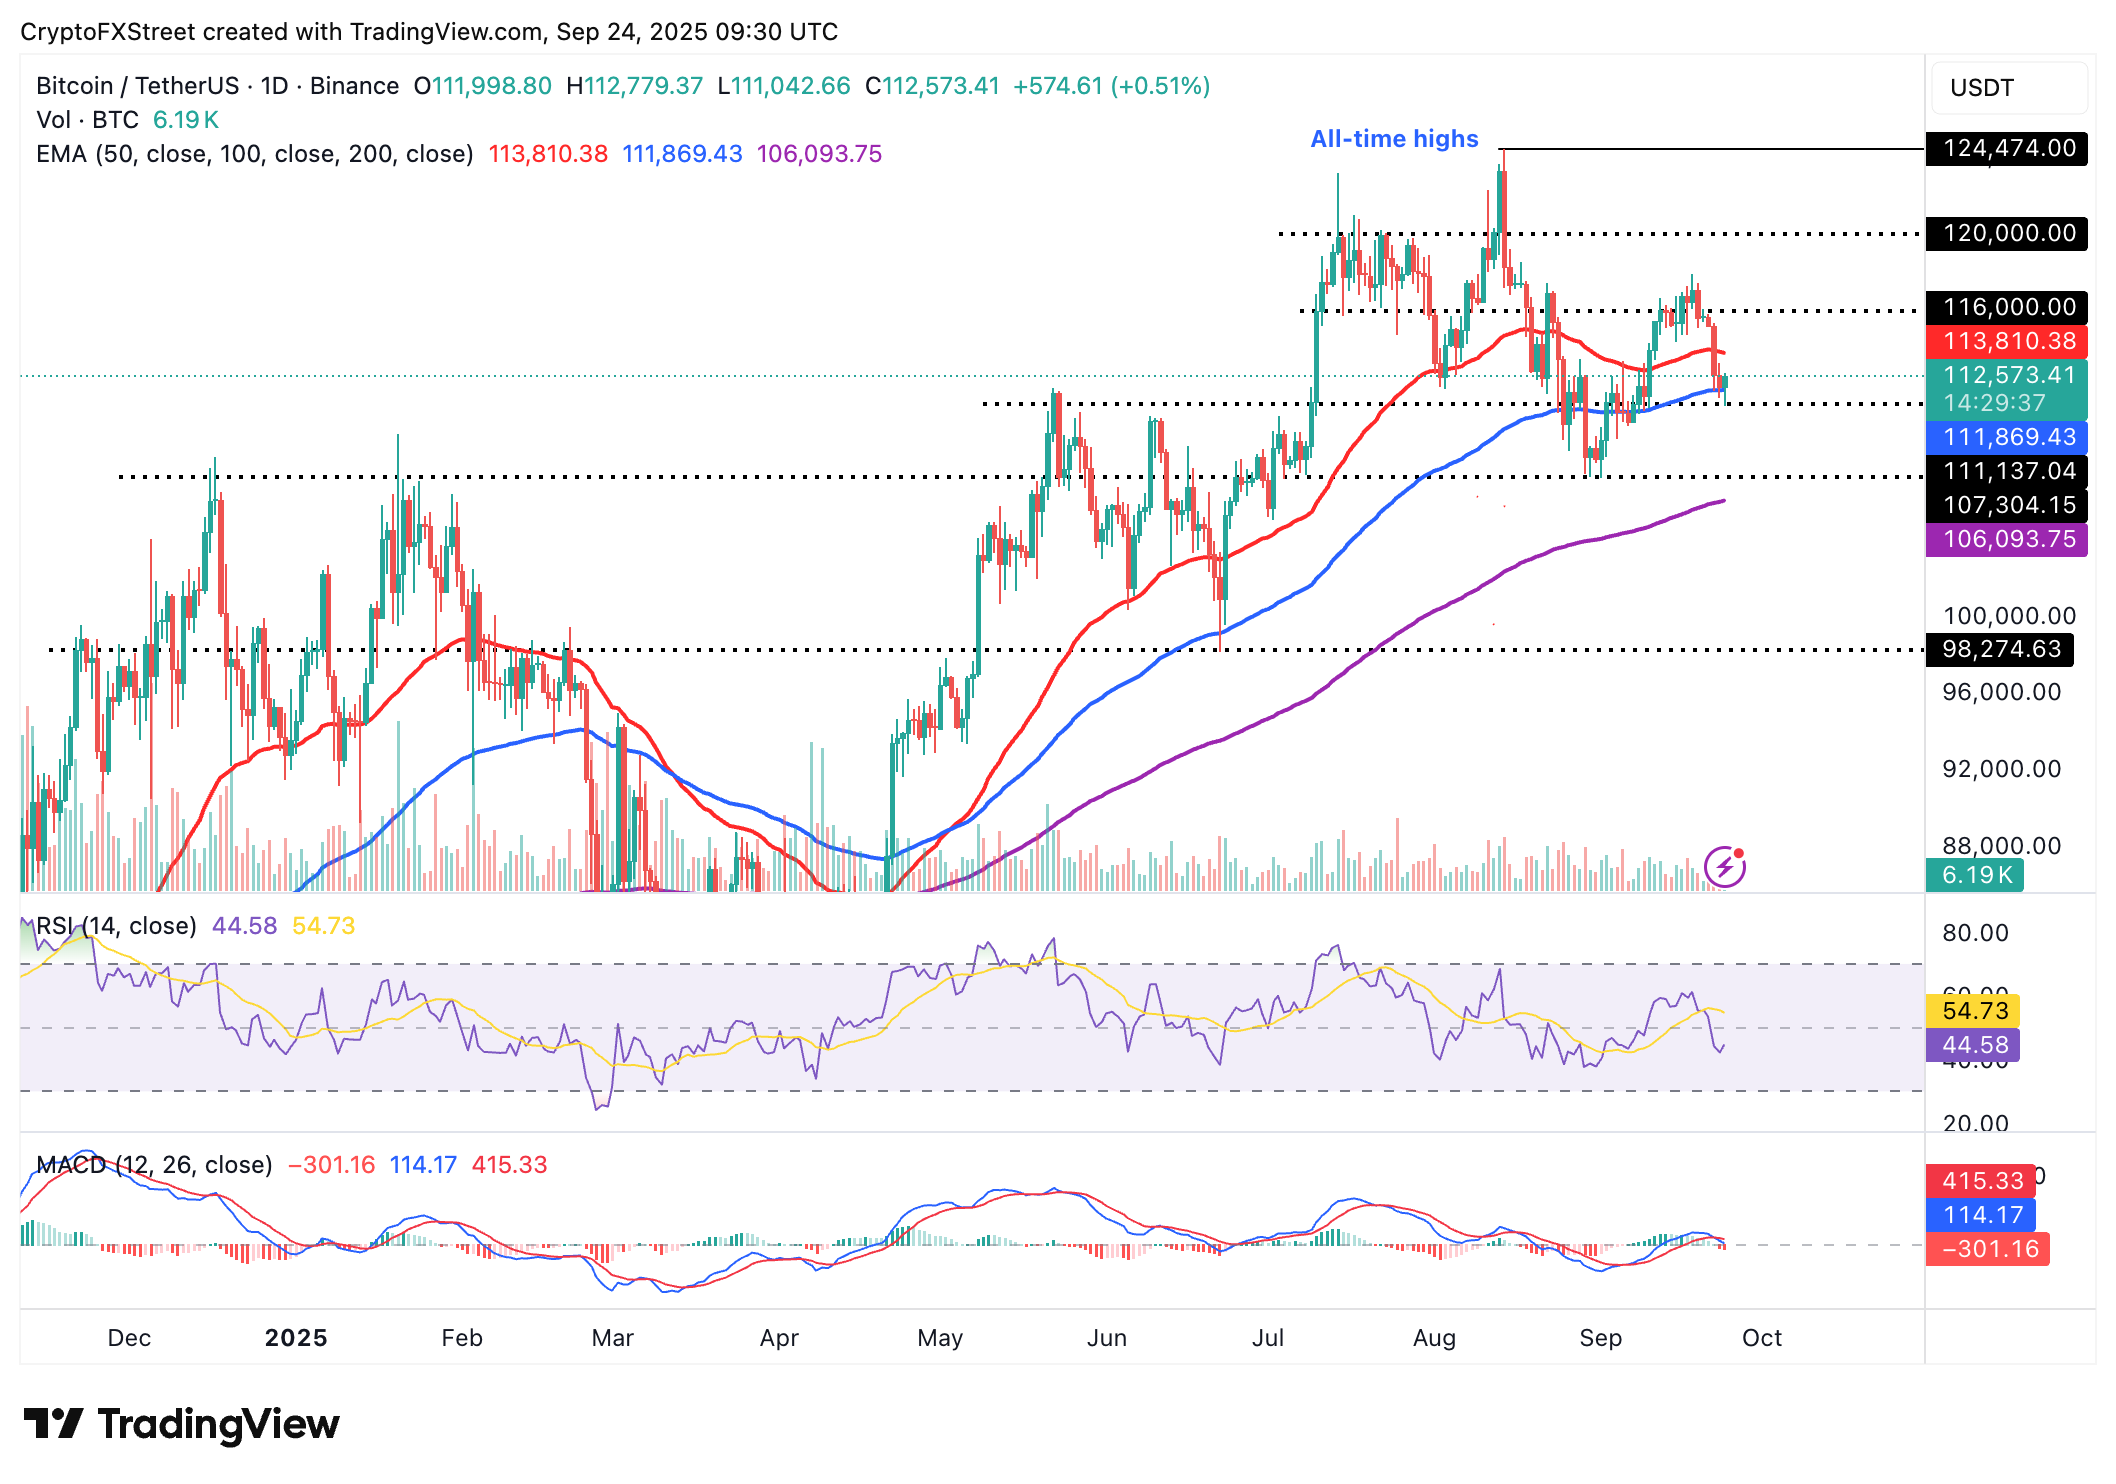
Bitcoin hovers above the 100-day Exponential Moving Average (EMA) on the daily chart, which provides immediate support at $111,869. A green candle has driven the price above the $112,500 round-number short-term support, highlighting subtle signs of recovery.
The Relative Strength Index (RSI), which has risen to 44, suggests that retail demand for Bitcoin is gradually increasing. However, downside risks are likely to remain until the RSI rises into the bullish region above the midline.
Key areas of interest for traders are the 50-day EMA at $113,810, which is likely to delay the recovery toward the $116,000 level, previously tested on Saturday.
BTC/USDT daily chart
Still, traders should be cautious, considering the Moving Average Convergence Divergence (MACD) indicator has maintained a sell signal since Monday. Investors could continue reducing their exposure, contributing to sell-side pressure. A break below the 100-day EMA at $111,869 could pave the way for declines below the $110,000 round-figure support.
Altcoins update: Ethereum struggles as XRP steadies
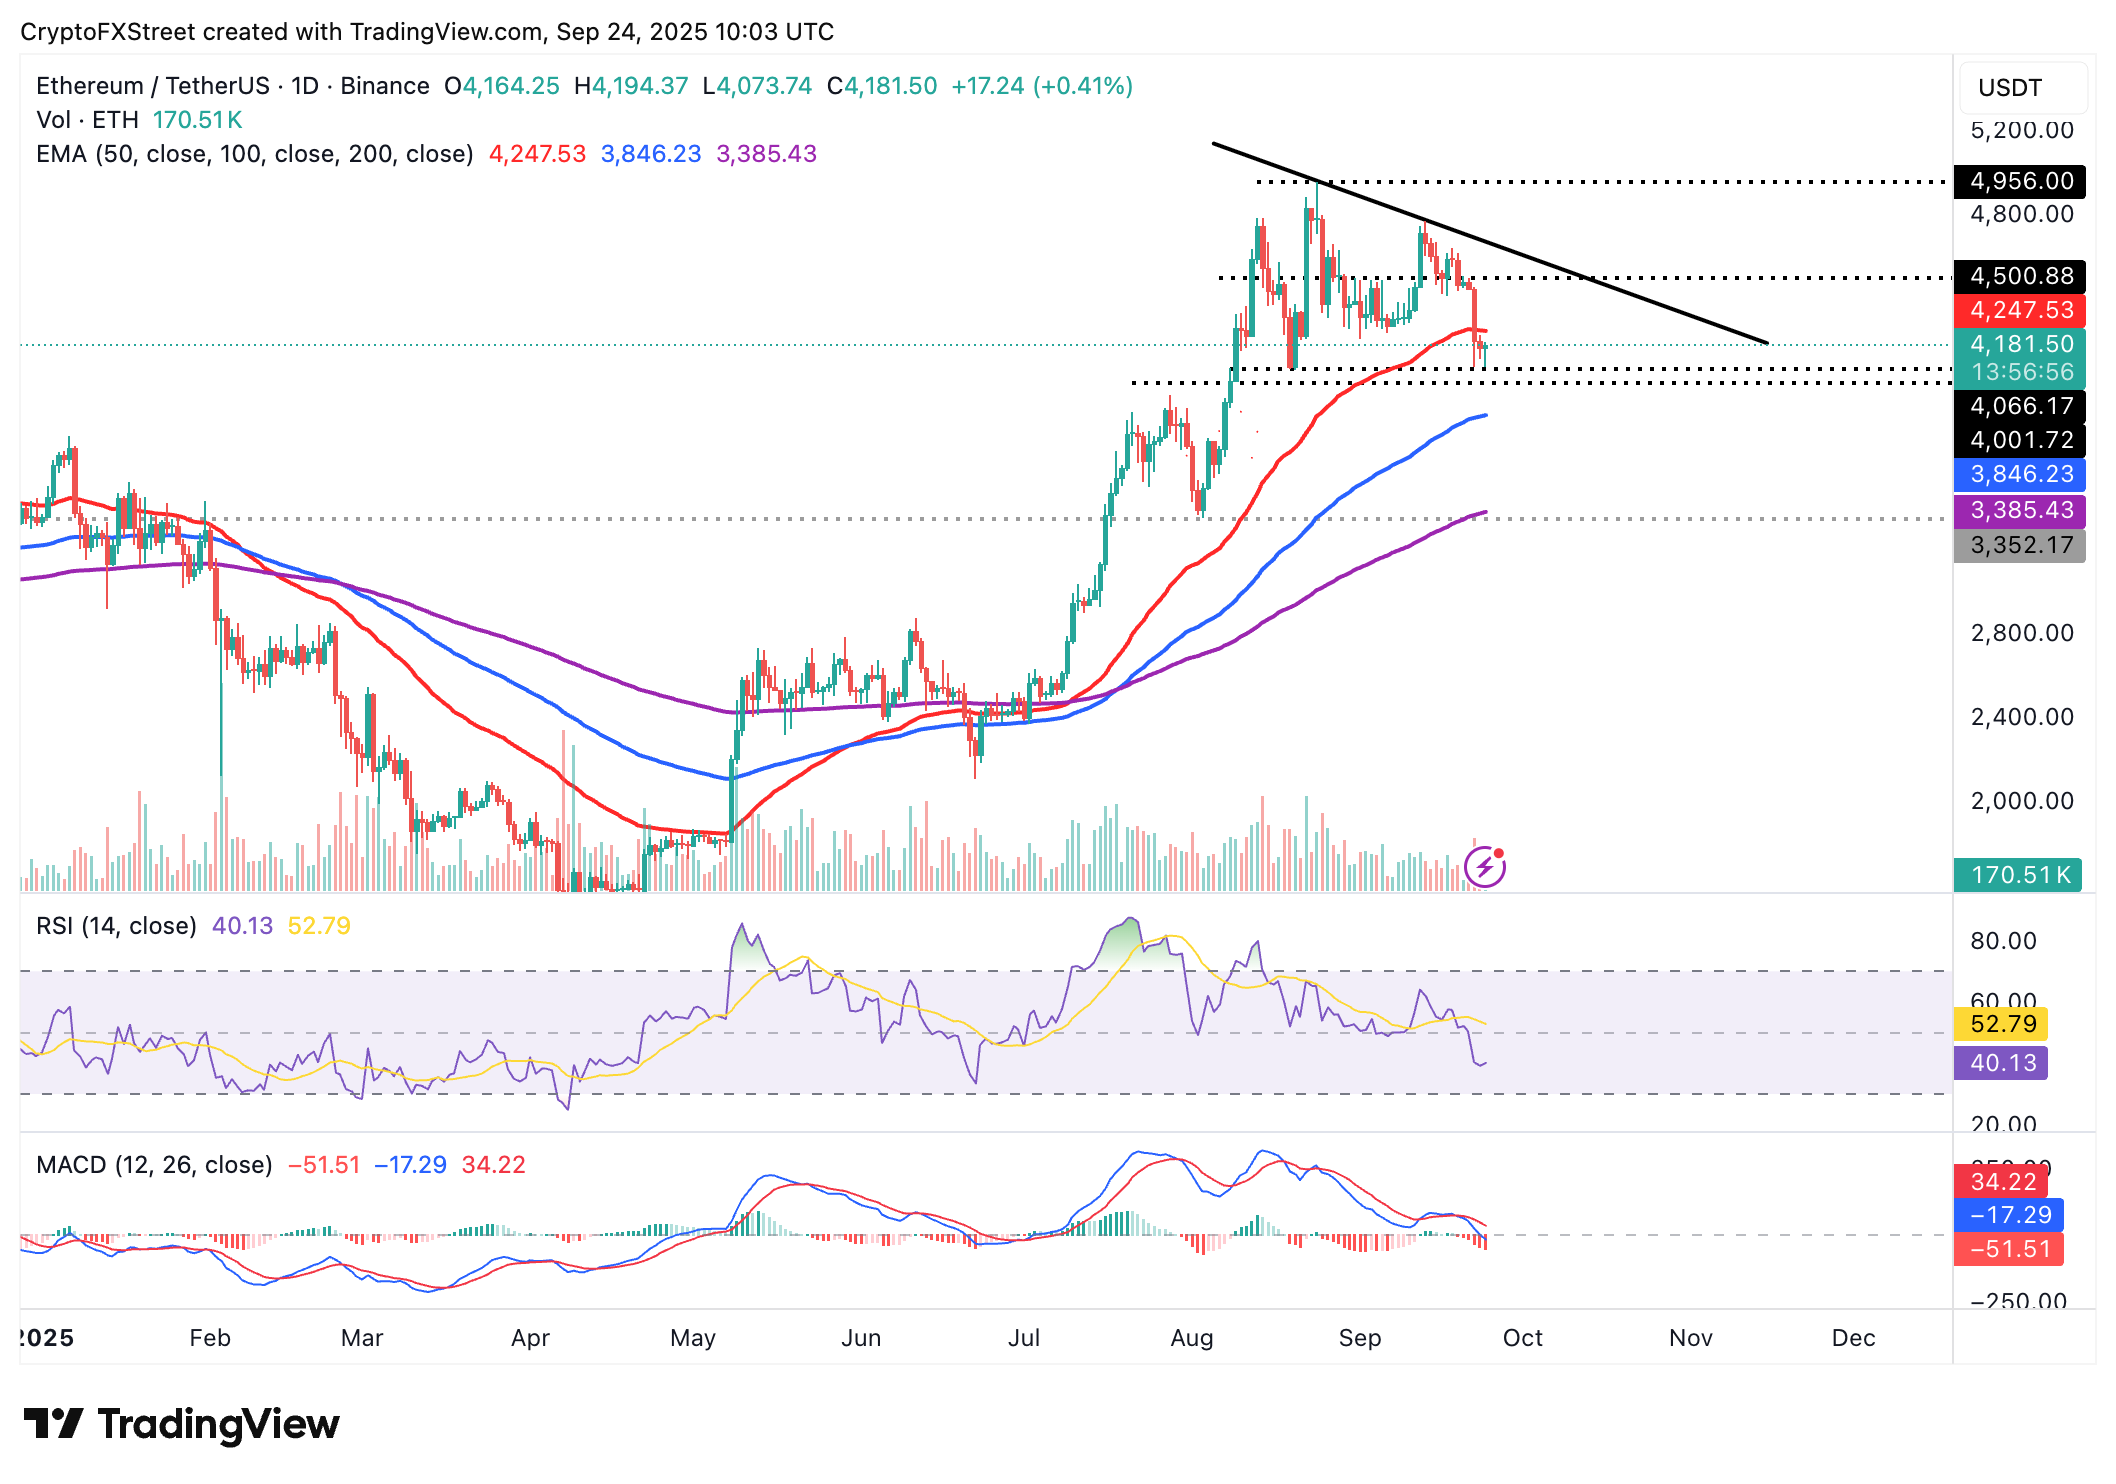
Ethereum trades in a narrow range between a short-term support at $4,066 and the 50-day EMA at $4,247. Based on the MACD indicator on the daily chart, which has sustained a sell signal since Saturday, bearish momentum remains sticky, with upside movement significantly suppressed. With the blue MACD line remaining below the red signal line, traders may continue de-risking, increasing the chances of the downtrend extending below the short-term $4,066 support.
Key areas of interest for traders are the 100-day EMA at $3,846 and the 200-day EMA at $3,385, all of which could serve as tentative support levels if declines accelerate below $4,000.
On the other hand, a break and a daily close above the 50-day EMA at $4,247 would reinforce the bullish grip and steady the uptrend toward the next key resistance at $4,500, which was last tested on Sunday.
ETH/USDT daily chart
As for XRP, bulls show signs of regaining control after six consecutive days of declines. The daily chart highlights a short-term support level at the 100-day EMA, around $2.83, underlined by an upward-facing RSI at 43.
The potential movement of the RSI above the midline would indicate a steady bullish momentum, increasing the chances of the XRP price retesting the key $3.00 hurdle.
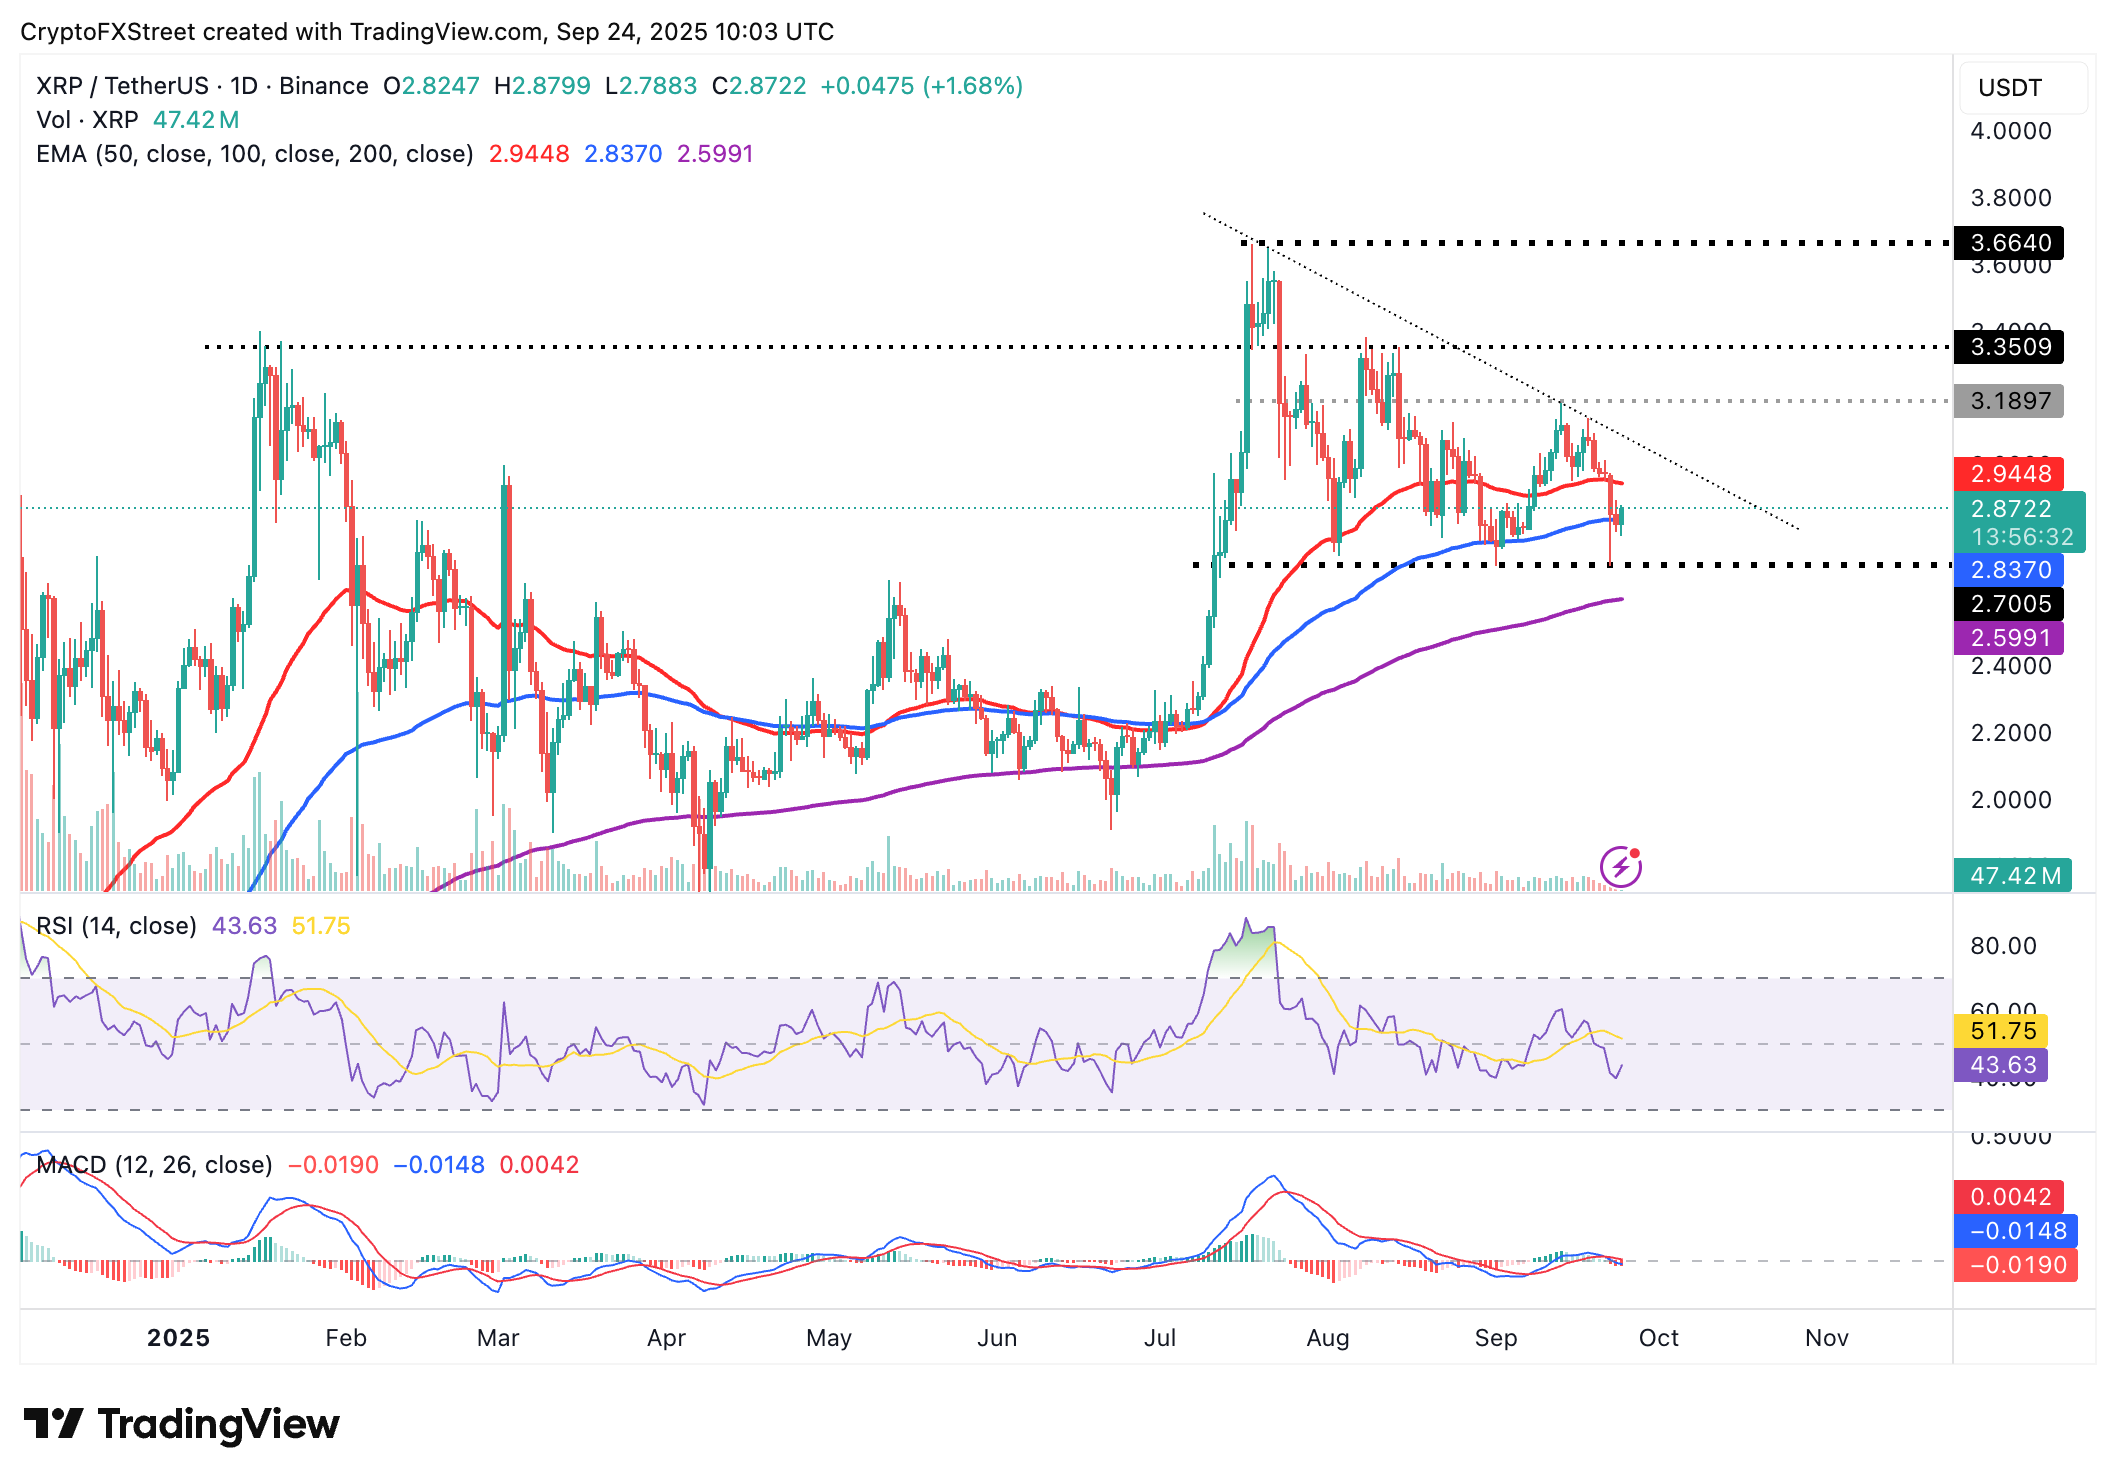
XRP/USDT daily chart
Still, if bulls fail to uphold gains above the 100-day EMA, trading below it could result in losses to $2.70, a level last tested on Monday, and with extended declines likely to test the 200-day EMA at $2.59.