What to know
- BlackRock’s IBIT has shown a bearish put bias for two consecutive months, indicating market caution.
- Traders have favored protective puts over bullish calls since July, suggesting a risk-averse sentiment.
- IBIT’s price uptrend has stalled since July.
Key metric tied to BlackRock’s Nasdaq-listed spot exchange-traded fund, IBIT, has been flashing warning signs for two straight months.
IBIT’s one-year put-call skew, a measure of market sentiment or pessimism, flipped positive on July 25 and has remained comfortably above zero since then, according to data source Market Chameleon. That’s two straight months of bearish put bias.
In other words, traders have consistently favored protective puts over bullish calls for two months, signaling a sustained cautious or risk-averse outlook.
A similar put option bias was observed from March 8 to April 21 this year, a period marked by sharp declines in both the spot price and IBIT, primarily driven by the trade war-induced weakness on Wall Street.
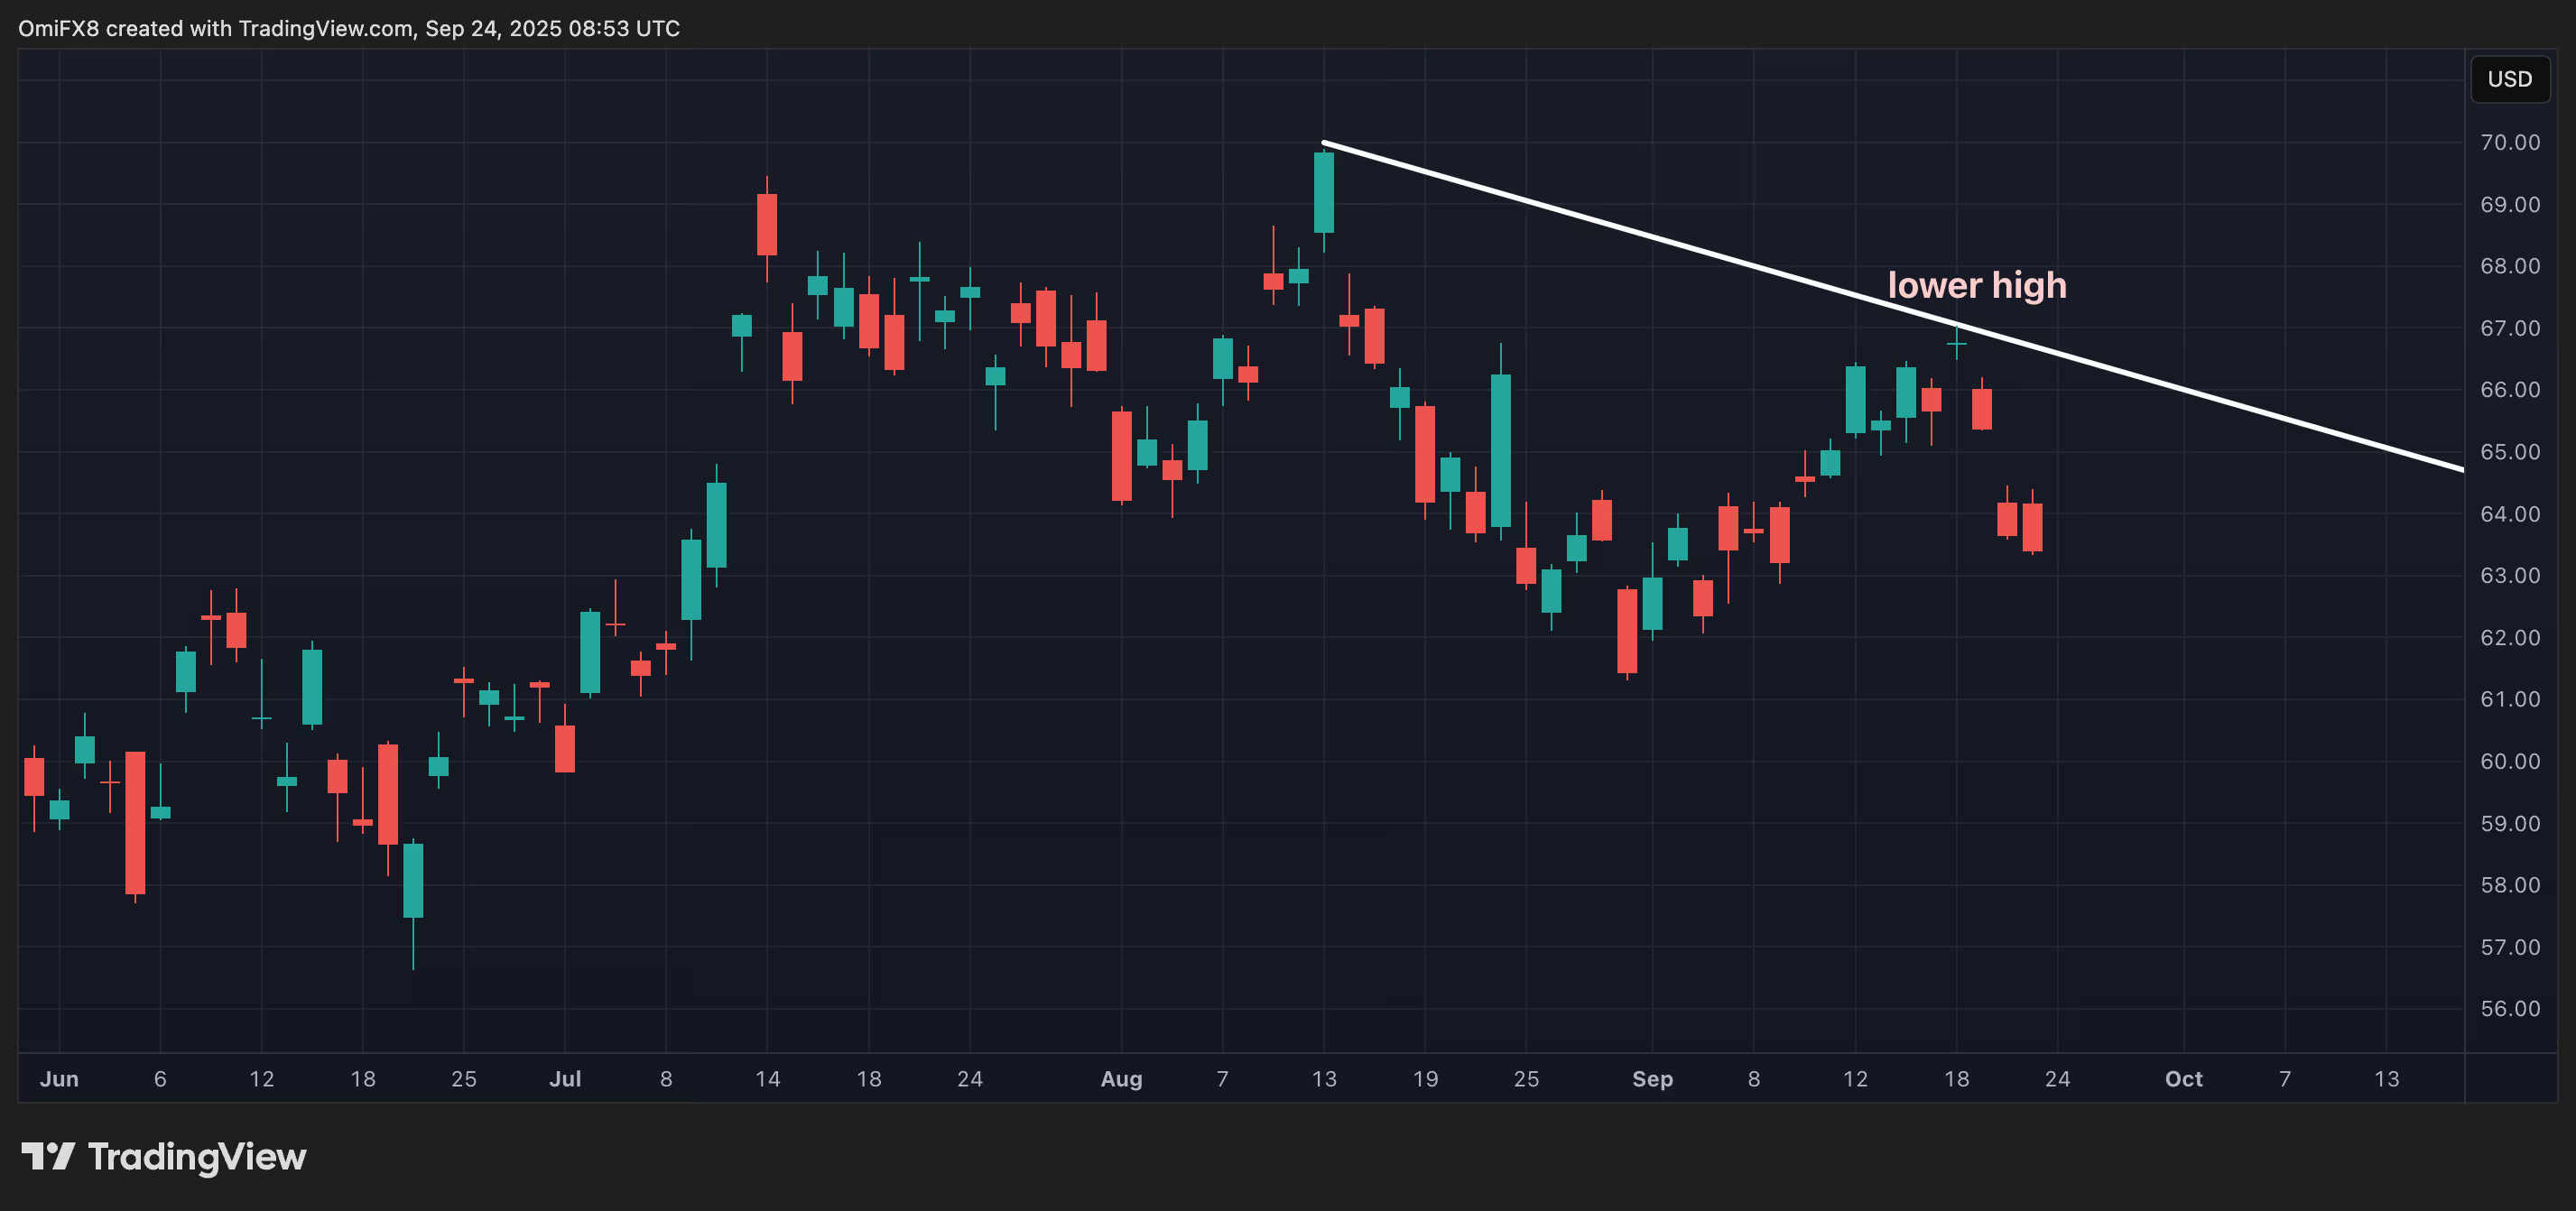
IBIT’s uptrend has stalled
IBIT’s price trend has stalled since July, failing multiple times to rise above the $70 level. Recently, it formed a “lower high” at $66, meaning the recent peak price was lower than the previous high near $70.
This pattern signals weakening buying pressure and suggests that sellers are gaining strength. The formation of lower highs often indicates a potential downtrend or bearish momentum.