S&P 500 — US Large Cap Index
 FTSE 100 — UK Blue Chips
 Euro Stoxx 50 — Eurozone Leaders
 DAX 40 — German Equities
 CAC 40 — French Market Index
 Nikkei 225 — Japan Benchmark
 Hang Seng — Hong Kong Index
 Shanghai Composite — China Mainland
 ASX 200 — Australian Market
 TSX Composite — Canada Index
 Nifty 50 — India Large Cap
 STI Index — Singapore Market
 KOSPI — South Korea Index
 Bovespa — Brazil Equities
 JSE Top 40 — South Africa Index
 IPC Index — Mexico Market
Bitcoin, Ethereum, Ripple – BTC, ETH and XRP enter the New Year with breakout hopes

- Bitcoin price has been sideways between $85,500 and $90,000 for nearly three weeks, signaling indecision in the market.
- Ethereum approaches its 50-day EMA at $3,110, a firm close above this level could trigger a rally.
- XRP trades around $1.87, and a decisive close above $1.96 would support further upside.
Bitcoin (BTC), Ethereum (ETH), and Ripple (XRP) entered the new year trading at key technical levels on Friday, as traders seek fresh directional cues in January. With BTC locked in a tight range, ETH is approaching its 50-day Exponential Moving Average (EMA), while XRP is nearing resistance. A clear breakout across these top three cryptocurrencies could help define market momentum in the opening weeks of the year.
Bitcoin lacks direction as consolidation extends into the New Year
Bitcoin price has been consolidating between $85,500 and $90,000 for nearly three weeks, indicating indecision in the market. As of Friday, BTC hovers around $88,400.
If BTC breaks and closes above the $90,000 on a daily basis, it could extend the rally toward the next resistance at $94,253.
The Relative Strength Index (RSI) on the daily chart is at 48, near the neutral 50 level, indicating fading bearish momentum. For the bullish momentum to be sustained, the RSI must move above the neutral level. Meanwhile, the Moving Average Convergence Divergence (MACD) indicator showed a bullish crossover, which remains intact, supporting a slightly bullish view.
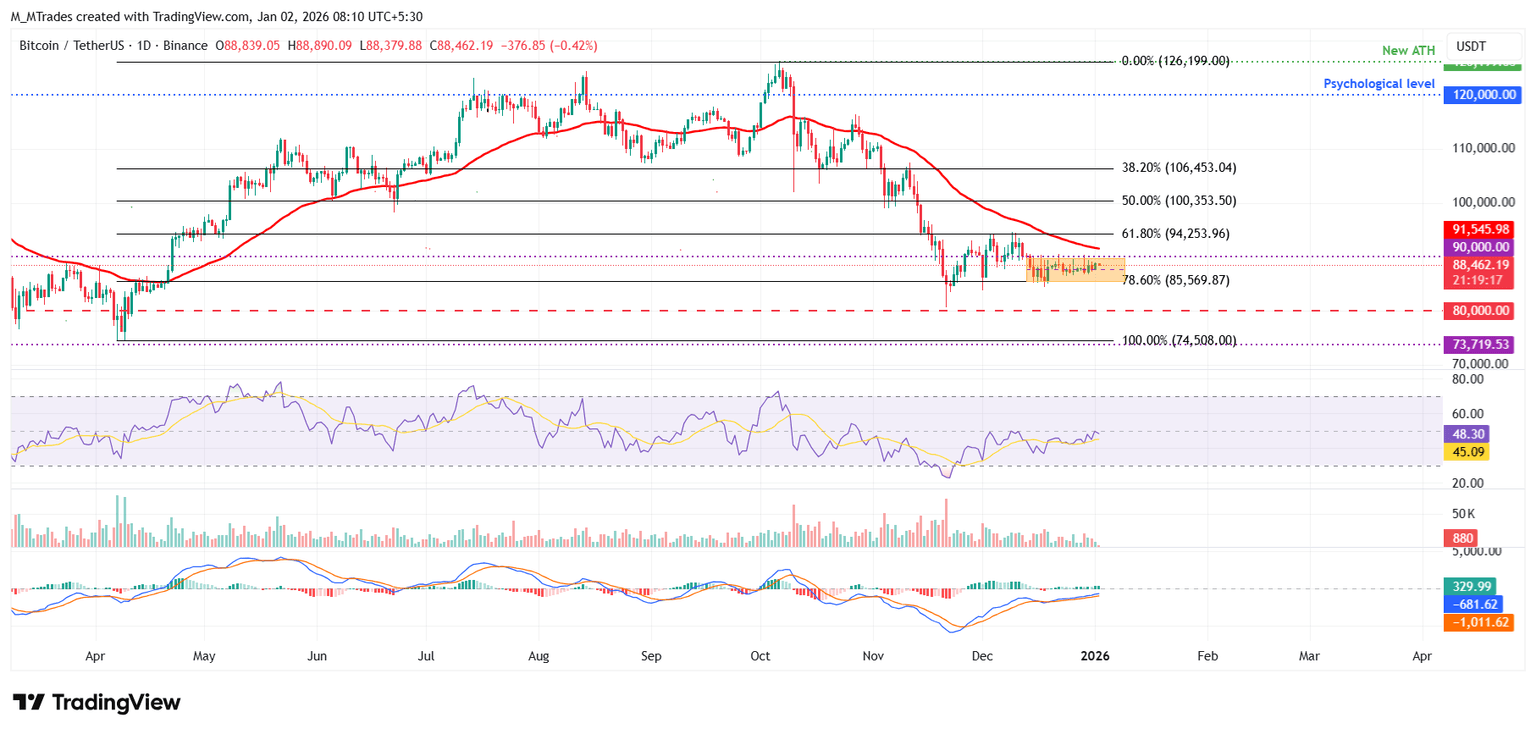
However, if BTC corrects, it could extend the decline toward the lower consolidation boundary at around $85,500.
Ethereum could rally if it closes above the 50-day EMA
Ethereum price found support around the previously broken descending trendline on December 19 and consolidated around the daily resistance level at $3,017 for the next 12 days. As of Friday, ETH hovers near this resistance level.
If ETH breaks above the $3,017 resistance level and closes above the 50-day EMA at $3,110, it could extend the rally toward the December 10 high of $3,447.
The RSI on the daily chart is flattening near the neutral 50 level, signaling indecision among traders. However, like Bitcoin, Ethereum’s MACD indicator also showed a bullish crossover, which remains intact, supporting a slightly bullish view.
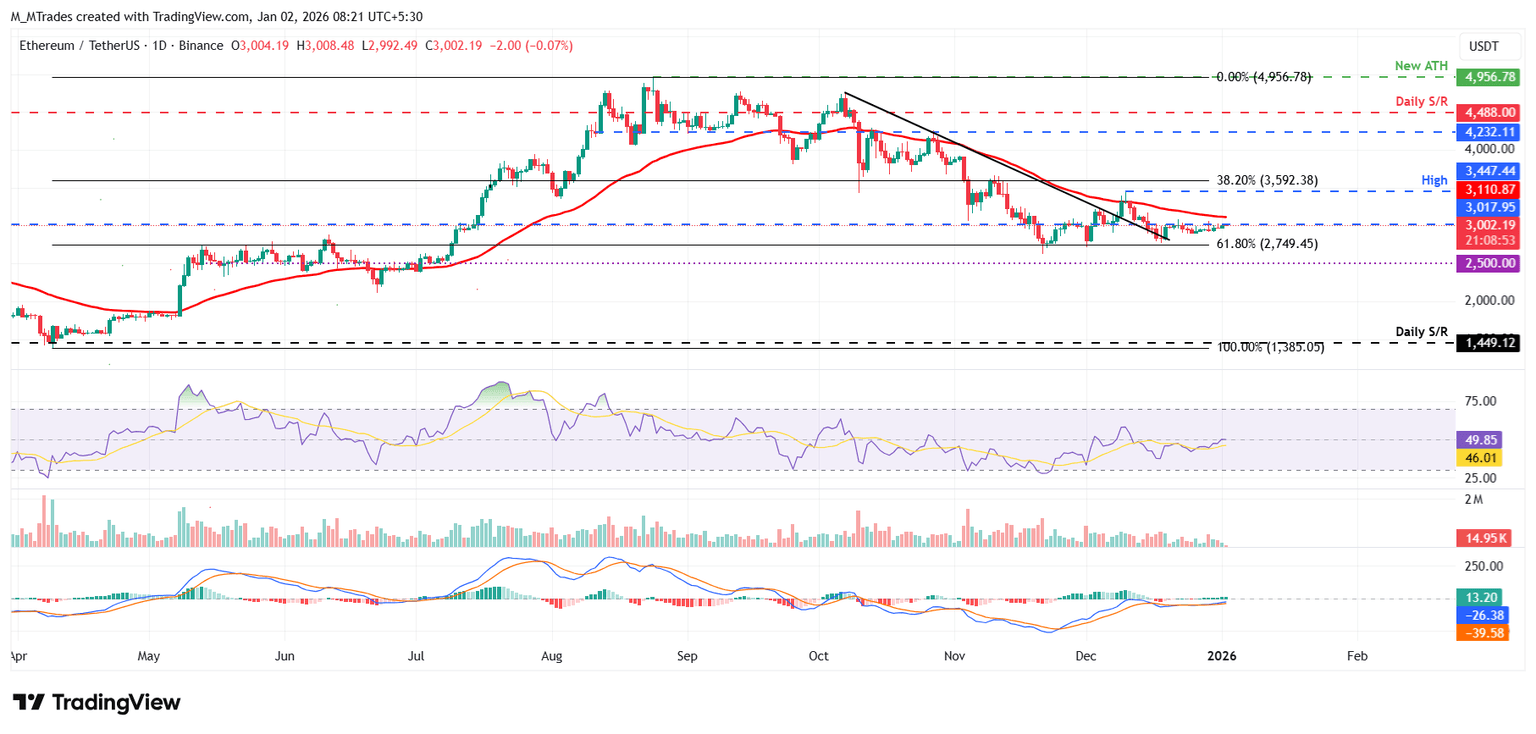
However, if ETH faces a pullback, it could extend the decline toward the key support at $2,749.
XRP momentum indicators show signs of improvement
XRP price was retested and rejected near the daily resistance at $1.96 on December 21, triggering a 5.6% decline over the following three days. It has since been consolidating around $1.80 for nearly a week. As of Friday, it hovers around $1.87.
If XRP breaks and closes above the daily resistance at $1.96, it could extend the rally toward the next key resistance at $2.35.
The RSI on the daily chart is at 43, pointing upward toward its neutral level of 50, indicating fading bearish momentum. For the bullish momentum to be sustained, the RSI must move above the neutral level. Meanwhile, the MACD indicator showed a bullish crossover, which remains intact, supporting a slightly bullish view.
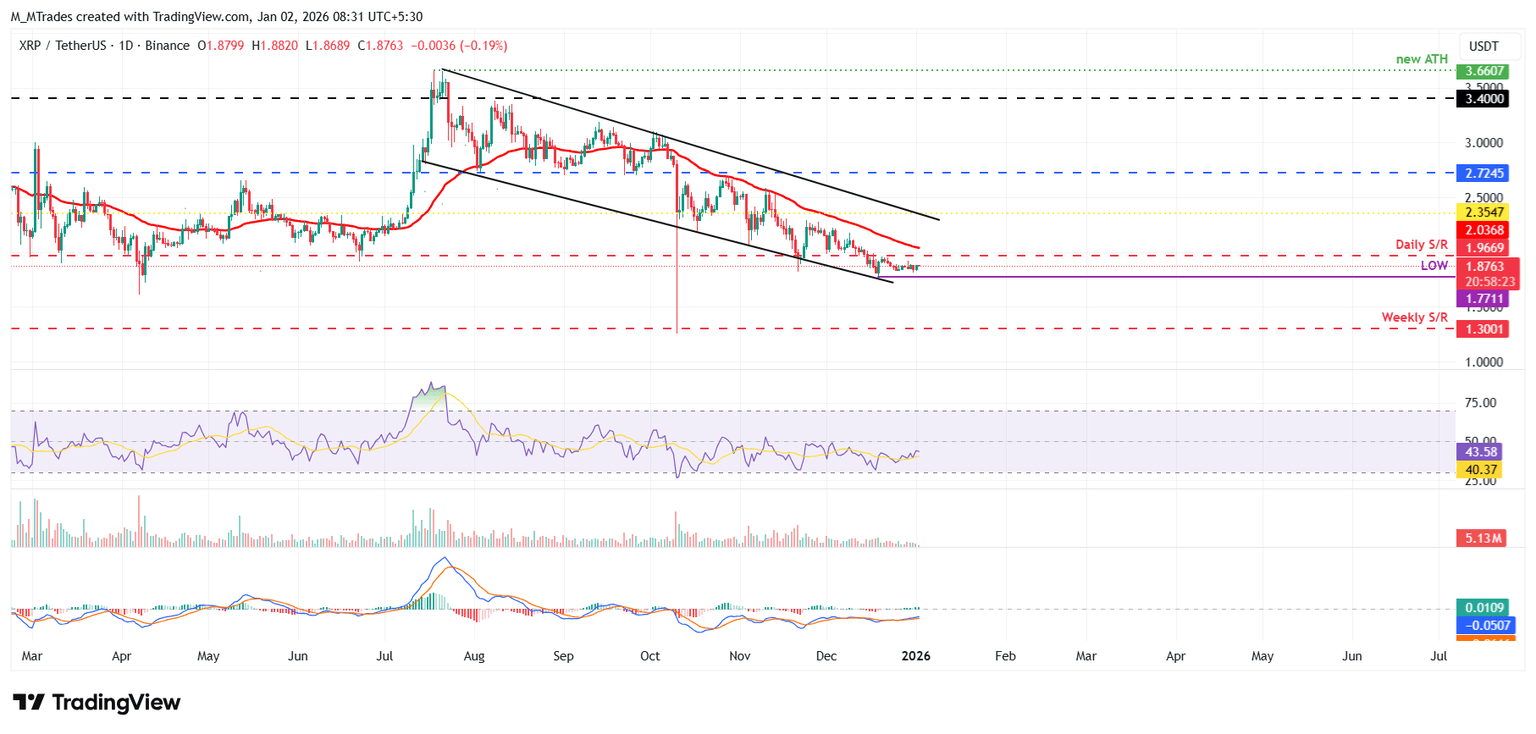
However, if XRP faces a correction, it could extend the decline toward the December 19 low of $1.77.