S&P 500 — US Large Cap Index
 FTSE 100 — UK Blue Chips
 Euro Stoxx 50 — Eurozone Leaders
 DAX 40 — German Equities
 CAC 40 — French Market Index
 Nikkei 225 — Japan Benchmark
 Hang Seng — Hong Kong Index
 Shanghai Composite — China Mainland
 ASX 200 — Australian Market
 TSX Composite — Canada Index
 Nifty 50 — India Large Cap
 STI Index — Singapore Market
 KOSPI — South Korea Index
 Bovespa — Brazil Equities
 JSE Top 40 — South Africa Index
 IPC Index — Mexico Market
Ethereum Weekly Price – Profit-taking slows rally as network activity lags


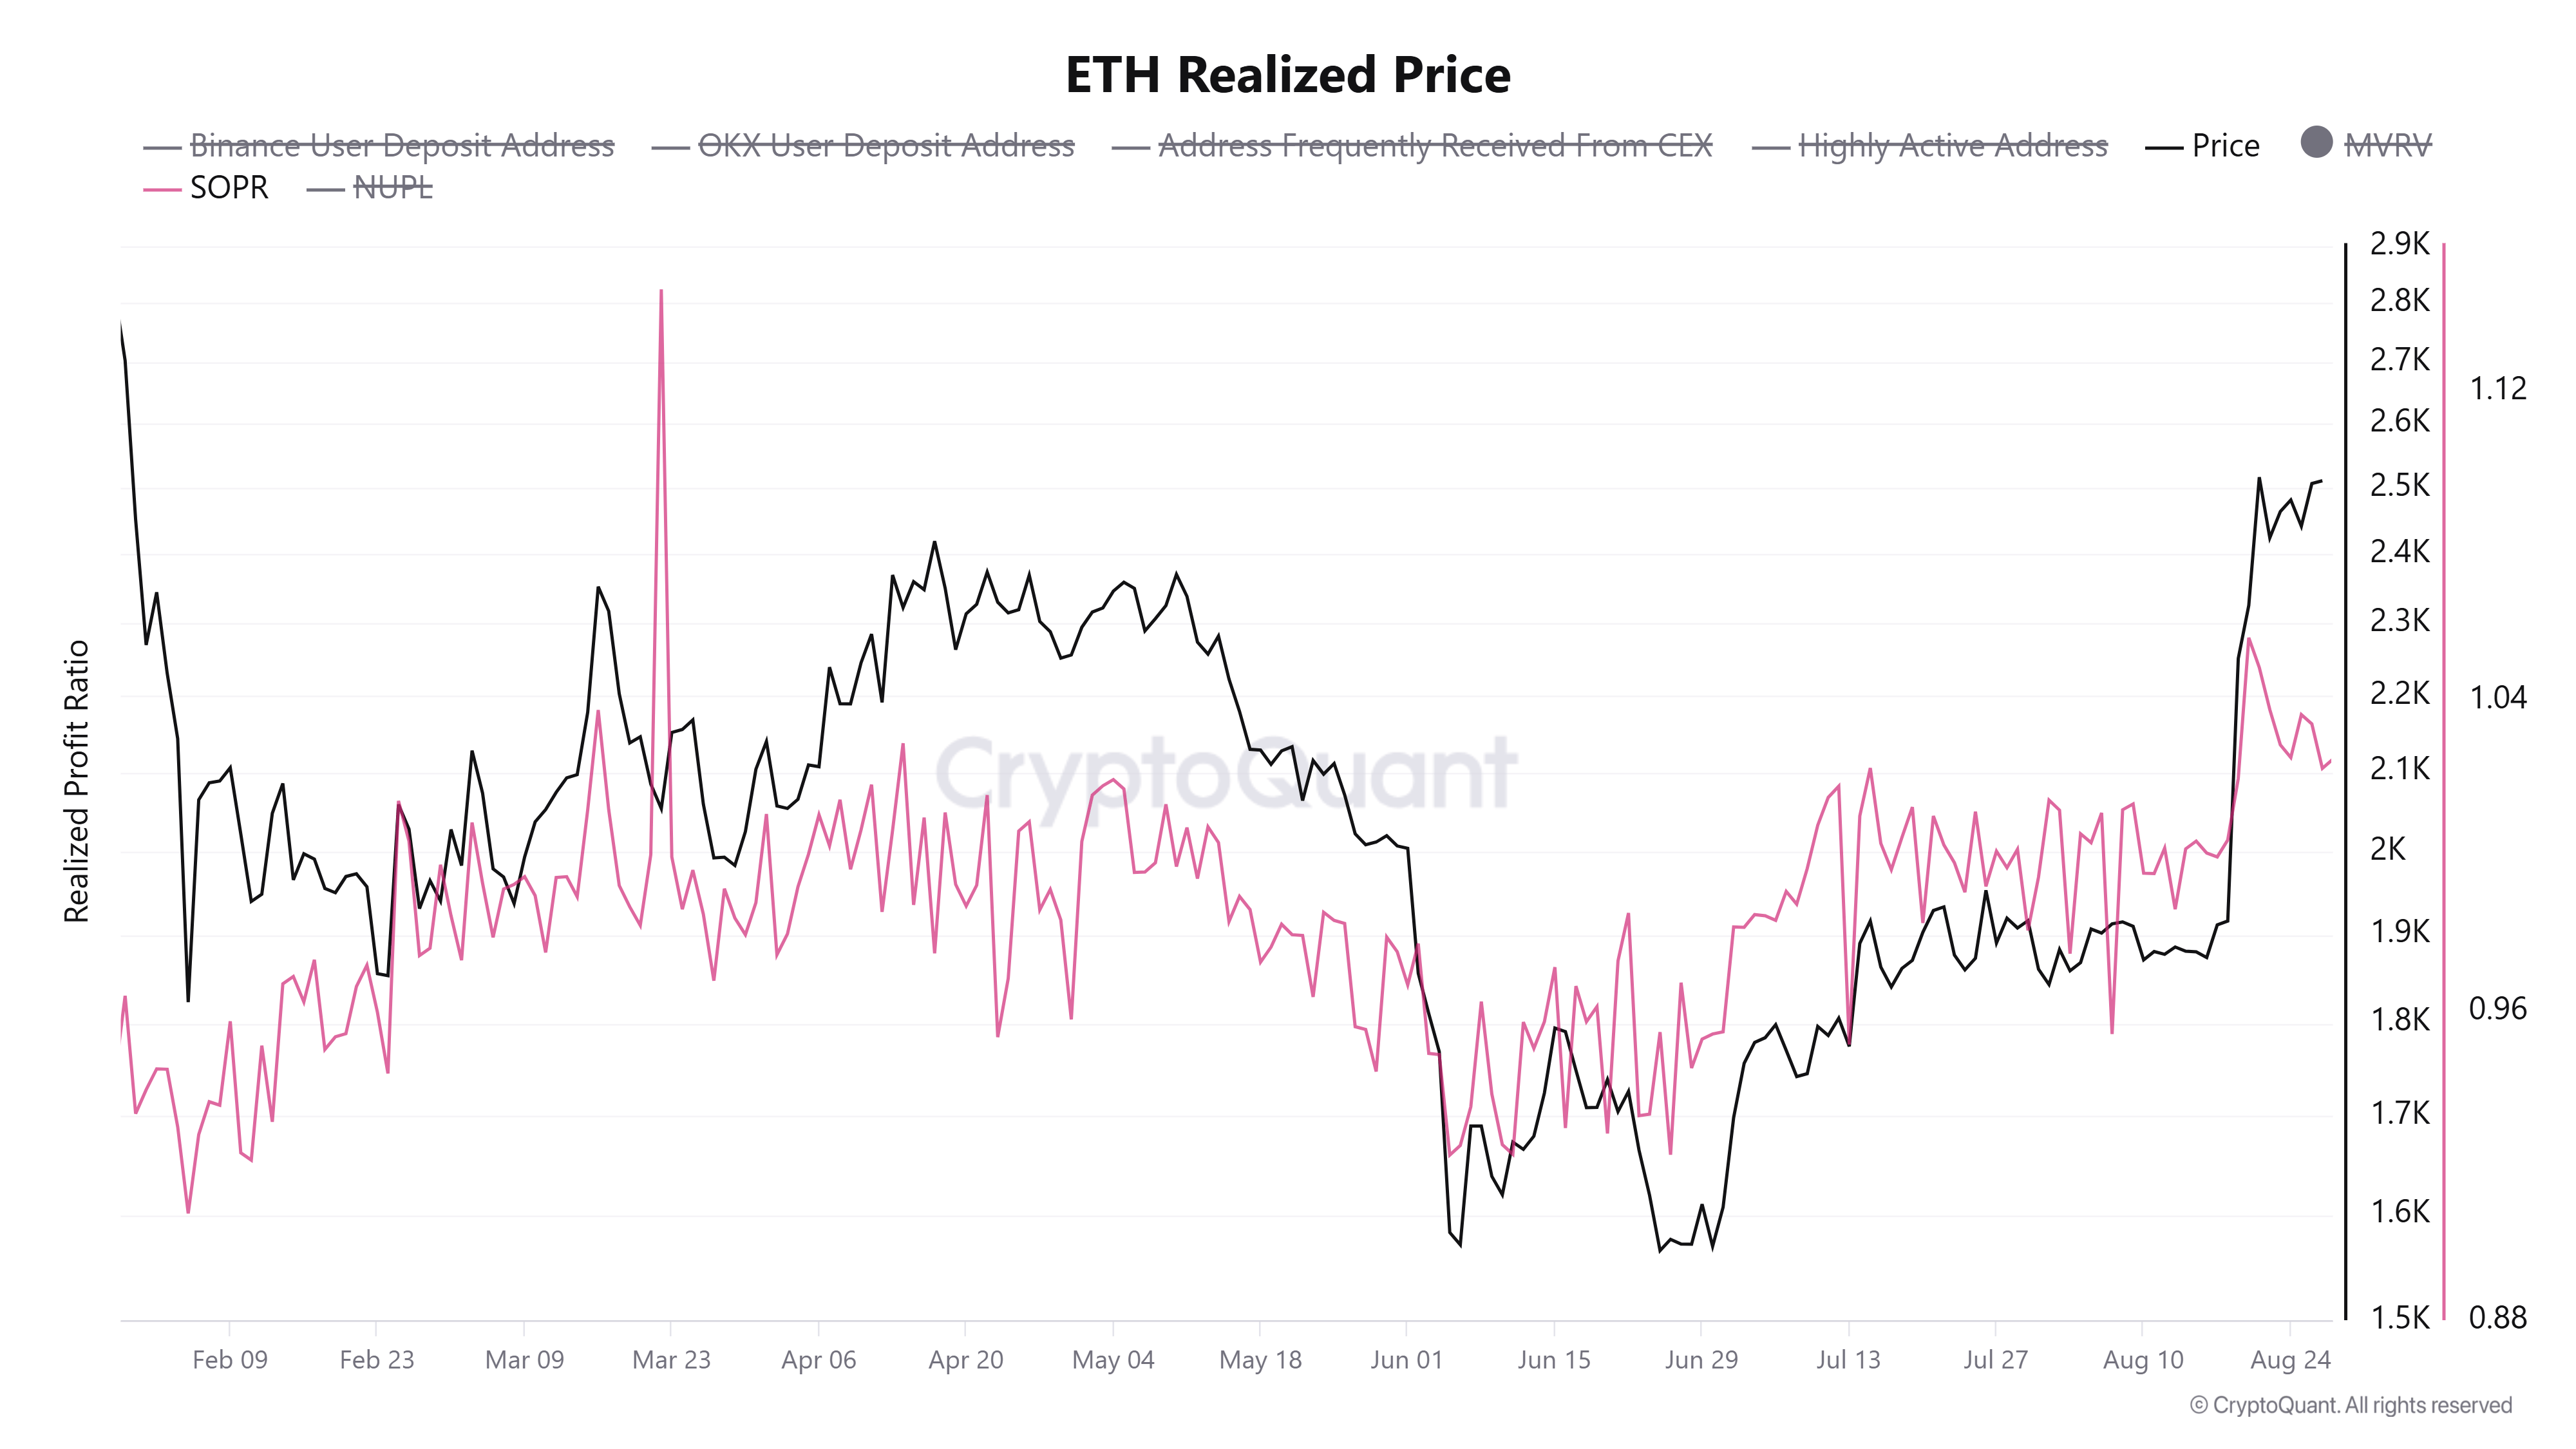
- Ethereum’s rally slowed near $2,500 as profit-taking followed ETH’s move above investors’ realized price of $2,306.
- US spot Ethereum ETFs attracted $234.51 million on Thursday, extending their net-inflow streak to nine consecutive trading days.
- ETH revisits $2,431 support, which has held prices over the past week.
Ethereum (ETH) has held firmly above $2,400 and traded near $2,500 this week after a sharp rally last week. However, upward momentum has slowed as investors appear to be taking profits after ETH moved above its average on-chain cost basis.
The move above investors’ realized price at $2,306 may have unlocked selling pressure from holders who were previously underwater and are now taking modest gains. The development aligns with earlier signs of increased exchange inflows after Ethereum recovered above this range.
Onchain profitability data also points to increased profit-taking. Ethereum’s Spent Output Profit Ratio (SOPR) has remained above 1 over the past week, indicating that, on average, ETH moved on-chain during the period was sold at a profit.
ETF inflows and stablecoin expansion provide support
Despite higher profit-taking, broader liquidity conditions remain supportive. Continued growth in the stablecoin market has injected fresh liquidity into the crypto market, with inflows crossing $4.1 billion over the past two weeks, per DefiLlama data.
Meanwhile, US Spot Ethereum exchange-traded funds (ETFs) pulled in $234.51 million on Thursday, extending their inflow streak to nine consecutive trading days, according to SoSoValue data. The run lifted weekly inflows to $722.24 million, the strongest weekly total for Ethereum funds in roughly ten months and matching momentum last seen in October. This underscores sustained institutional demand for Ethereum exposure.
However, derivatives activity has yet to support the rally. Open interest has failed to recover meaningfully following the recent leverage flush and major short-liquidation event. The decline in open interest after the short squeeze has not been followed by significant new long positioning, suggesting that leveraged traders remain cautious.
The absence of substantial new leveraged demand could limit Ethereum’s ability to extend its rally in the near term.
Onchain network activity has also remained subdued despite ETH’s recent price gains. Both transaction counts and active addresses have declined over the past week, suggesting underlying network usage has yet to confirm the upward price move.
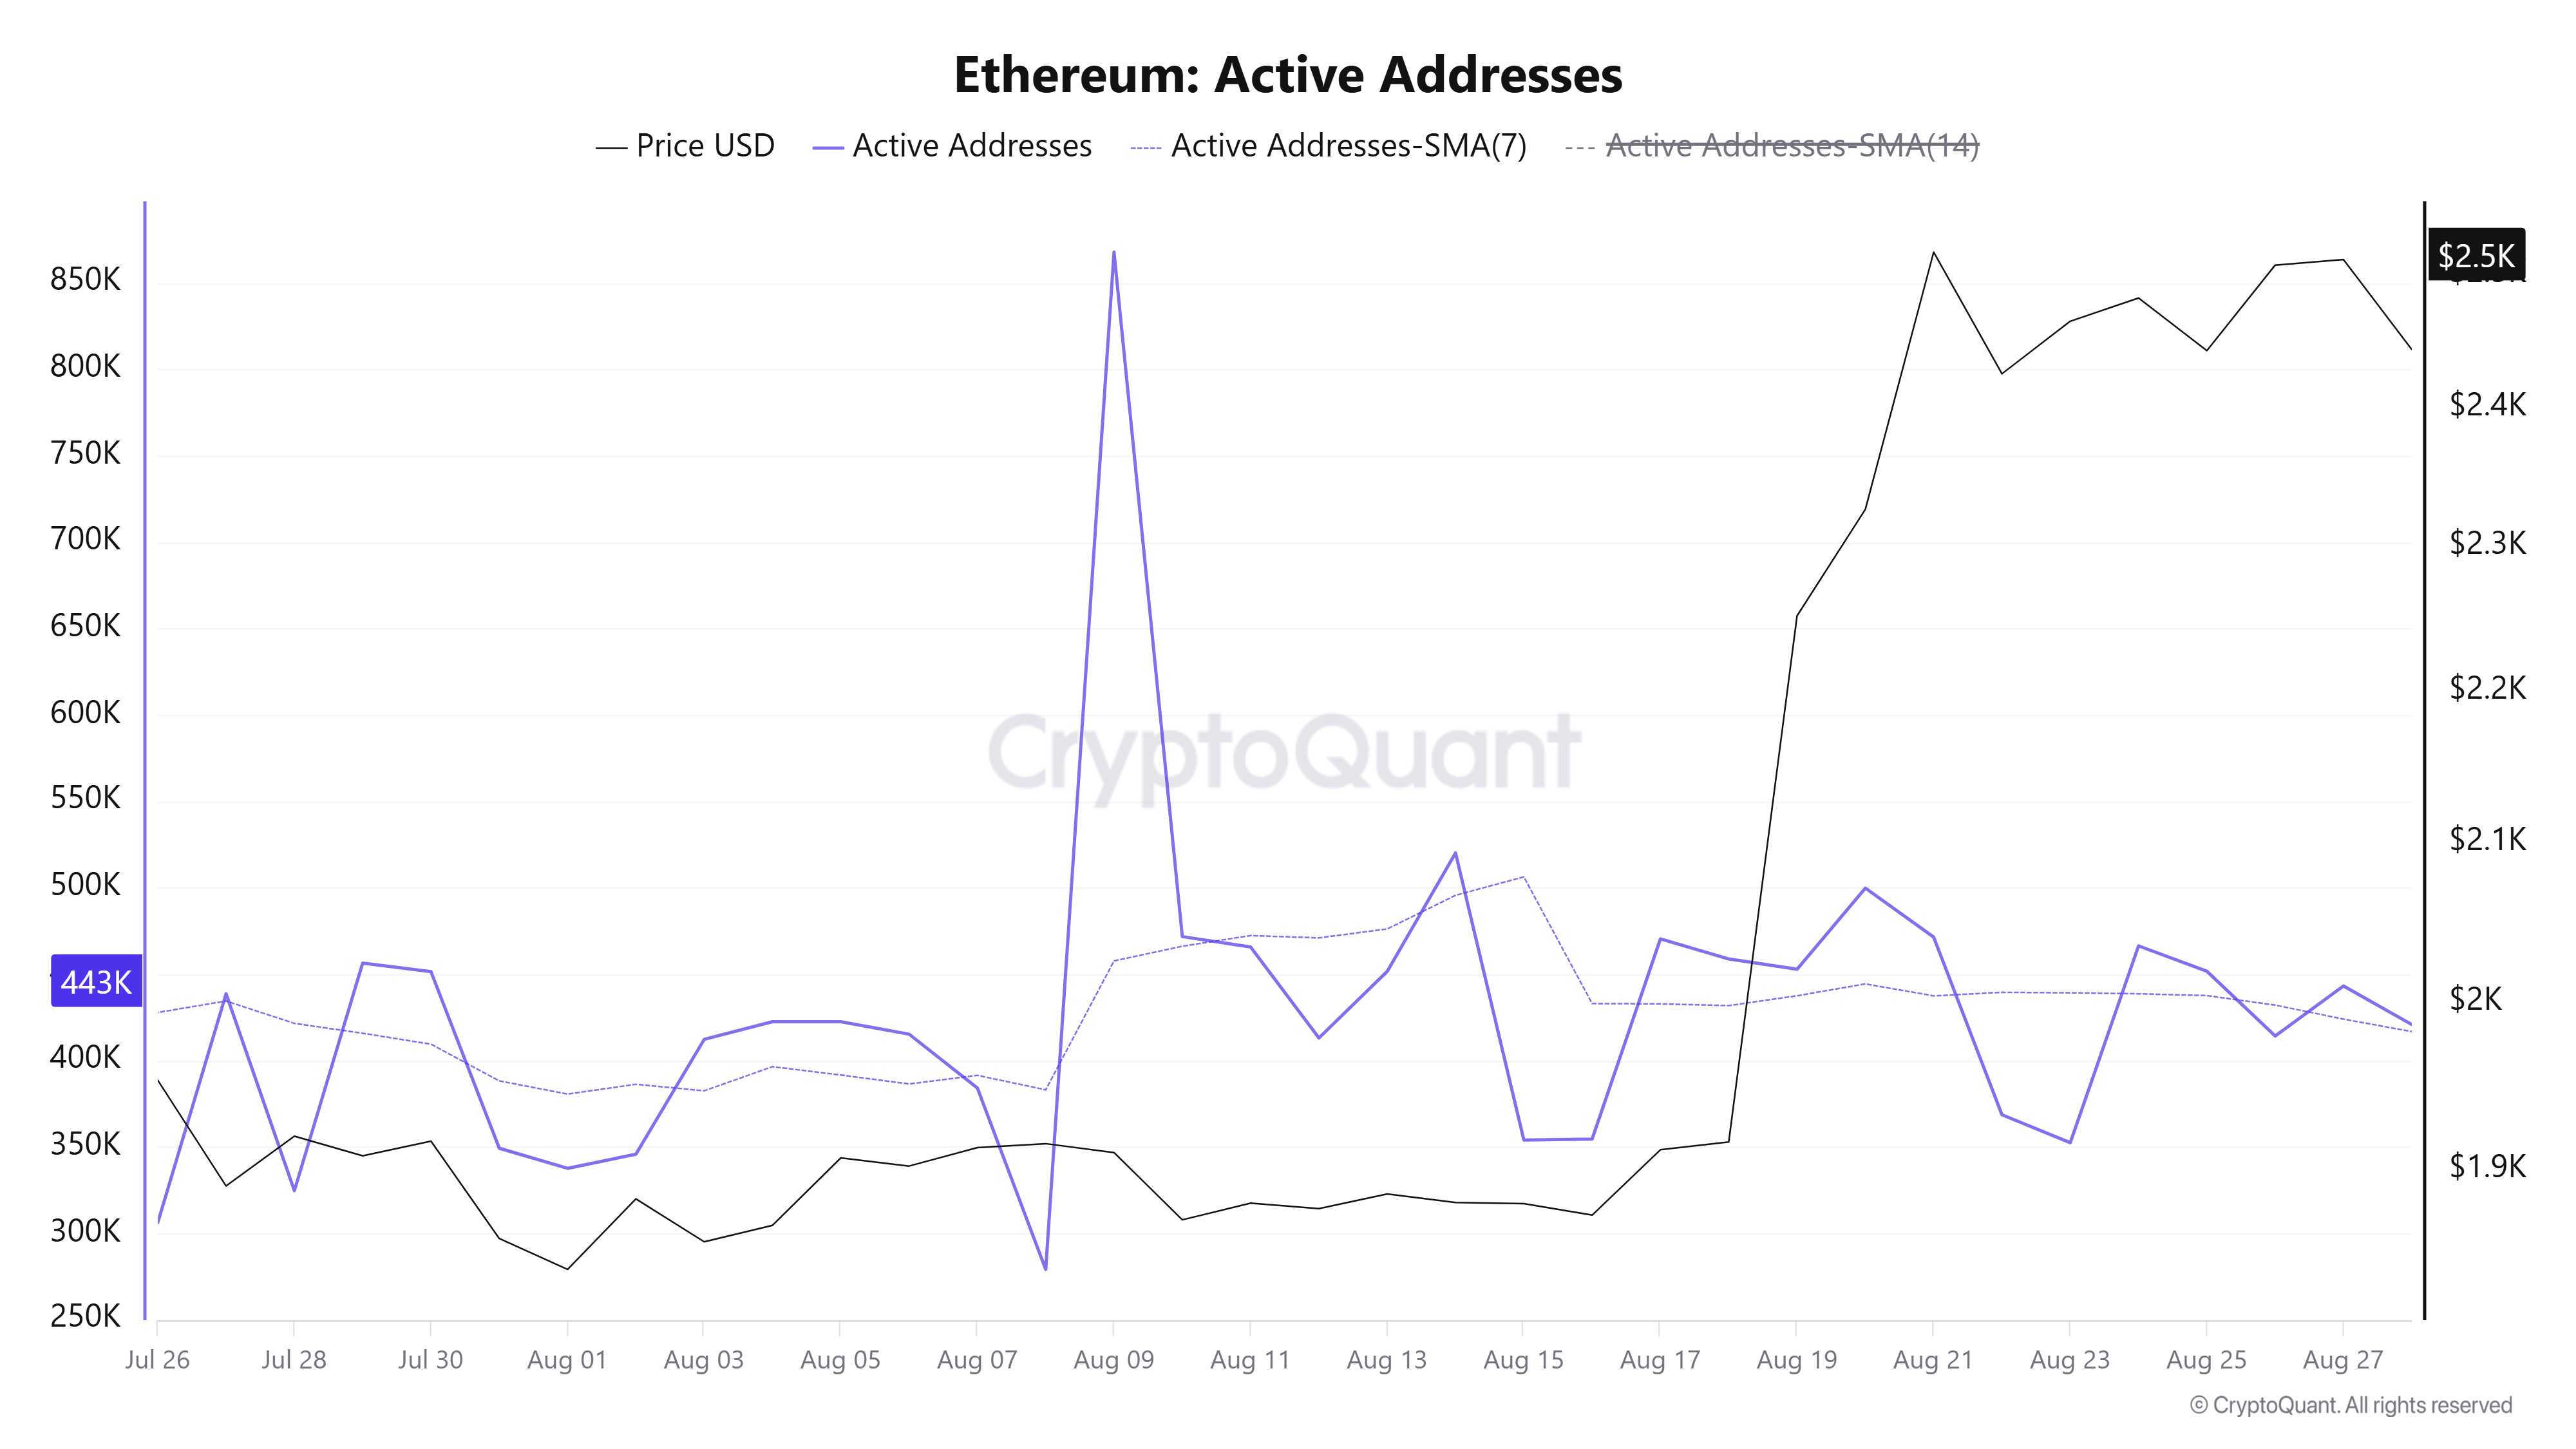
For Ethereum to sustain the rally, open interest will need to recover alongside a clear rebound in transaction activity and active addresses.
Ethereum Price Forecast: ETH retests $2,431 support
Ethereum recorded $97.3 million in liquidations over the past 24 hours, led by $75.8 million in long liquidations, according to Coinglass data.
On the daily chart, ETH is holding a bullish near-term bias as it extends above its key Exponential Moving Averages (EMAs). The 20-day EMA at $2,261, along with the 50-, 100- and 200-day EMAs clustered between roughly $2,073 and $2,156, sits below price and suggests a well-supported uptrend.
Momentum is strong, with the 14-day Relative Strength Index (RSI) hovering just under the overbought threshold at 69 and the Stochastic Oscillator (Stoch) elevated at 81, indicating bullish pressure persists as the rally becomes stretched in the short term.
On the downside, immediate support is seen near the recent horizontal pivot at $2,431, which has held prices over the past week, followed by the 20-day EMA and prior structural floors at $2,172 and $1,961. Deeper pullbacks would expose the broader support band defined by the long-term EMAs between $2,021 and $2,156. Below that are the previous swing bases at $1,809, $1,701 and $1,507.

On the topside, initial resistance is located at the horizontal cap near $2,680, ahead of a more significant barrier at $2,879. A pause or corrective consolidation would be likely if overbought conditions intensify.