S&P 500 — US Large Cap Index
 FTSE 100 — UK Blue Chips
 Euro Stoxx 50 — Eurozone Leaders
 DAX 40 — German Equities
 CAC 40 — French Market Index
 Nikkei 225 — Japan Benchmark
 Hang Seng — Hong Kong Index
 Shanghai Composite — China Mainland
 ASX 200 — Australian Market
 TSX Composite — Canada Index
 Nifty 50 — India Large Cap
 STI Index — Singapore Market
 KOSPI — South Korea Index
 Bovespa — Brazil Equities
 JSE Top 40 — South Africa Index
 IPC Index — Mexico Market
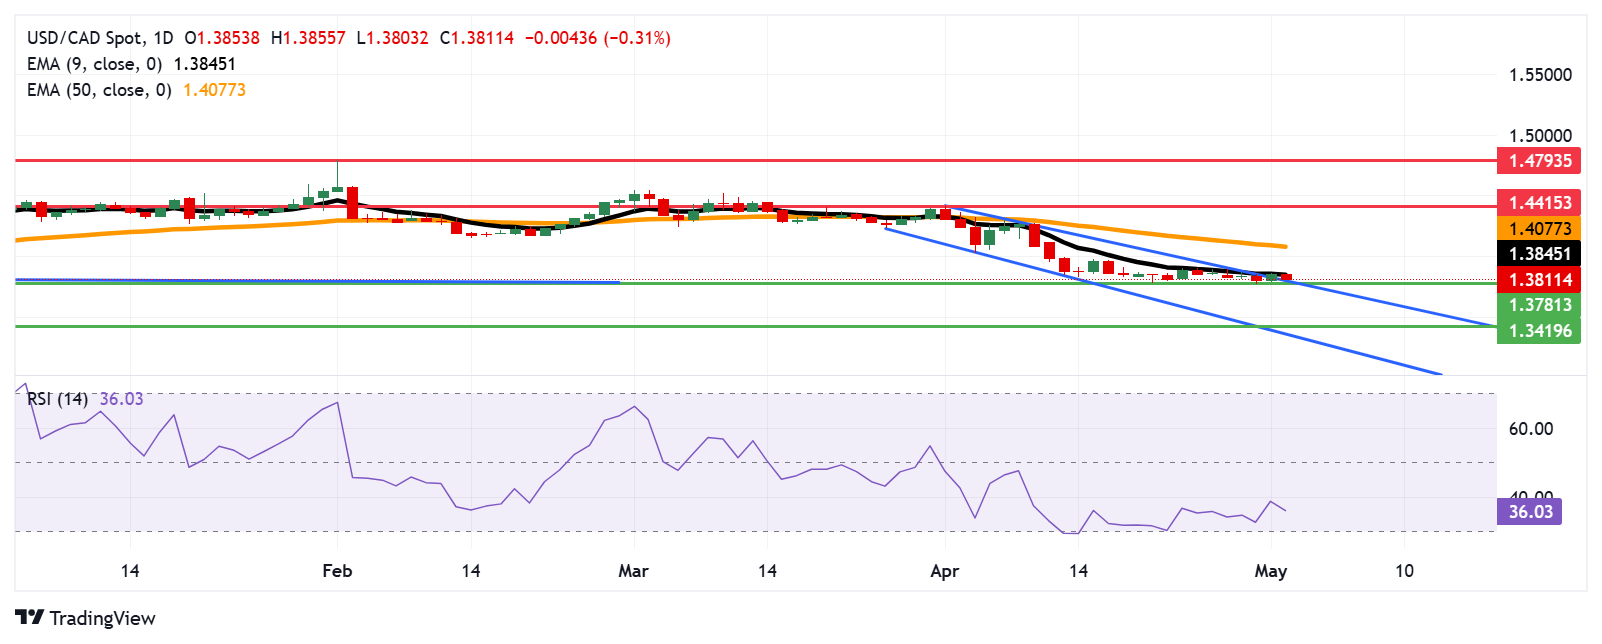
- The USD/CAD pair could retest the barrier at the six-month low of 1.3781.
- The pair is testing the psychological level of 1.3800, followed by the six-month low of 1.3781.
- A break above the nine-day EMA of 1.3845 could improve the short-term price momentum.
The USD/CAD pair retraces its gains registered in the previous session, trading around 1.3810 during the early European hours on Friday. However, technical analysis on the daily chart suggests a potential bullish shift in market sentiment, as the pair attempts to break above the descending channel pattern.
Additionally, the 14-day Relative Strength Index (RSI) remains above the 30 mark, indicating a continued bearish bias, though not in oversold territory. Further price action will provide clearer trend direction. The USD/CAD pair also continues to trade below the nine-day Exponential Moving Average (EMA), signaling weak short-term momentum.
On the downside, the USD/CAD pair is testing the psychological level of 1.3800, followed by the six-month low of 1.3781, last touched on April 21, which is aligned with the upper boundary of the descending channel. A decisive return to the channel would revive the bearish bias and put the downward pressure on the pair to navigate the region around the 1.3419 — its lowest point since February 2024, with additional support seen around the descending channel’s lower boundary near the 1.33.50 area.
The USD/CAD pair may find an initial barrier at the nine-day EMA of 1.3845. A break above this crucial resistance zone would improve the short-term price momentum and would signal a shift toward a bullish bias, paving the way for a move toward the 50-day EMA at 1.4077, followed by a two-month high at 1.4415. Further gains could target the next major resistance at 1.4793 — the lowest level observed since April 2003.
USD/CAD: Daily Chart
Canadian Dollar PRICE Today
The table below shows the percentage change of Canadian Dollar (CAD) against listed major currencies today. Canadian Dollar was the strongest against the US Dollar.
| USD | EUR | GBP | JPY | CAD | AUD | NZD | CHF | |
|---|---|---|---|---|---|---|---|---|
| USD | -0.32% | -0.27% | -0.16% | -0.31% | -0.54% | -0.57% | -0.22% | |
| EUR | 0.32% | 0.05% | 0.18% | 0.01% | -0.20% | -0.22% | 0.10% | |
| GBP | 0.27% | -0.05% | 0.14% | -0.04% | -0.25% | -0.27% | 0.05% | |
| JPY | 0.16% | -0.18% | -0.14% | -0.16% | -0.38% | -0.41% | -0.05% | |
| CAD | 0.31% | -0.01% | 0.04% | 0.16% | -0.24% | -0.24% | 0.09% | |
| AUD | 0.54% | 0.20% | 0.25% | 0.38% | 0.24% | -0.02% | 0.31% | |
| NZD | 0.57% | 0.22% | 0.27% | 0.41% | 0.24% | 0.02% | 0.33% | |
| CHF | 0.22% | -0.10% | -0.05% | 0.05% | -0.09% | -0.31% | -0.33% |
The heat map shows percentage changes of major currencies against each other. The base currency is picked from the left column, while the quote currency is picked from the top row. For example, if you pick the Canadian Dollar from the left column and move along the horizontal line to the US Dollar, the percentage change displayed in the box will represent CAD (base)/USD (quote).