S&P 500 — US Large Cap Index
 FTSE 100 — UK Blue Chips
 Euro Stoxx 50 — Eurozone Leaders
 DAX 40 — German Equities
 CAC 40 — French Market Index
 Nikkei 225 — Japan Benchmark
 Hang Seng — Hong Kong Index
 Shanghai Composite — China Mainland
 ASX 200 — Australian Market
 TSX Composite — Canada Index
 Nifty 50 — India Large Cap
 STI Index — Singapore Market
 KOSPI — South Korea Index
 Bovespa — Brazil Equities
 JSE Top 40 — South Africa Index
 IPC Index — Mexico Market
Chart of the Day – Oil Reacts to Trump’s Words Again. Real Drop or Just a Correction?


The oil market has once again demonstrated just how powerful—yet often short-lived—a catalyst Donald Trump’s words can be. Yesterday’s remarks claiming that the US is in the “final stages of talks” with Iran and negotiating with “far more reasonable” officials from Tehran instantly flipped market sentiment. This brought noticeable relief to investors and triggered a sharp drop in crude oil prices. However, the key question remains: is this actual progress or, just like every time before, merely an illusion of hope? Harsh reality hides behind the optimistic political rhetoric.
Today marks day 83 of the war, and the Strait of Hormuz, vital for global trade, has been blocked for 12 weeks now. Although Iran is sending signals about a slow resumption of traffic, independent data shows that shipping there has almost completely ground to a halt. Only a few smaller vessels or ships stranded in the region for weeks are passing through; Goldman Sachs points out that ship traffic is at just 5% of normal conditions. Furthermore, the US administration (including Vice President Vance) is tempering expectations, warning that the military is ready to resume strikes, to which Iran has responded with threats of escalating the conflict “beyond the region.” In this context, the temporary drop in oil prices driven by Trump’s comment collides with the hard, long-term forecasts of financial institutions and energy agencies for 2026.
Technical Analysis of WTI Crude
WTI crude fell sharply yesterday by over 5%, dropping from around $104.5 per barrel to levels below $99 per barrel . Today, the market awaits further cues from the Middle East.
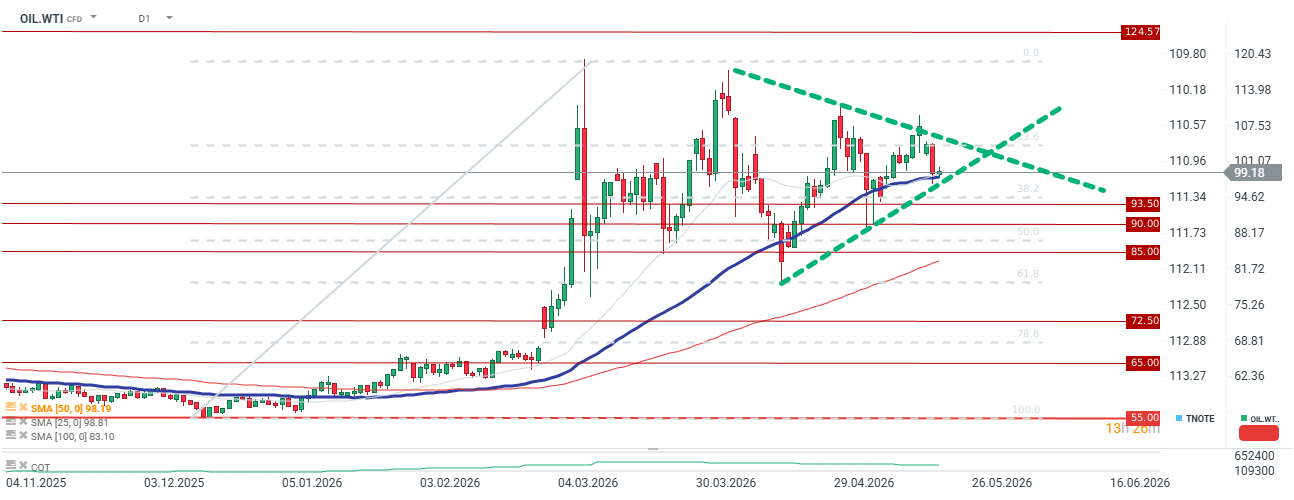
From a technical standpoint, it is worth noting that we are moving within a triangle pattern and are currently testing the lower boundary in the form of an upward trendline and the 25 SMA, which is holding oil back from steeper declines. Only a break below the $90–$93 per barrel zone could signal a genuine entry into a deeper correction. That being said, even if the Strait of Hormuz opens, the physical oil market will remain extremely tight, and prices will likely stay above $80 per barrel to keep stabilizing the market.
Expectations of Wall Street Giants:
Goldman Sachs and JPMorgan Leading investment banks view these political developments with a high degree of skepticism, maintaining their price forecasts at elevated levels due to a structural supply crisis.
- Goldman Sachs: At the end of April, the bank revised its forecasts for the fourth quarter of 2026, raising the expected price for Brent crude to $90 per barrel and WTI to $83 per barrel (up from $83 and $78, respectively). The bank’s analysts pushed back their expectations for the normalization of traffic through the Strait of Hormuz to the end of June. Goldman emphasizes that the loss of approximately 14.5 million barrels per day (bpd) of Middle Eastern production capacity is generating a record drain on global inventories.
- JPMorgan: In its May report, the bank forecasts that Brent crude will average $96 per barrel in 2026 (estimating $103 in Q2, $104 in Q3, and a drop to $98 in Q4), while WTI is expected to average $89 . The bank’s experts note that while the market entered 2026 with high inventories, the ongoing blockade has completely changed the balance of power. They warn that if the conflict drags on, the primary channel impacting the economy will be extremely expensive refined products, leading to so-called demand destruction.
Official Agency Stance: IEA and EIA Reports (May 2026) Both the International Energy Agency (IEA) and the US government’s EIA confirm in their latest reports that the market is grappling with a historic supply shock. IEA (International Energy Agency): In its May report, the IEA estimates that global oil demand in 2026 will contract by 420,000 barrels per day (bpd) year-on-year (to a level of 104 million bpd). This is a staggering 1.3 million bpd lower than pre-outbreak forecasts. The drivers behind this are high prices, a deteriorating macroeconomic environment, and energy-saving programs. Meanwhile, global supply fell by another 1.8 million bpd in April, bringing total losses since February to 12.8 million bpd. The agency assumes the market will remain in a deep deficit until the final quarter of 2026, when (according to assumptions) traffic through the Strait of Hormuz will begin to slowly return to normal.
EIA (U.S. Energy Information Administration):
In the latest edition of its Short-Term Energy Outlook (STEO), the EIA drastically widened its global oil deficit forecast for 2026 . The agency now projects a deficit of 2.56 million bpd for the full year (compared to a forecast of just 0.30 million bpd a month earlier). The EIA anticipates a massive plunge in global inventories in the second quarter (by as much as 8.5 million bpd), which will keep Brent prices around $106 per barrel in May and June . The agency optimistically ass