
Key takeaways
- What is the technical outlook for EURUSD, USDCHF and USDCAD?
EURUSD EURUSD prices have recently broken below the 1:1 uptrend, whose lower boundary was at 1.1650. According to the Overbalance methodology, this paves the way for the downtrend to extend, potentially as far as the low at 1.1420. Conversely, for a return to an uptrend, the price would first need to move back above the 1.1650 level, and ideally also break through the 1.1720 level, where the upper limit of the local 1:1 downtrend pattern is located.
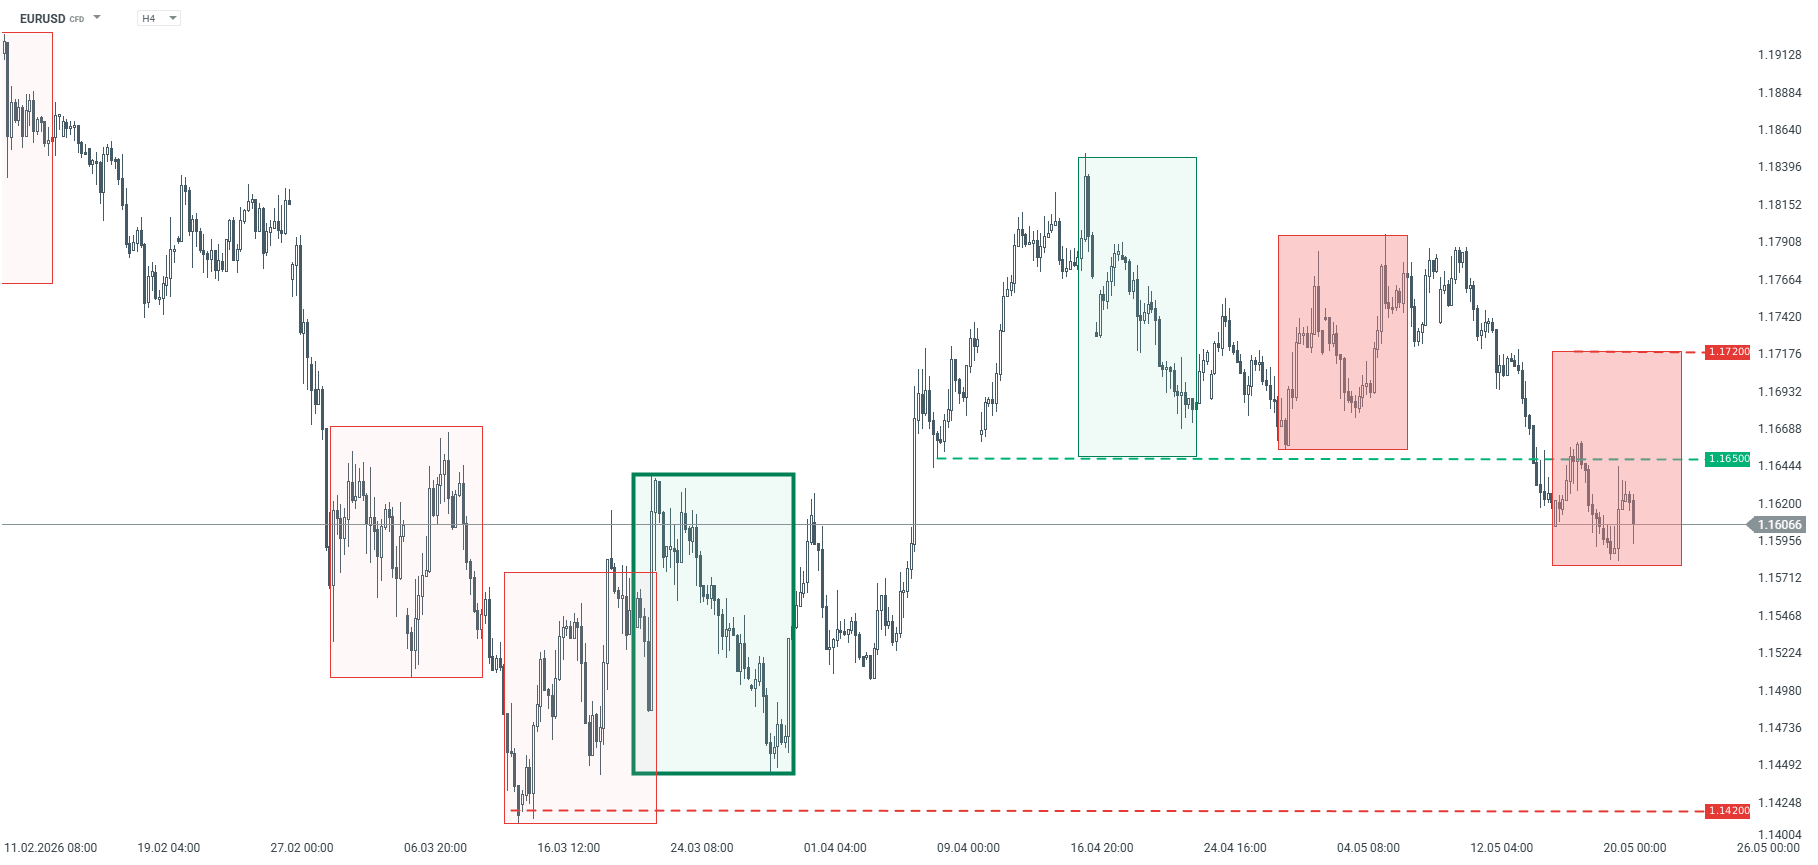
EURUSD – H4 chart. Source: xStation USDCHF The USDCHF remains in a long-term downtrend. The price rebounded from a key resistance level at the end of March, leading to a decline of nearly 300 pips. Currently, attention should be paid to a local descending geometric pattern, for which resistance is at the 0.7914 level. Should this level be breached, the price could continue to rise towards the next resistance level at 0.8035. Only a sustained break above this higher level would suggest a shift in the balance of power on the chart. For the time being, however, the base case scenario remains a downtrend.
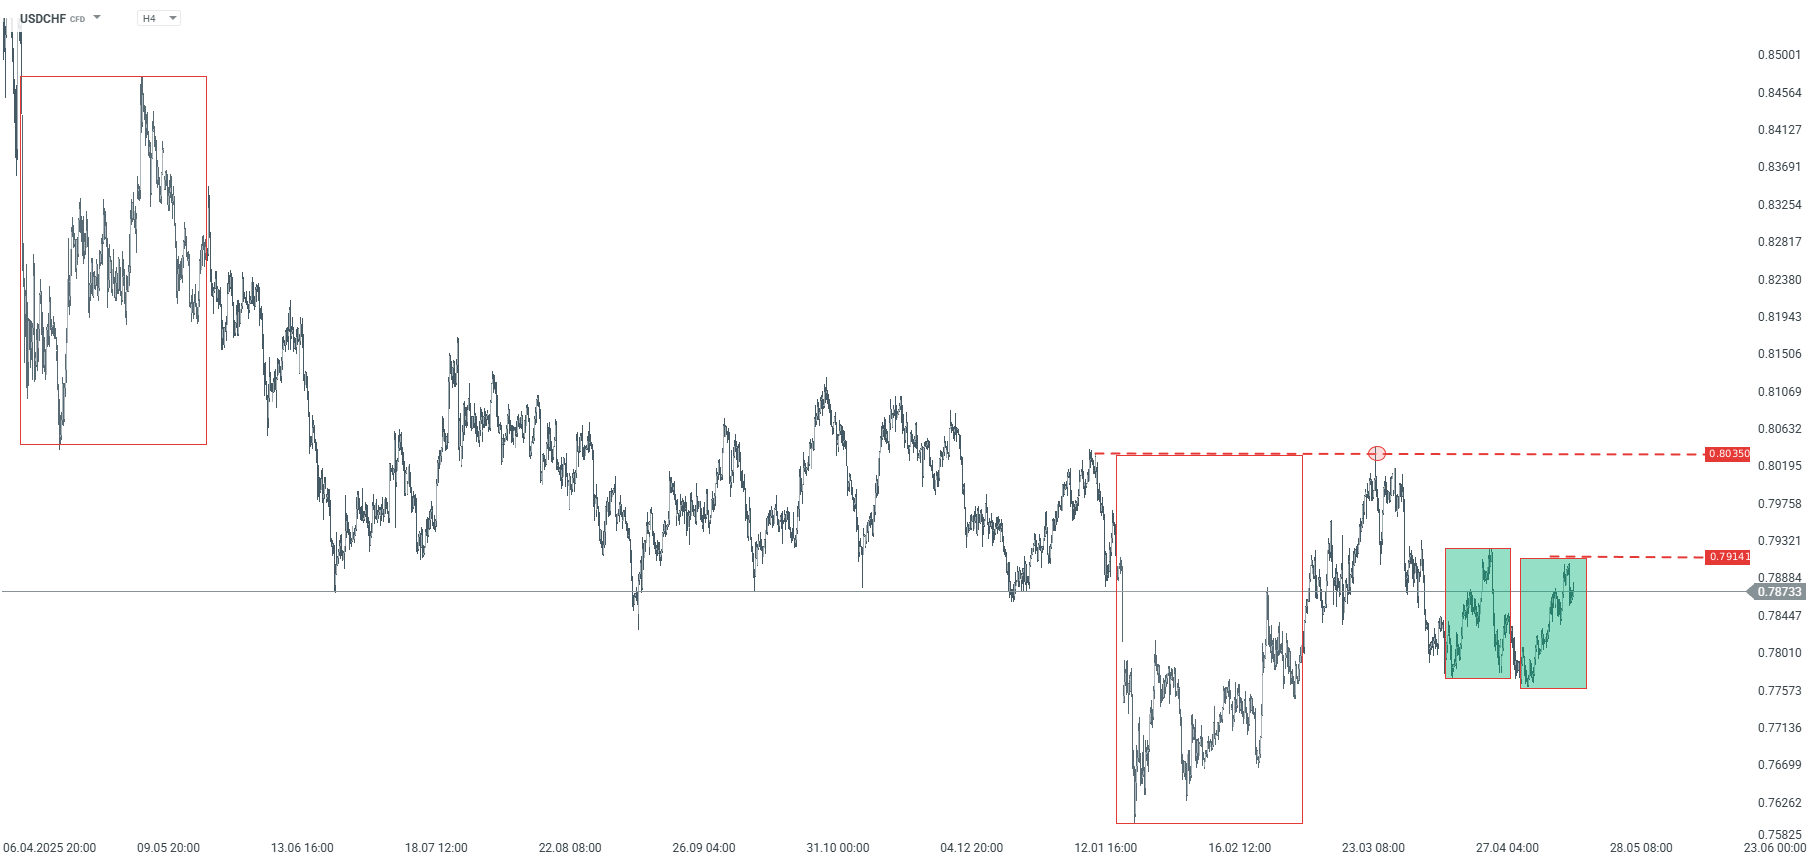
USDCHF – H4 chart. Source: xStation USDCAD The USDCAD pair shifted sentiment at the start of May, and since then we have seen a local uptrend, supported by a green 1:1 bullish pattern. Should a correction occur, the key support level remains at 1.3723. A break below this level could open the way for a decline towards 1.3630, where the polarity of the previously negated bearish pattern, marked in red, is located.
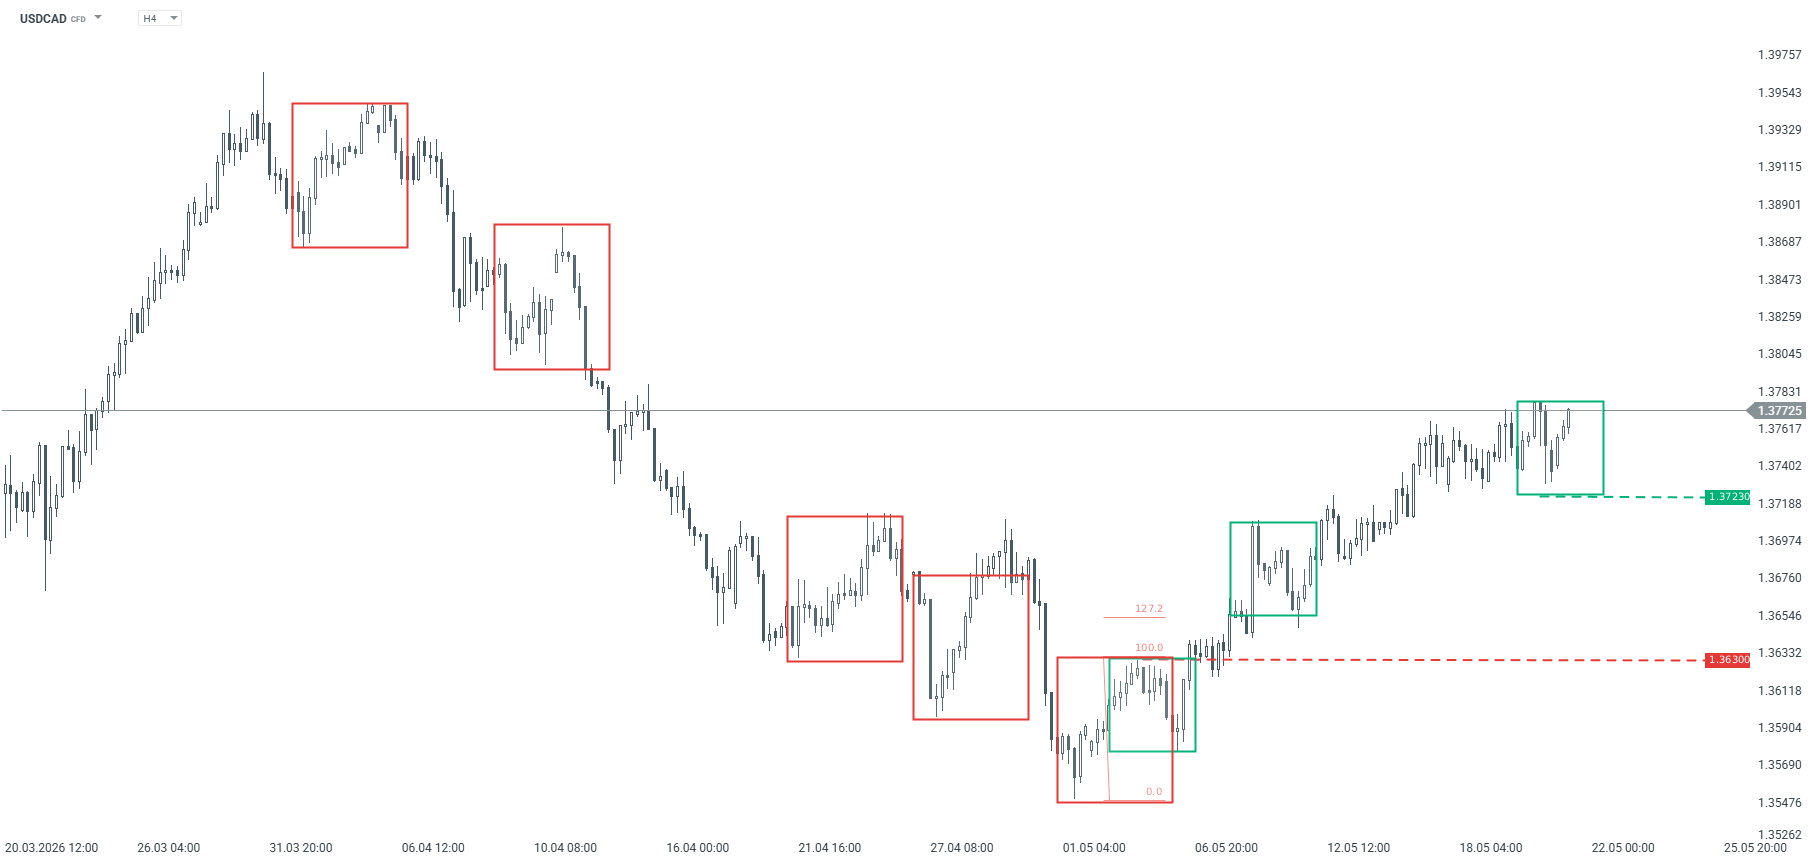
USDCAD – H4 timeframe. Source: xStation