
Facts:
- RSI (14) reached a level of 35,4 points.
- U.S. Vice President J.D. Vance stated in the media that negotiations with Iran “ended in failure.”
Recommendation:
- Trade: Long position on NATGAS at market price
- Take Profit: 3.5
- Stop Loss: 2.4
NATGAS (D1)
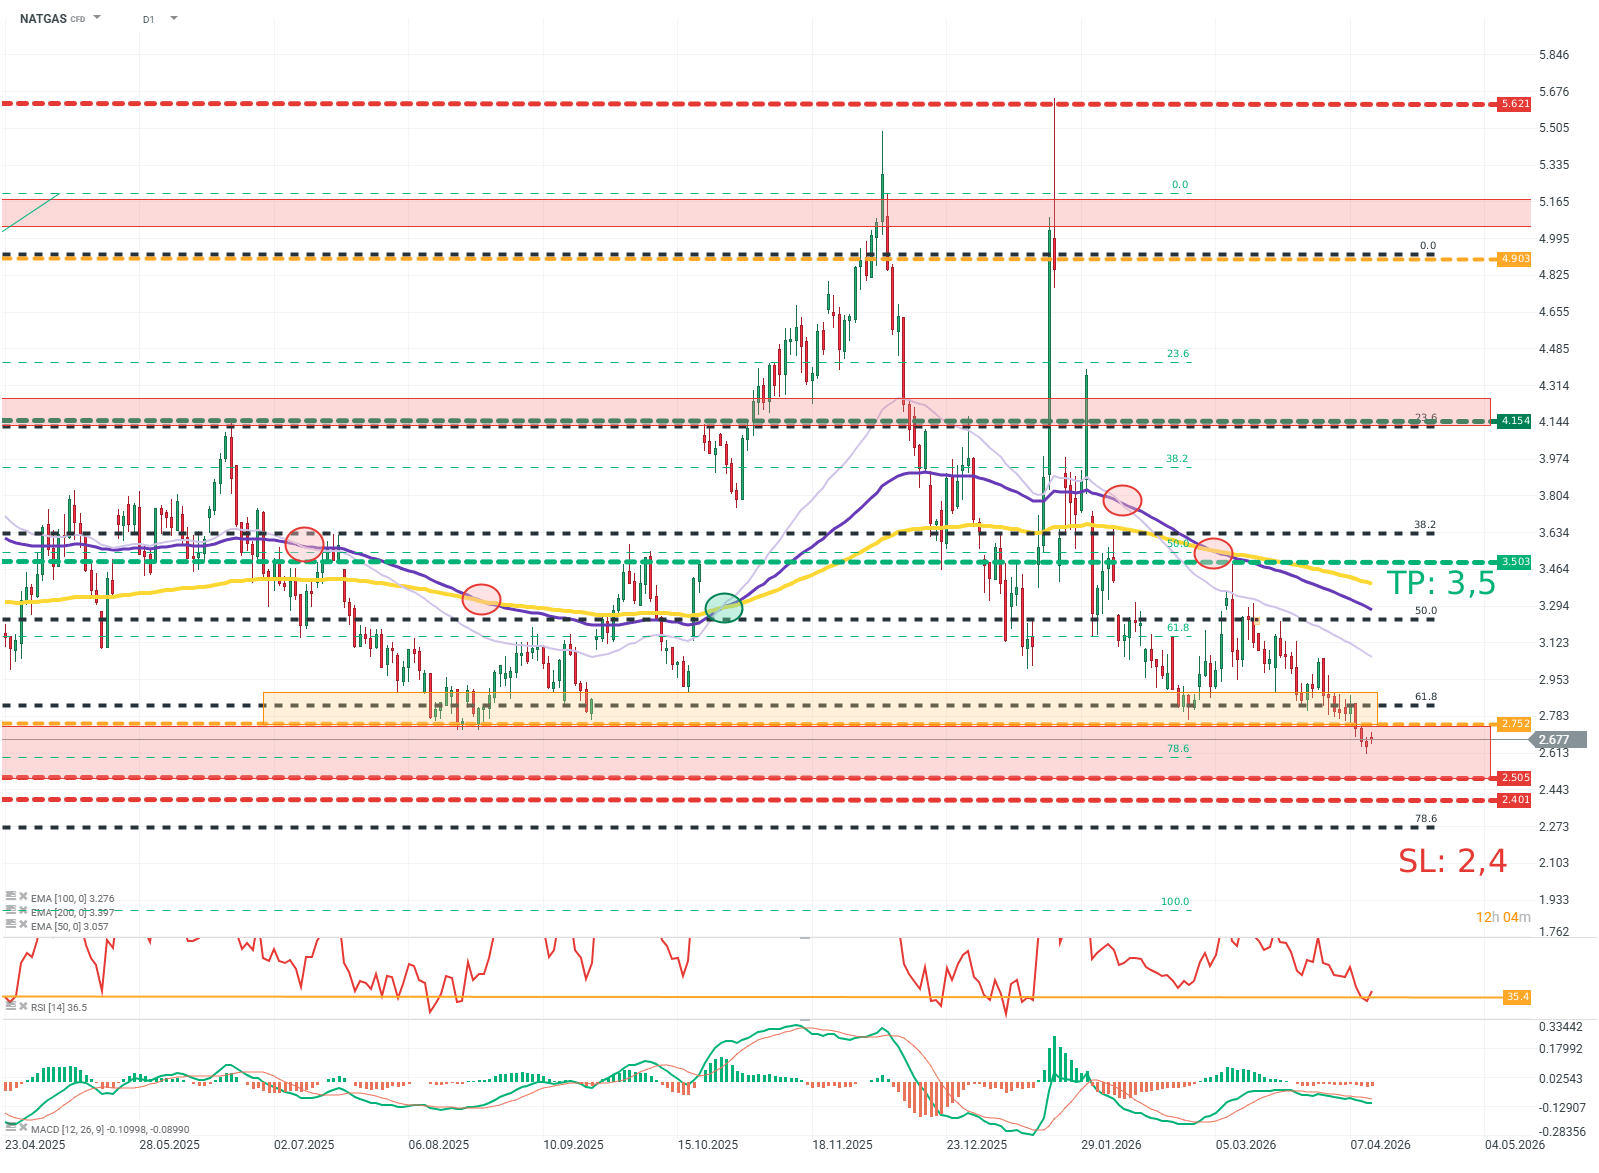
Source: xStation5
Opinion:
The shortage of hydrocarbons in the global market, related to the blockade of the Strait of Hormuz, has remained unchanged since the beginning of the conflict. According to official statements, peace negotiations between representatives of Iran and the U.S. ended in failure. The market seems to be underestimating the scale of the shortages. In this context, NATGAS is at multi-month lows, with significant potential for an upward corrective move. It is worth remembering that Qatar, located on the “closed” side of the strait, accounts for approx. 30% of total global production, and part of the extraction infrastructure has been damaged.
Methodology and assumptions:
The recommendation is based on technical analysis and the geopolitical context. The target level was set using FIBO levels (38.2 and 50) and EMA moving averages (50, 100, 200). The Stop Loss level was set based on the risk-to-reward ratio and the FIBO level (78.6)
Employees of the Analysis Department, as well as other persons involved in the preparation of this report do not have any knowledge about positions of Today Markets in financial instruments. In addition, Trading Department employees are not taking part in preparation of reports and/or market commentaries.