S&P 500 — US Large Cap Index
 FTSE 100 — UK Blue Chips
 Euro Stoxx 50 — Eurozone Leaders
 DAX 40 — German Equities
 CAC 40 — French Market Index
 Nikkei 225 — Japan Benchmark
 Hang Seng — Hong Kong Index
 Shanghai Composite — China Mainland
 ASX 200 — Australian Market
 TSX Composite — Canada Index
 Nifty 50 — India Large Cap
 STI Index — Singapore Market
 KOSPI — South Korea Index
 Bovespa — Brazil Equities
 JSE Top 40 — South Africa Index
 IPC Index — Mexico Market
Chart of the day: Nasdaq futures dip 0.6% despite TSMC earnings beat! AI sanity check?


Despite blockbuster Q2 earnings and upgraded full-year guidance from TSMC, Nasdaq futures are trading lower. A classic “sell the news” reaction to TSMC is being heavily compounded by a sudden, severe geopolitical escalation in the Persian Gulf. This double-whammy of valuation fatigue and a fresh energy supply shock is accelerating a “risk-off” rotation across global markets and the skepticism already visible in the AI related stocks. Technical Analysis: US100 (H1) The post-earnings and geopolitical pullback has forced the US100 below its short- and medium-term Exponential Moving Averages (EMA 10 at 29,675.34, EMA 30 at 29,727.24, and EMA 100 at 29,731.29). The index has breached the 61.8% Fibonacci retracement level (29,632.59) and is fast approaching a crucial technical juncture: the upward-sloping trendline connecting the July swing lows, which aligns near the 78.6% Fibonacci level (29,524.67). The RSI (14) has declined to 37.6, showing dominant near-term selling pressure but indicating the market is nearing oversold territory. Bulls must defend this primary trendline support to prevent a deeper correction toward the 100.0% Fibonacci level at 29,387.19.
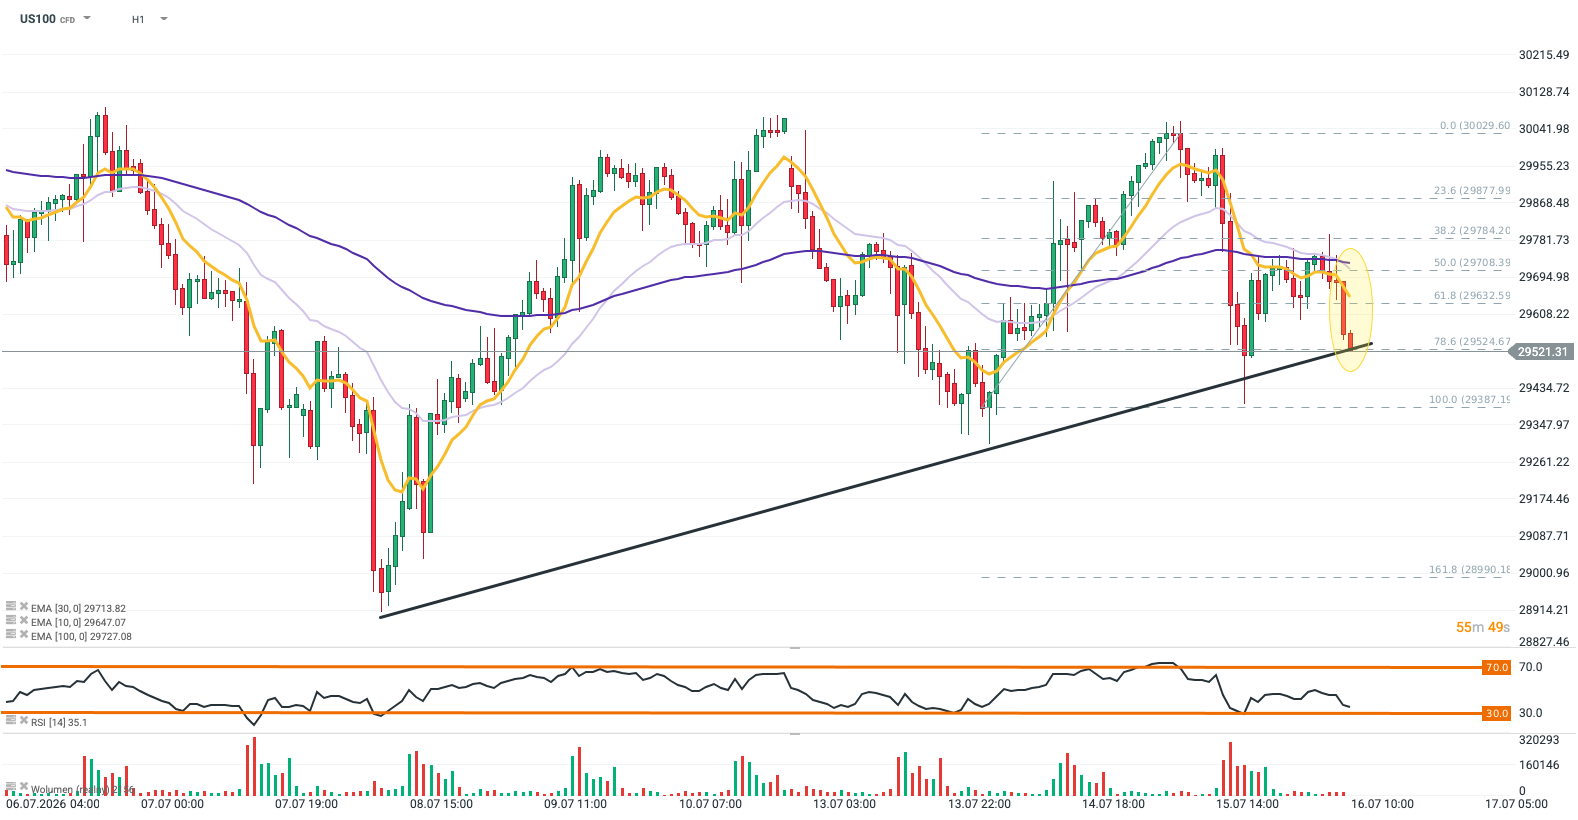
Source: xStation5 What’s driving Nasdaq futures (US100) today? The morning’s selling pressure reflects the fallout from TSMC’s earnings, which failed to lift a semiconductor market already bogged down by negative sentiment (the Philly Semiconductor Index slid 2% yesterday). This market repositioning is accelerating as escalating conflict in the Middle East puts a spotlight on the fragile, supply-constrained nature of the global silicon supply chain. TSMC’s Blockbuster Q2 Numbers & Guidance:
- Record Net Income: TSMC posted a record second-quarter net income of NT$706.56 billion (a 23.4% sequential increase), easily beating LSEG SmartEstimates of NT$632.64 billion and Bloomberg’s consensus of NT$623.73 billion.
- Revenue Growth: Q2 revenue surged 36% year-over-year to NT$1.27 trillion (approximately $39.45 billion), exceeding expectations.
- Profitability Milestones: Operating efficiency remained stellar, with gross margins rising to 67.7% (against the 67.1% expected) and operating margins reaching 60.3% (against 58.6% expected).
- Strong Q3 Guidance: The chipmaker expects Q3 sales between $44.6 billion and $45.8 billion, comfortably ahead of the $43.11 billion consensus. Q3 gross margins are projected between 65% and 67%.
- Raised Full-Year Outlook: Underscoring massive forward demand, TSMC hiked its 2026 capital expenditure outlook to a range of $60 billion to $64 billion (up from $52 billion to $56 billion previously). It also upgraded its full-year USD revenue growth projection to slightly above 40%, up from its prior estimate of over 30%.
The Broader AI Narrative:
- Real-World AI Hardware Demand: As the primary contract manufacturer for Nvidia, Apple, AMD, and Broadcom, TSMC’s record-setting revenue serves as a highly accurate proxy showing that AI infrastructure investment is still operating at full throttle.
- Persistent Supply Deficits: The structural deficit in cutting-edge silicon shows no signs of easing. CEO C.C. Wei recently warned that the company cannot build enough capacity to fulfill American customer demand for years, even as more US-based production comes online (including an estimated $265 billion investment in its Arizona campus). This supply shortage is corroborated by memory giant SK Hynix, which expects high-bandwidth memory (HBM) shortages to persist past 2030.
- Overspending & Valuation Jitters: Despite exceptional fundamentals, the Nasdaq’s immediate negative reaction highlights growing market skepticism. With hyperscalers like Meta and its rivals on track to spend over $725 billion on AI infrastructure this year alone, investors are increasingly concerned about whether these companies are overbuilding capacity relative to actual future revenue. Because a significant chunk of this spending is fueled by mounting corporate debt, tech stocks remain highly sensitive to valuation fatigue.
Geopolitical Escalation in the Persian Gulf:
- Gulf Military Escalation: The US missile strike on the supertanker Belma and subsequent US-Iran airstrikes have effectively shut the critical Strait of Hormuz, stalling global tanker traffic and triggering a sharp spike in crude oil prices.
- Risk-Off Asset Rotation: This severe energy shock and escalating geopolitical threat are driving a rapid market rotation, forcing capital out of high-beta tech assets (like Nasdaq futures) and into more defensive sectors (more value oriented Dow Jones futures are trading flat, holding the best among key US indices).