S&P 500 — US Large Cap Index
 FTSE 100 — UK Blue Chips
 Euro Stoxx 50 — Eurozone Leaders
 DAX 40 — German Equities
 CAC 40 — French Market Index
 Nikkei 225 — Japan Benchmark
 Hang Seng — Hong Kong Index
 Shanghai Composite — China Mainland
 ASX 200 — Australian Market
 TSX Composite — Canada Index
 Nifty 50 — India Large Cap
 STI Index — Singapore Market
 KOSPI — South Korea Index
 Bovespa — Brazil Equities
 JSE Top 40 — South Africa Index
 IPC Index — Mexico Market
GoldMarketsOpinionTechnical Analysis

Chart of The Day – Gold rebounds above $4000 – Goldman Sachs reaffirmed the forecast


Although gold has fallen by nearly 30% since late January , and is down around 24% since the outbreak of the Iran conflict , Goldman Sachs believes the long-term bull trend remains intact. According to the bank’s analysts, the current correction is primarily driven by expectations of a more hawkish Federal Reserve, while the fundamental drivers supporting higher gold prices remain firmly in place.
Key highlights
- Goldman Sachs reaffirmed its forecast for gold to reach $4,900 per ounce by the end of 2026 , citing both structural and cyclical factors that continue to support the market.
- The bank sees central bank buying , particularly from emerging markets, as the key long-term driver. Reserve diversification accelerated after Russia’s foreign reserves were frozen in 2022 and continues to provide a strong source of demand.
- Goldman Sachs also pointed to the latest World Gold Council survey, which found that 45% of central banks plan to increase their gold holdings over the next 12 months—the highest reading since the survey began.
- In the short term, however, gold continues to face headwinds from the Federal Reserve’s hawkish stance. Markets have once again started pricing in the possibility of U.S. rate hikes, weighing on demand for gold-backed ETFs.
- Higher bond yields and persistently elevated inflation expectations have improved the relative attractiveness of yield-bearing assets, leading some capital to rotate away from precious metals.
- Goldman Sachs does not share the market’s expectation of further monetary tightening. Its economists expect the Fed to leave interest rates unchanged this year and delay the start of the easing cycle until the second half of next year.
- Such a scenario would likely support a gradual recovery in ETF positioning, which has historically strengthened when investors expect lower real interest rates.
- Over the medium and long term, Goldman Sachs believes the balance of risks remains skewed to the upside. In addition to central bank purchases, the bank highlights growing concerns over fiscal sustainability in developed economies, which could encourage greater private-sector demand for gold.
- Goldman Sachs argues that gold’s current weakness is primarily the result of temporary macroeconomic headwinds. If the Fed proves less hawkish than markets currently expect and central banks maintain their strong pace of buying, gold could resume its long-term uptrend.
- As a result, oil prices and upcoming inflation data may prove to be the key catalysts for gold’s next major move.
GOLD chart (D1)
- From a technical perspective, the first major resistance is located near $4,400 per ounce , where the 200-day Exponential Moving Average (EMA200, red line) is currently positioned.
- The EMA50 and EMA200 are approaching a bearish “death cross” formation. If confirmed, it would be the first such crossover since 2023. However, this pattern does not reliably predict future price direction and often appears after a significant sell-off, making it more a sign of an oversold market than a standalone bearish signal.
- The next important support for gold is located around $3,800 per ounce , corresponding to a major price reaction zone established in 2025.
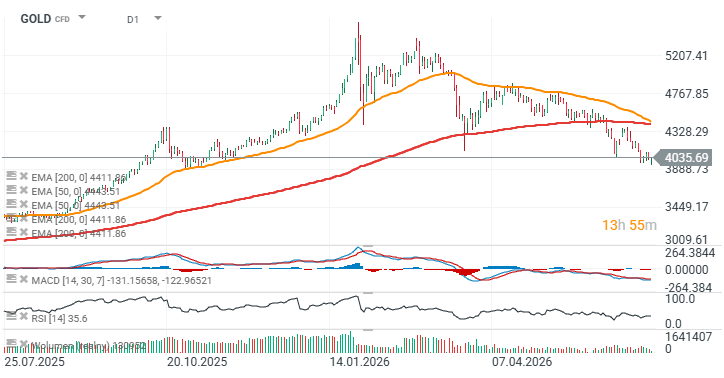
Source: xStation5