Commoditiy Markets – NATGAS, Gold, Cocoa and Silver
Gold – uncharted territory.
- Gold is reaching consecutive all-time highs, surpassing the $5,100 per ounce level. Last week, gold broke through successive milestones of $4,600, $4,700, $4,800, and $4,900 per ounce. The current $100-per-ounce increase is decidedly “easier” than it was just a year or two ago.
- Volatility in the gold market remains extremely high, more closely resembling periods in which gold lost value dynamically over the last several dozen years.
- Gold price increases are primarily driven by geopolitical factors, supported by dollar weakness. The level of interest rates is somewhat less critical, although the latest upward wave that began in August 2025 was initiated by the Federal Reserve’s dovish pivot.
- Currently, the Fed remains in rate-cutting mode, though it is not out of the question that—given current robust economic data, elevated and persistent inflation, and attacks on Fed independence—policymakers may indicate a need for a longer period of holding rates steady. This could result in only one cut this year or, in the case of a revival in inflation, the end of the easing cycle.
- On the other hand, it is worth mentioning the increased liquidity provided by the Fed’s technical purchases at a level of $40 billion.
- Key geopolitical factors remain the uncertainty regarding Greenland (though it is no longer the primary topic), uncertainty regarding Iran, the Middle East, Ukraine, and Venezuela. Further in the background, we also have the potential conflict between the US and China, which remains dormant for the moment, mainly due to cooperation in high-tech sectors (e.g., Nvidia’s sales of advanced chips to China).
- Goldman Sachs is raising its year-end gold forecast to $5,400 per ounce, citing strong demand from ETFs and central banks.
- OCBC is also raising its forecast, pointing to $5,600 per ounce (previously $4,800). The bank justifies its decision by citing rising global debt and geopolitics.
- Currently, the safe-haven status of the US dollar and US debt, as well as the Japanese yen and Japanese debt, is being undermined by aggressive fiscal plans; therefore, institutions indicate that bullion has now become the alternative for safe capital allocation.
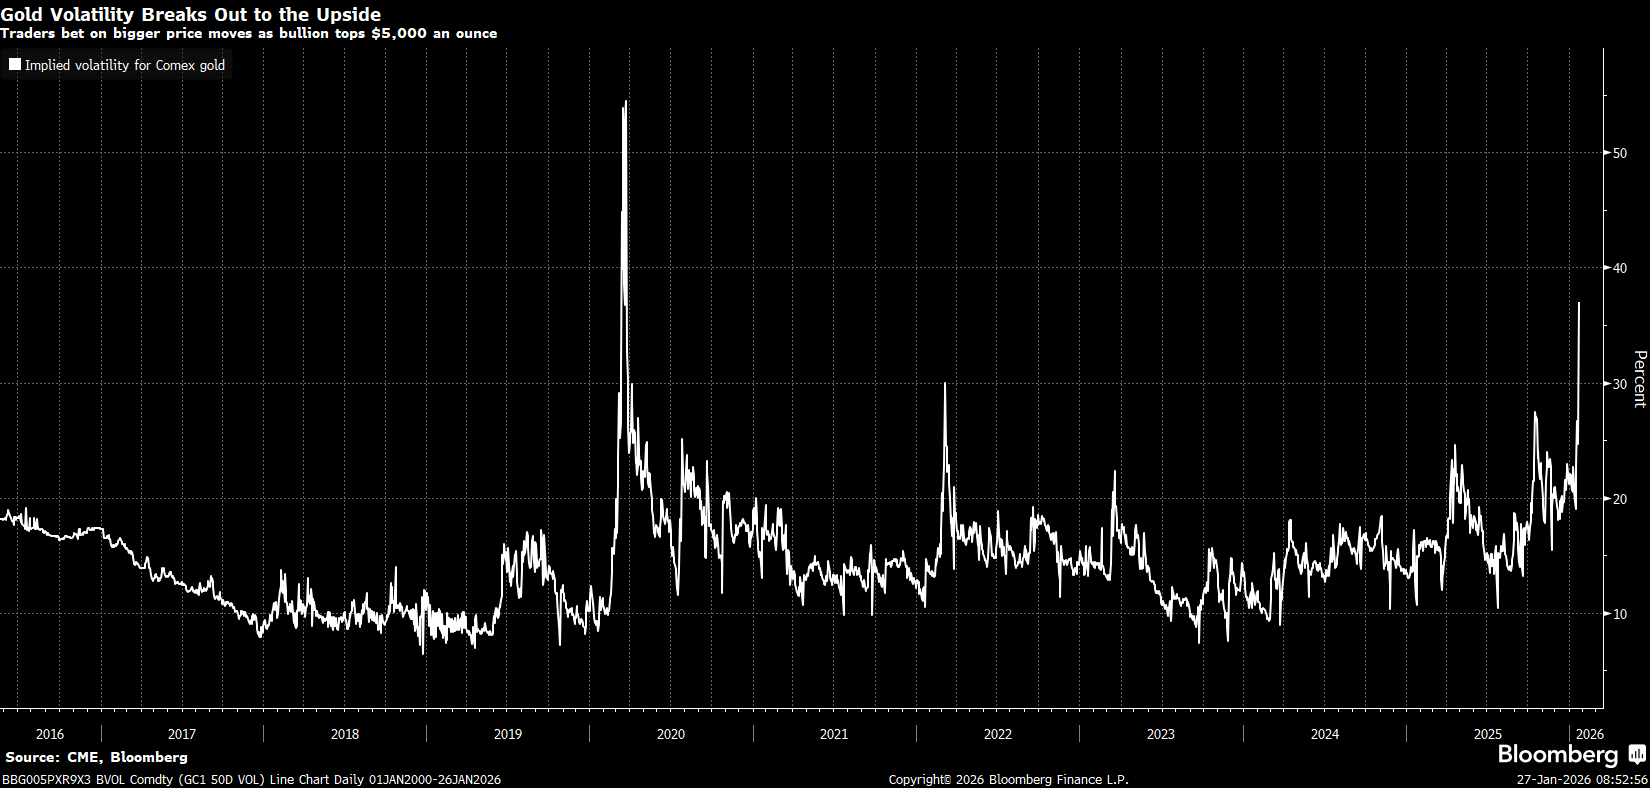 Implied volatility at approximately 37-38% means that over a year, gold has a chance to rise or fall by the indicated level with a 68% probability (i.e., within one standard deviation). Source: Bloomberg Finance LP
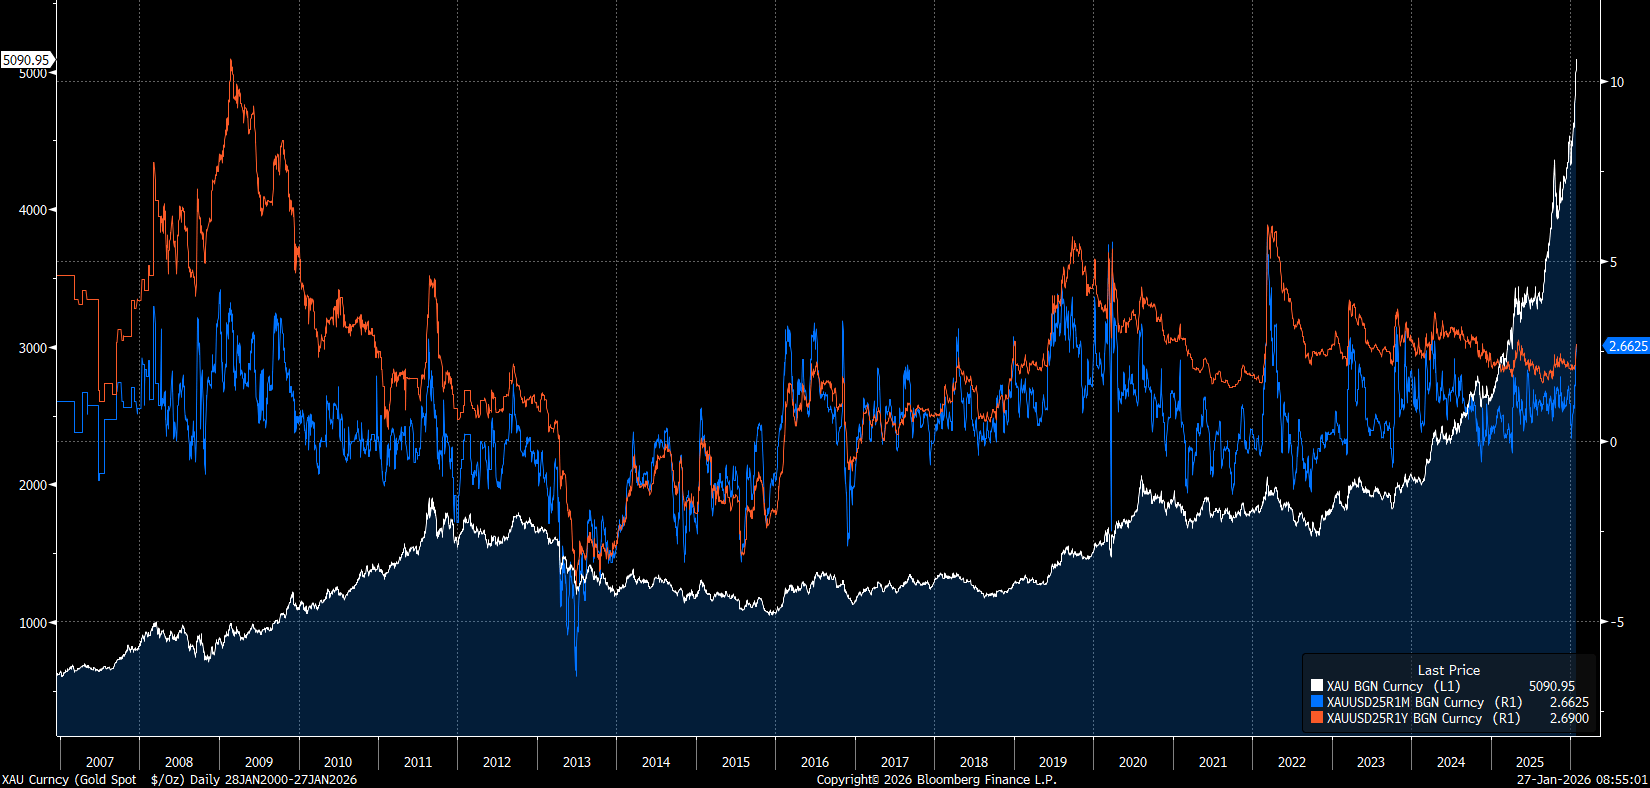 The risk reversal indicator, representing the difference between OTM call and put options, naturally favors a bullish scenario, yet we do not observe the extreme values seen in 2019, 2020, or 2022. Even with high implied volatility, it is not evident that the options market is extremely hedging against large upward moves. Source: Bloomberg Finance LP
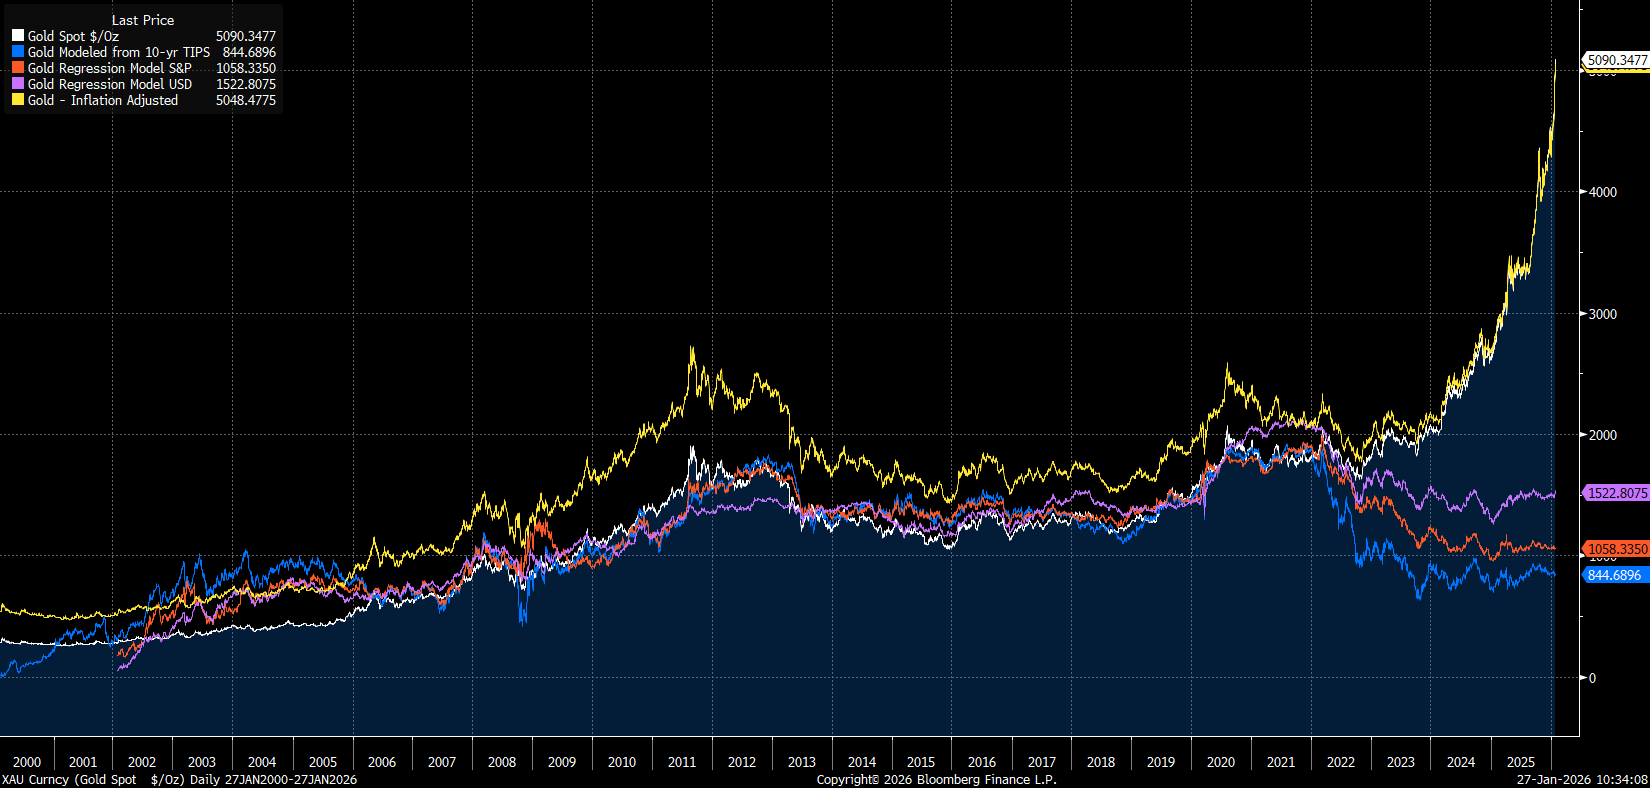 Gold valuation models diverged from the price dynamics of the metal itself in 2022, when strong geopolitical factors came into play and central banks resumed massive gold purchases. This demonstrates that uncertainty is currently the primary driver for precious metals. Source: Bloomberg Finance LP
Silver:
- Silver is reaching consecutive historic highs near $117 per ounce, while in China, the price premium stood at nearly $15 per ounce.
- Silver is gaining in China due to recent regulations attempting to draw larger quantities of silver into the country and onto the exchange.
- In contrast to COMEX, the Shanghai exchange typically experiences significantly higher calls for physical delivery.
- Inventories on the Shanghai exchange currently stand at 581 tonnes, which translates to nearly 19 million ounces. At the peak in February, this was over 1,400 tonnes, nearly three times current levels. In 2021, inventories stood at 3,000 tonnes, marking at least a 15-year peak based on available data.
- For example, on COMEX, current registered stocks are 114 million ounces. This is, however, a significant drop from approximately 200 million ounces in September. Eligible stocks—those not subject to delivery from futures contracts but meeting exchange requirements—are also declining, falling from about 340 million ounces in October to 300 million ounces currently.
- Inventories remain relatively high in historical terms, but the dynamics of the declines are simultaneously among the largest seen in recent years.
- Open interest remains around 155,000 contracts (each representing 5,000 ounces, though likely only a minority may be subject to delivery).
- The gold-to-silver price ratio is falling significantly below 50-53 points, below long-term averages. Looking at the history of the last several decades, the area around 40 was an important turning point. With gold at $5,100-$5,300, a drop in the ratio to that level would imply a silver valuation in the range of $127.5-$132.5.
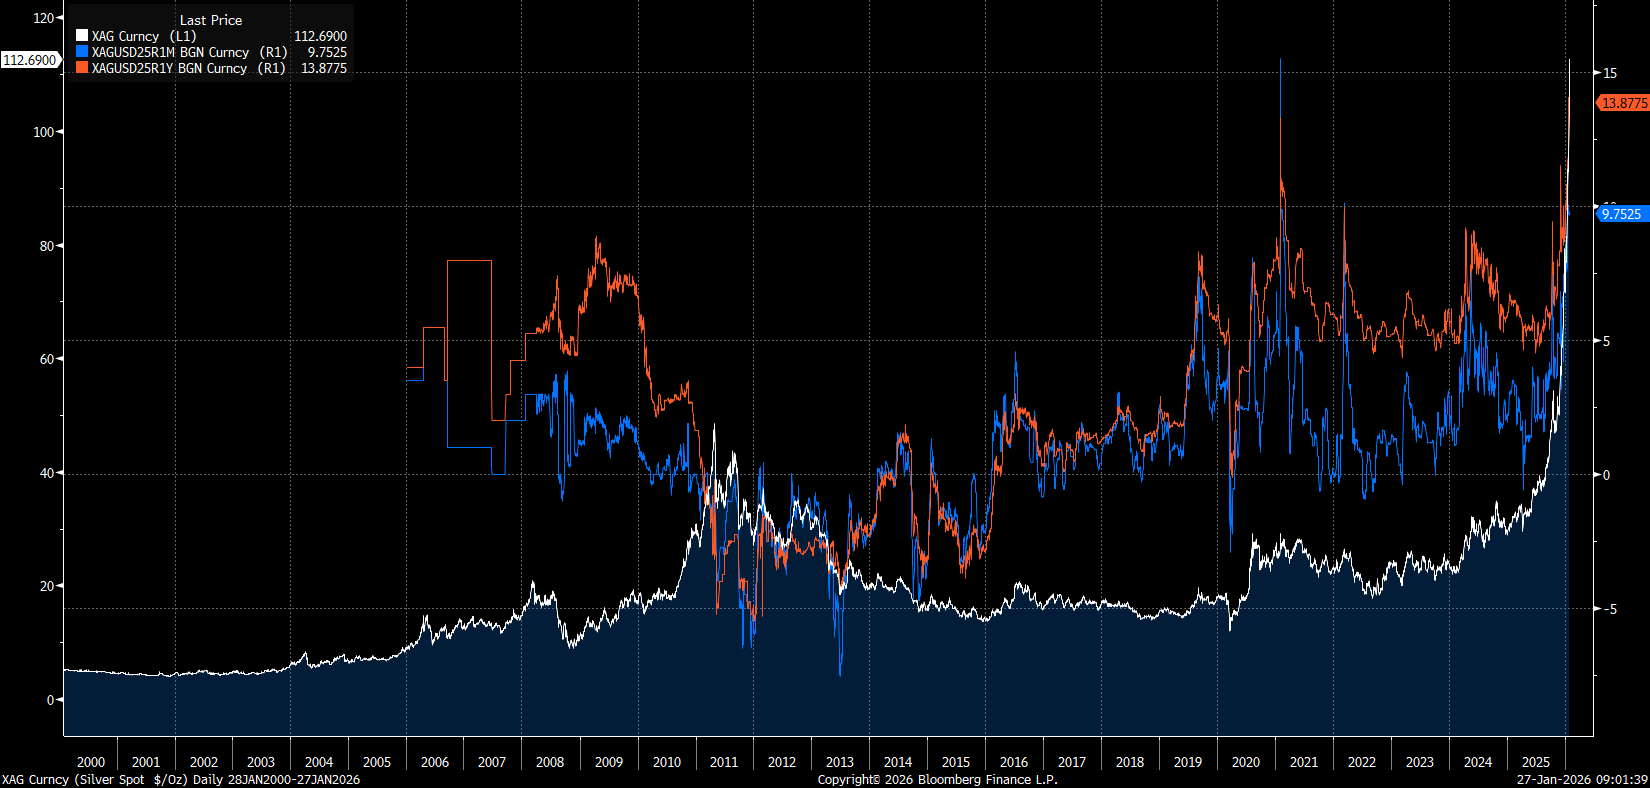 Risk reversal for silver is at extremely high levels for 1-year options (a significantly greater preference for calls over puts). Currently, risk reversal for 1-year OTM options is the highest in history, while for 1-month options, it also remains at extreme levels (similar to 2022, but lower than 2020). This may suggest an extreme overvaluation of silver. Nevertheless, it is worth noting that the silver market is currently governed primarily by the physical market over the paper one. Historically, such a high RR suggested corrections. Source: Bloomberg Finance LP
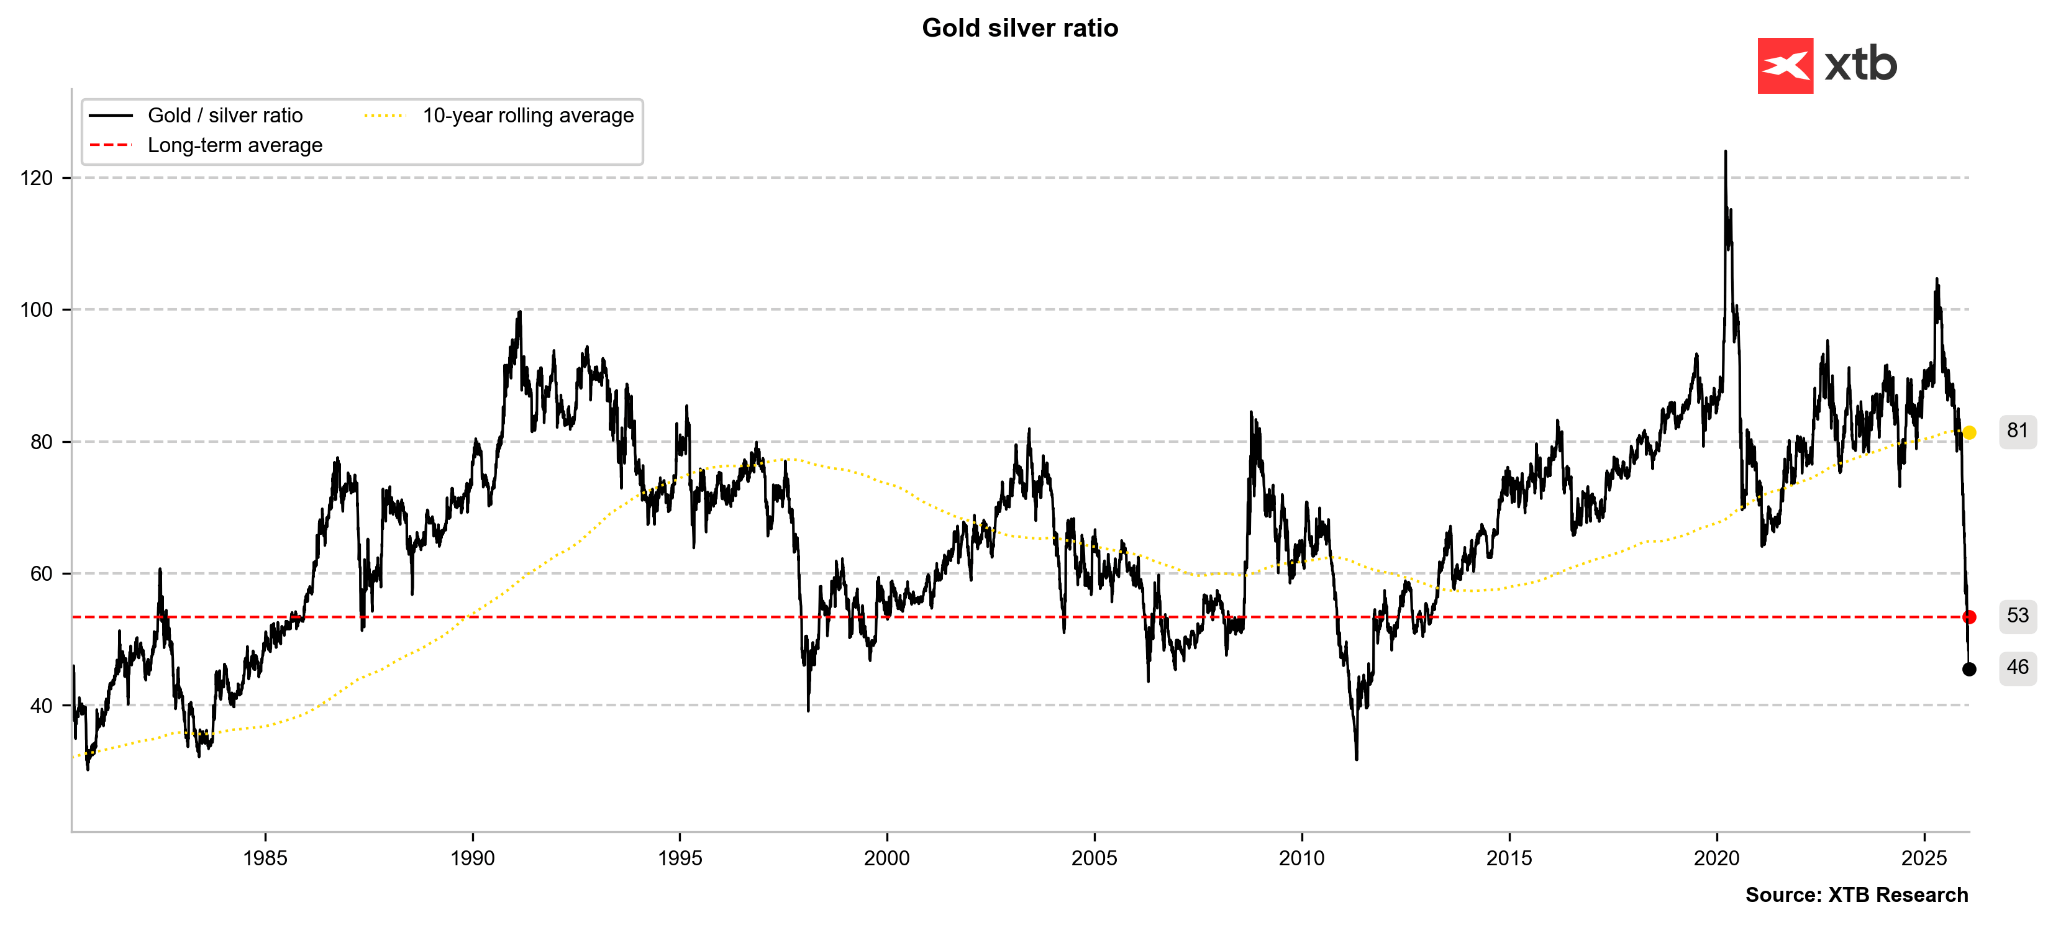 The gold-to-silver ratio is already falling to its lowest level in nearly 15 years. The target could be the 40-point level, though in the 1980s or in 2011-2012, it moved even lower. Source: Bloomberg Finance LP
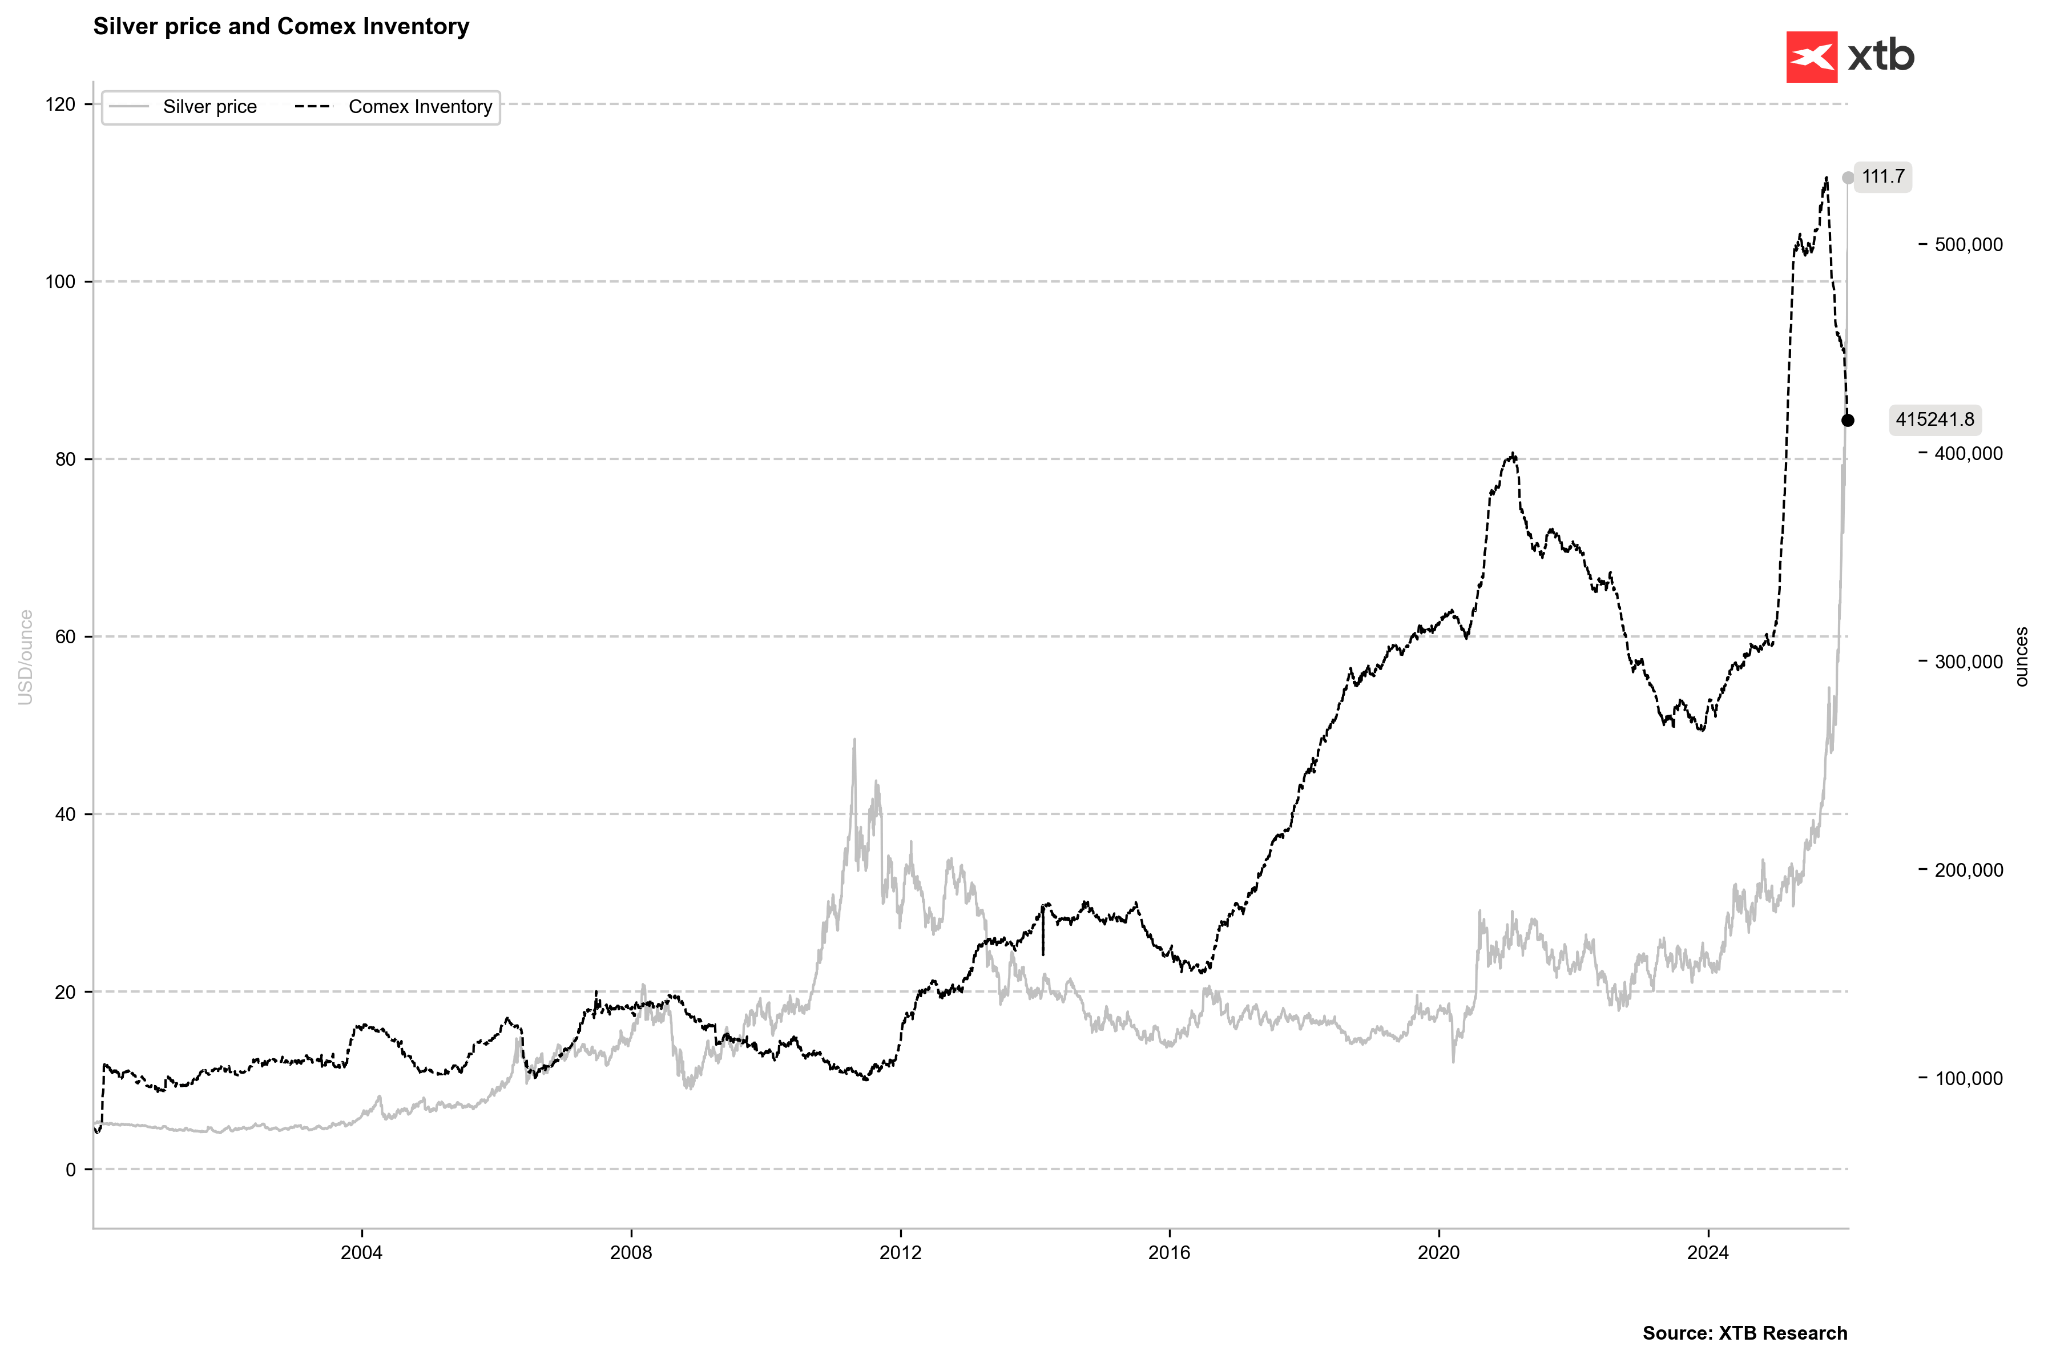 Silver inventories on COMEX have already fallen over 100 million ounces from their historic peak. Although they remain high, the pace of change is quite extreme. Source: Bloomberg Finance LP, XTB
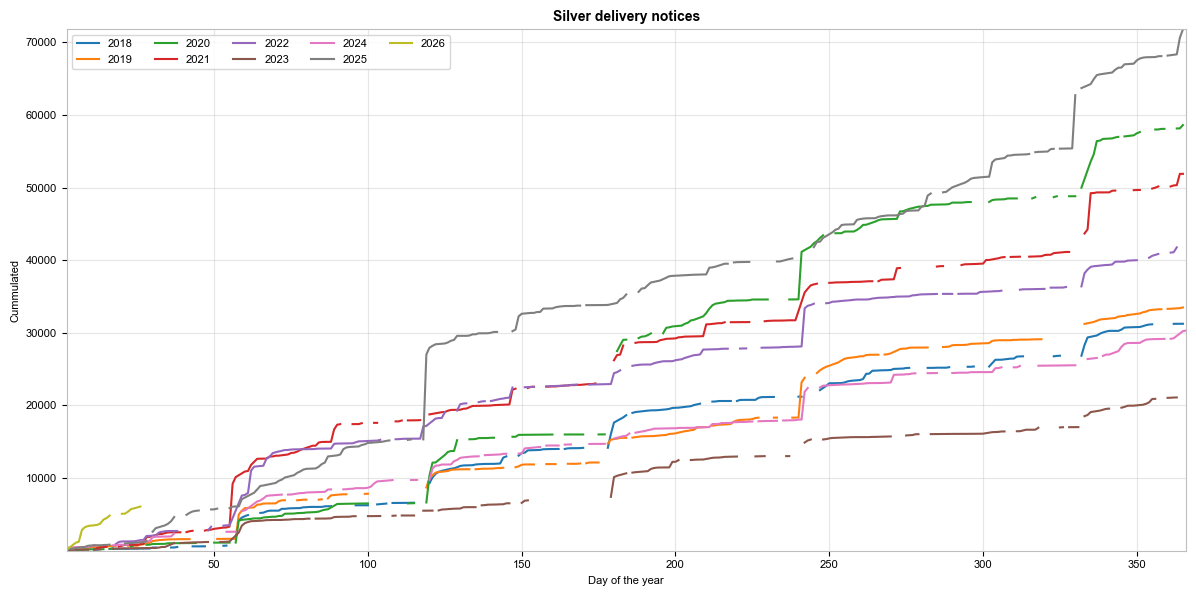
Physical delivery calls on COMEX are exceptionally high for currently expiring contracts. Typically, the largest calls at the beginning of the year occur for the March and May futures contracts. Source: Bloomberg Finance LP, XTB
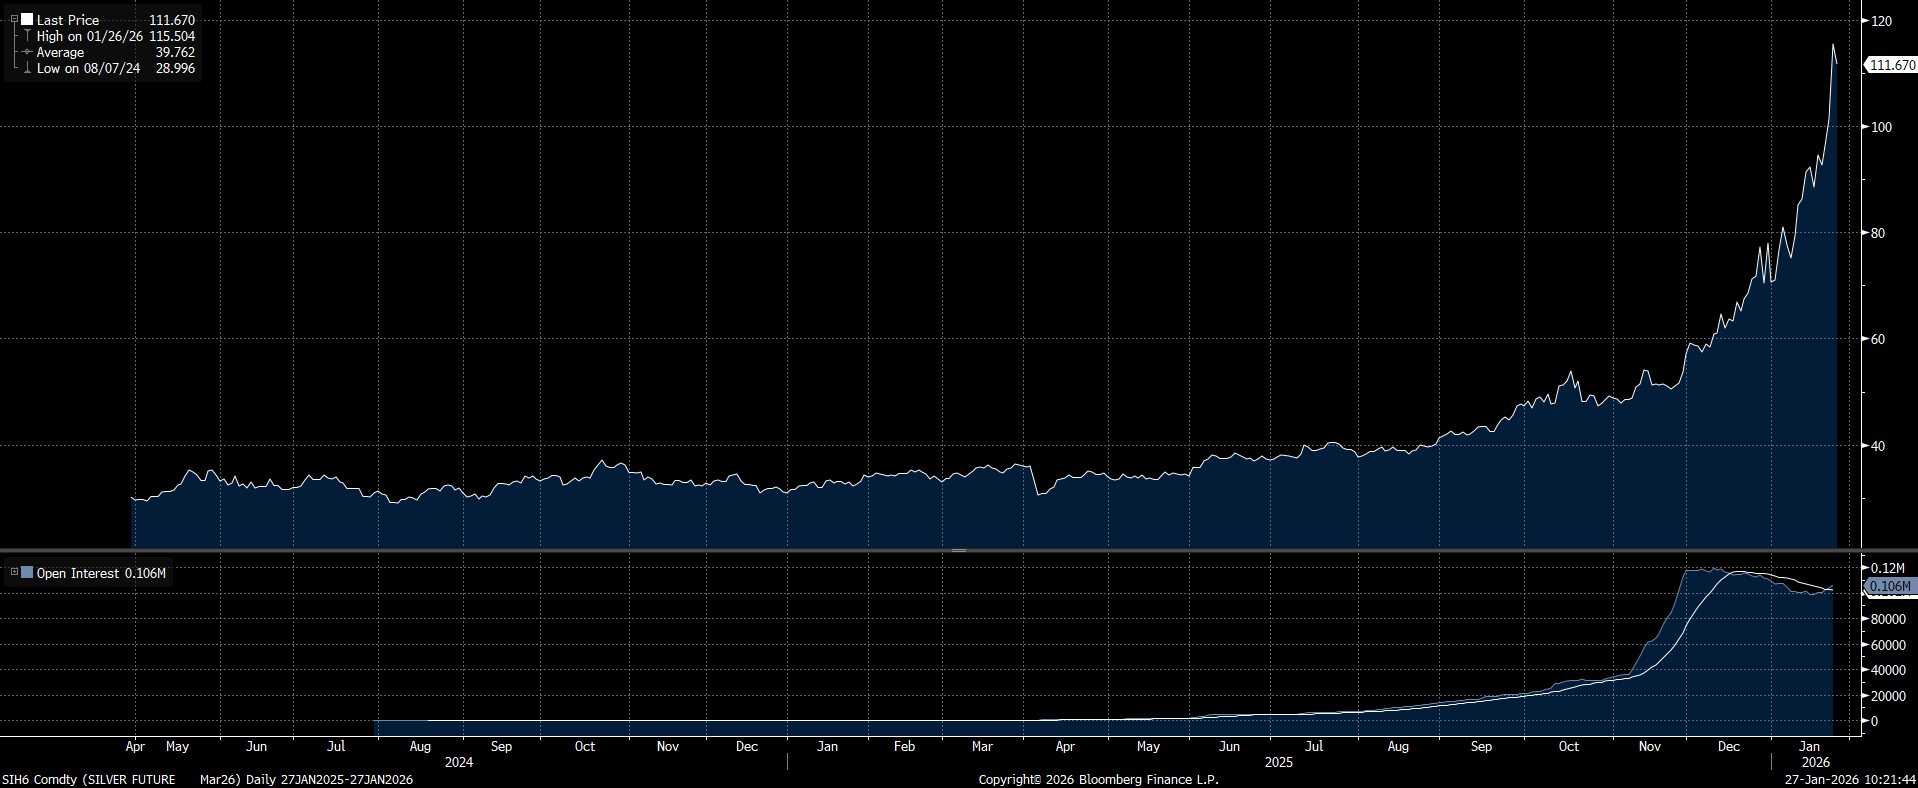 Open interest for the March contract has begun to rebound, which may suggest a greater willingness to take delivery. However, the key will be how many contracts are rolled over in the first half of February. If the number of contracts remains in the 80,000–100,000 range, it could present a potential problem regarding silver availability on the exchange. Nevertheless, it is worth emphasizing that the current amount of open positions on the March contract is not extraordinary. Source: Bloomberg Finance LP
Natgas:
- A severe winter in the United States is triggering not only increased demand for gas but also a distinct pullback in production.
- It is indicated that in the Permian alone, oil production dropped momentarily by 1.5 million bpd, though this decline has now been halved.
- In the case of natural gas, over 20% of production may be at risk. From approximately 120 bcfd, production has fallen significantly below 100 bcfd.
- Outlooks for the second week of February indicate a significant warming compared to current temperatures, although temperatures in eastern states may remain slightly below averages. It is important, however, that normal temperatures are expected to return to Texas. Currently, the greatest discrepancy is occurring in Florida.
- It is worth noting, however, that current inventory levels in the US remain not only above the 5-year average but above the 5-year range. Theoretically, if production problems were to persist and demand remained unchanged, the implied storage draw for this week could reach as much as 400 bcf. Most likely, however, this figure will be significantly reduced in the coming days.
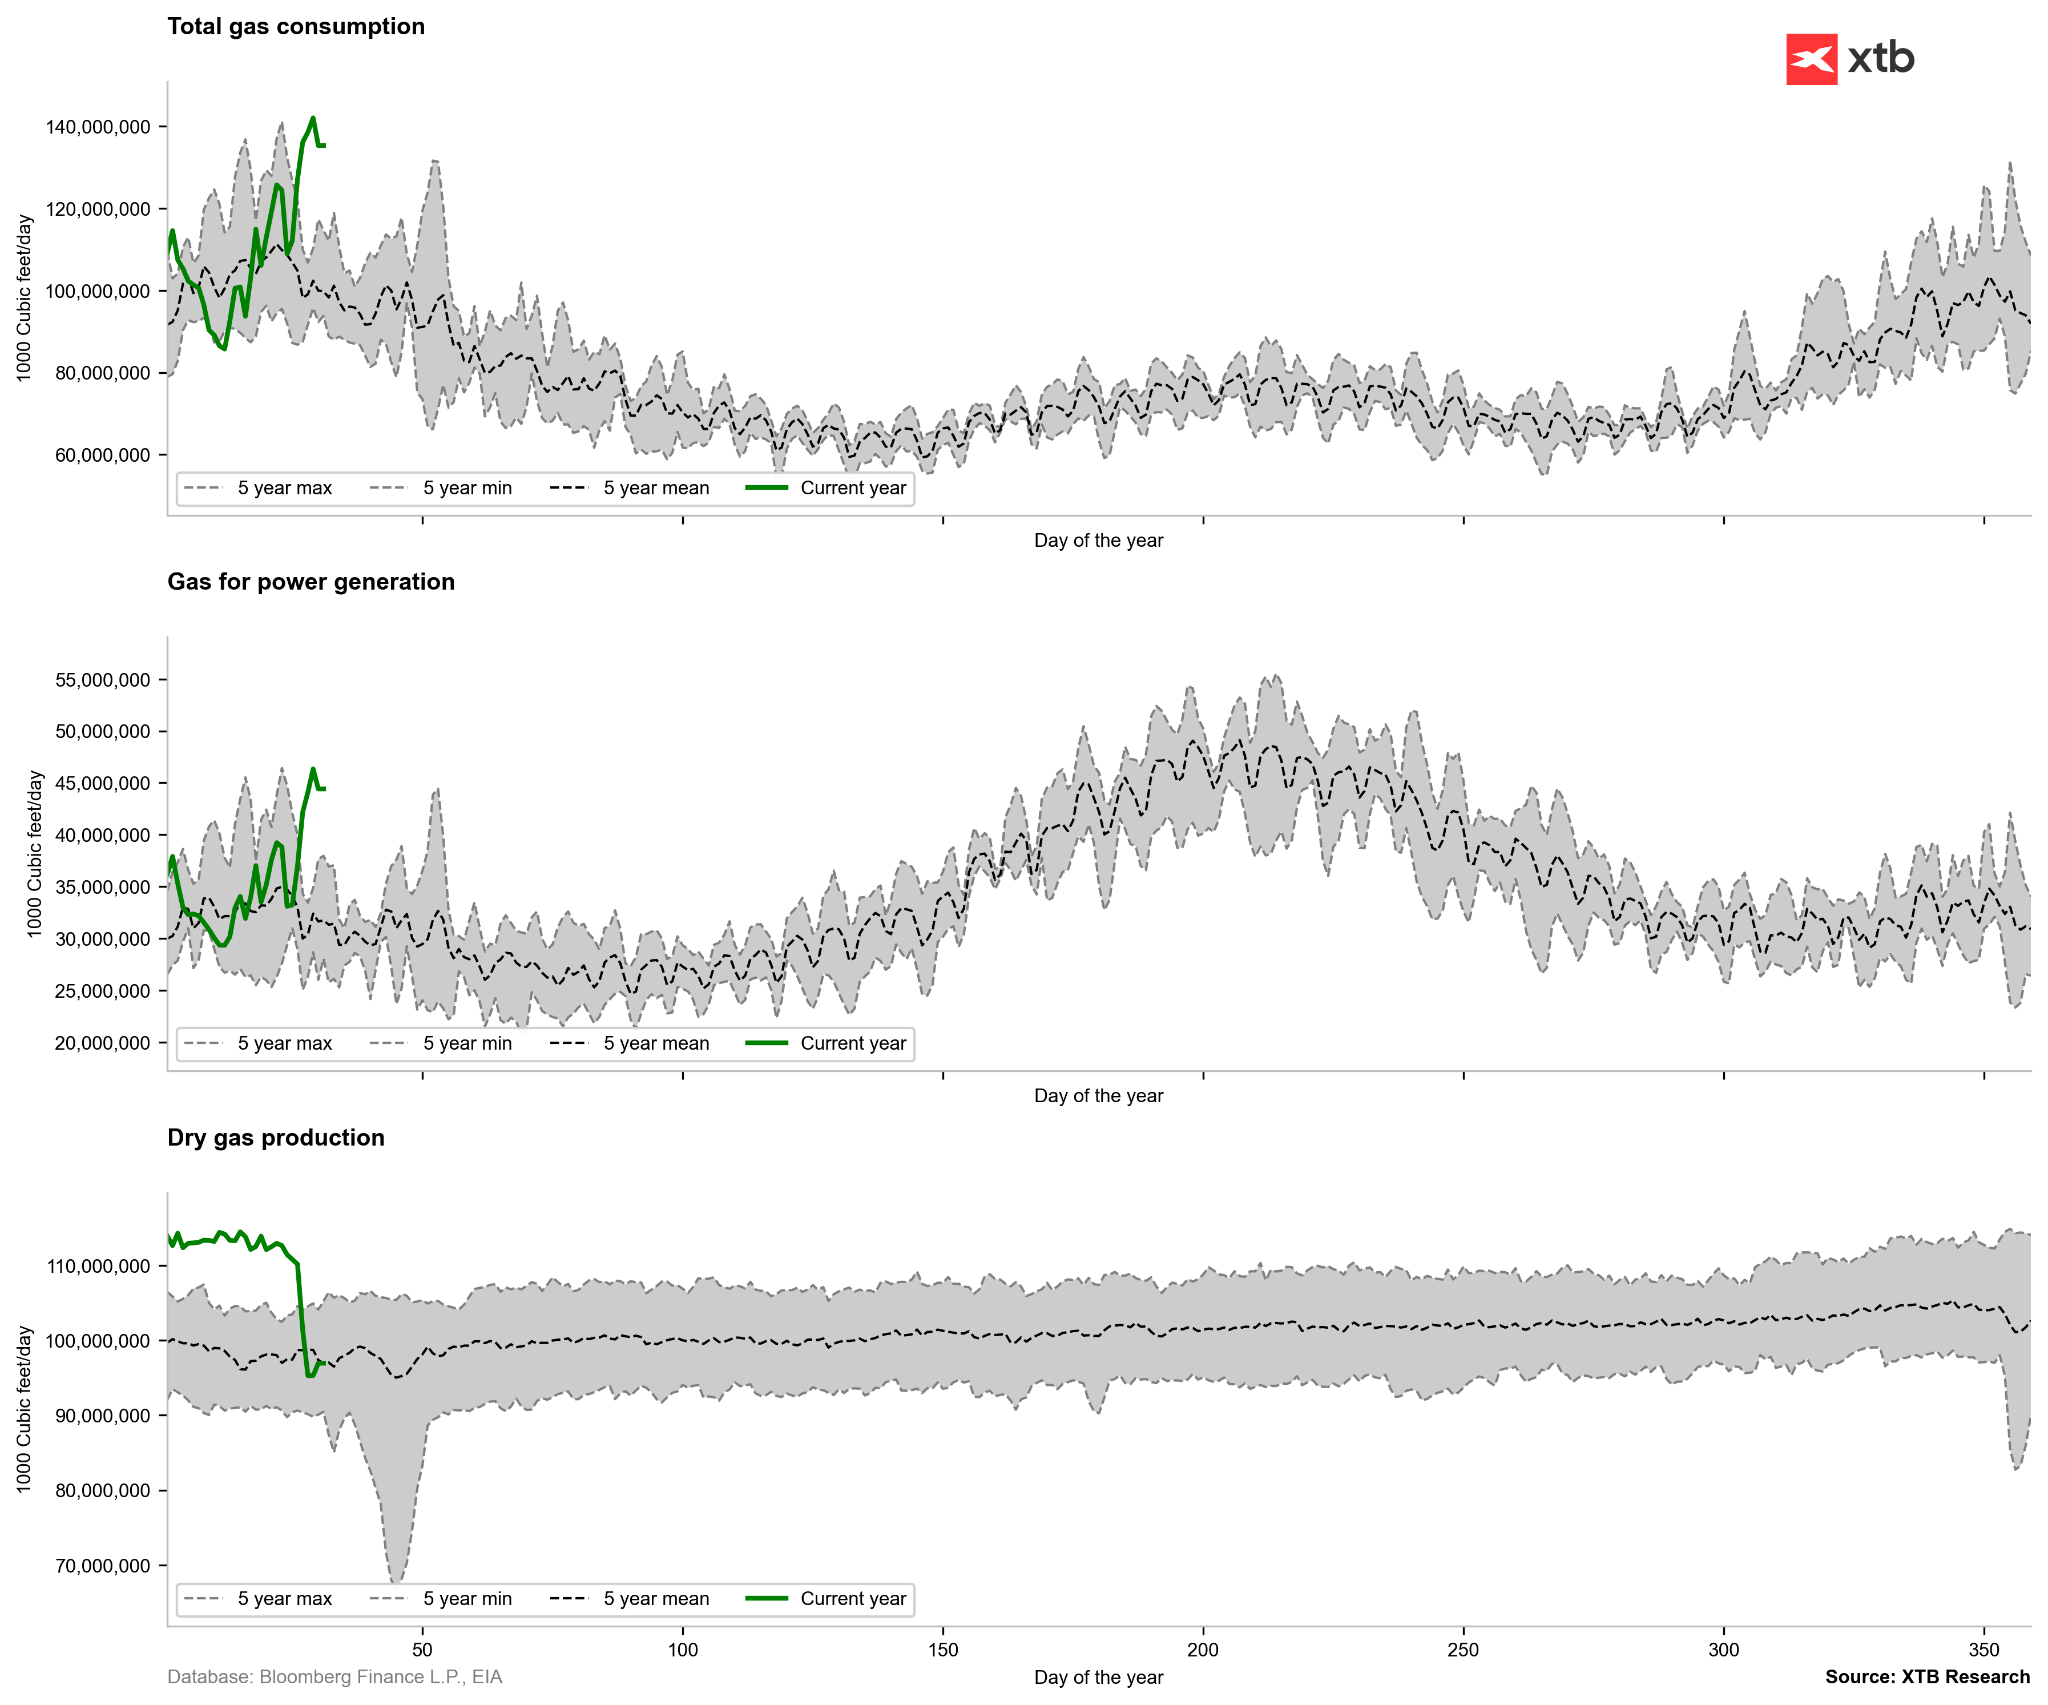 We are observing a distinct increase in gas demand, clearly above the 5-year average for the given period, but simultaneously within the 5-year range for the heating season. A crucial factor, however, is the drop in production. If this decline persists for more than a few days, it could mean a price boost in the following weeks, even though weather data indicates significant warming in the coming days. Source: Bloomberg Finance LP, XTB
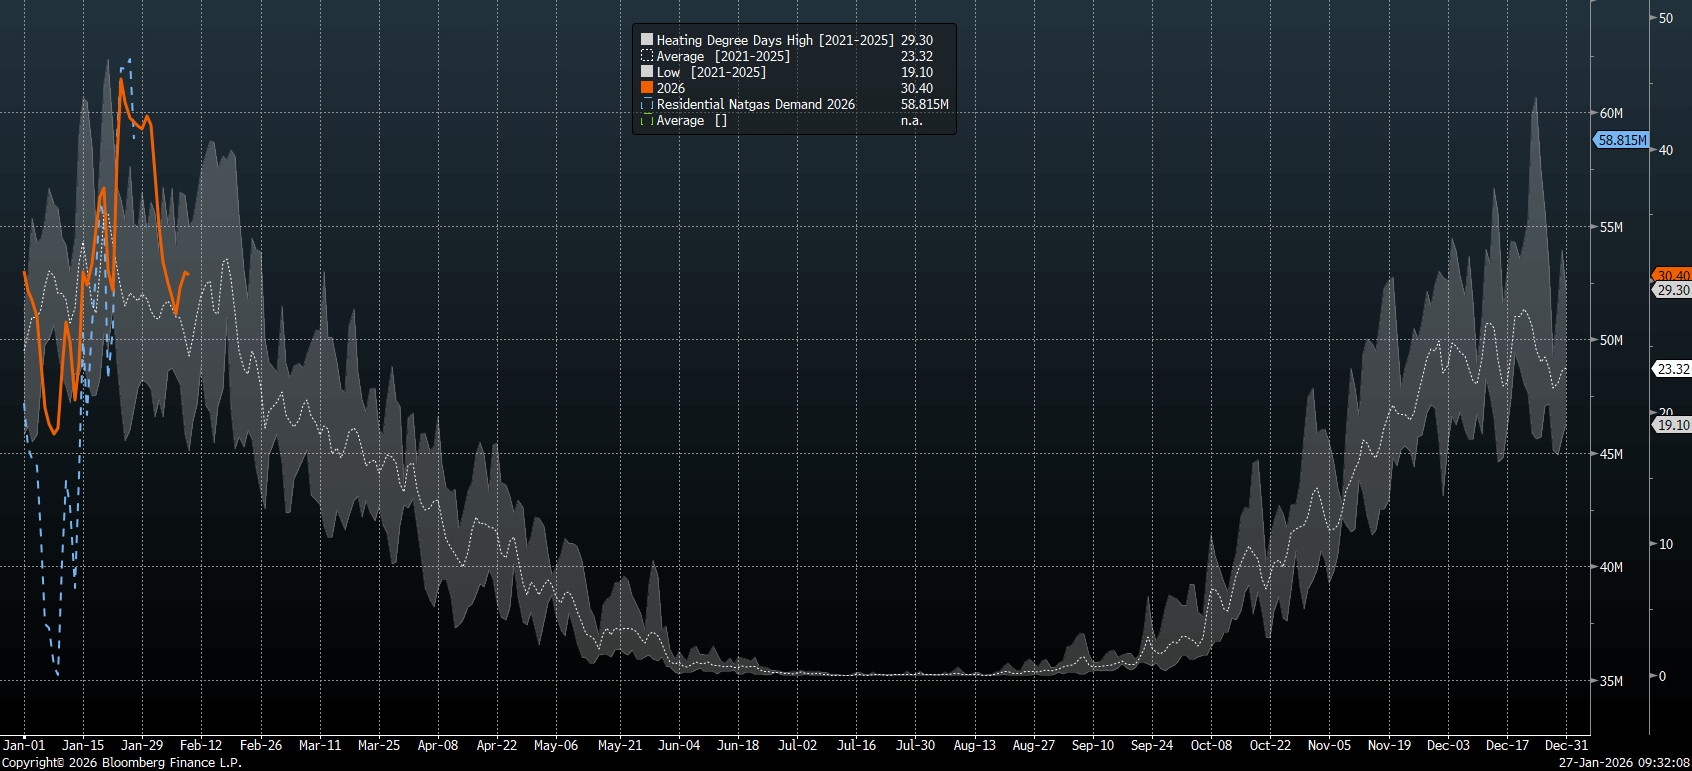 The number of heating degree days has fallen toward the 5-year average, but a stronger drop in heating needs should only be observed at the beginning of February. The dashed blue line illustrates current gas consumption by households. The orange line indicating the HDD forecast points to a potential drop in demand. Source: Bloomberg Finance LP
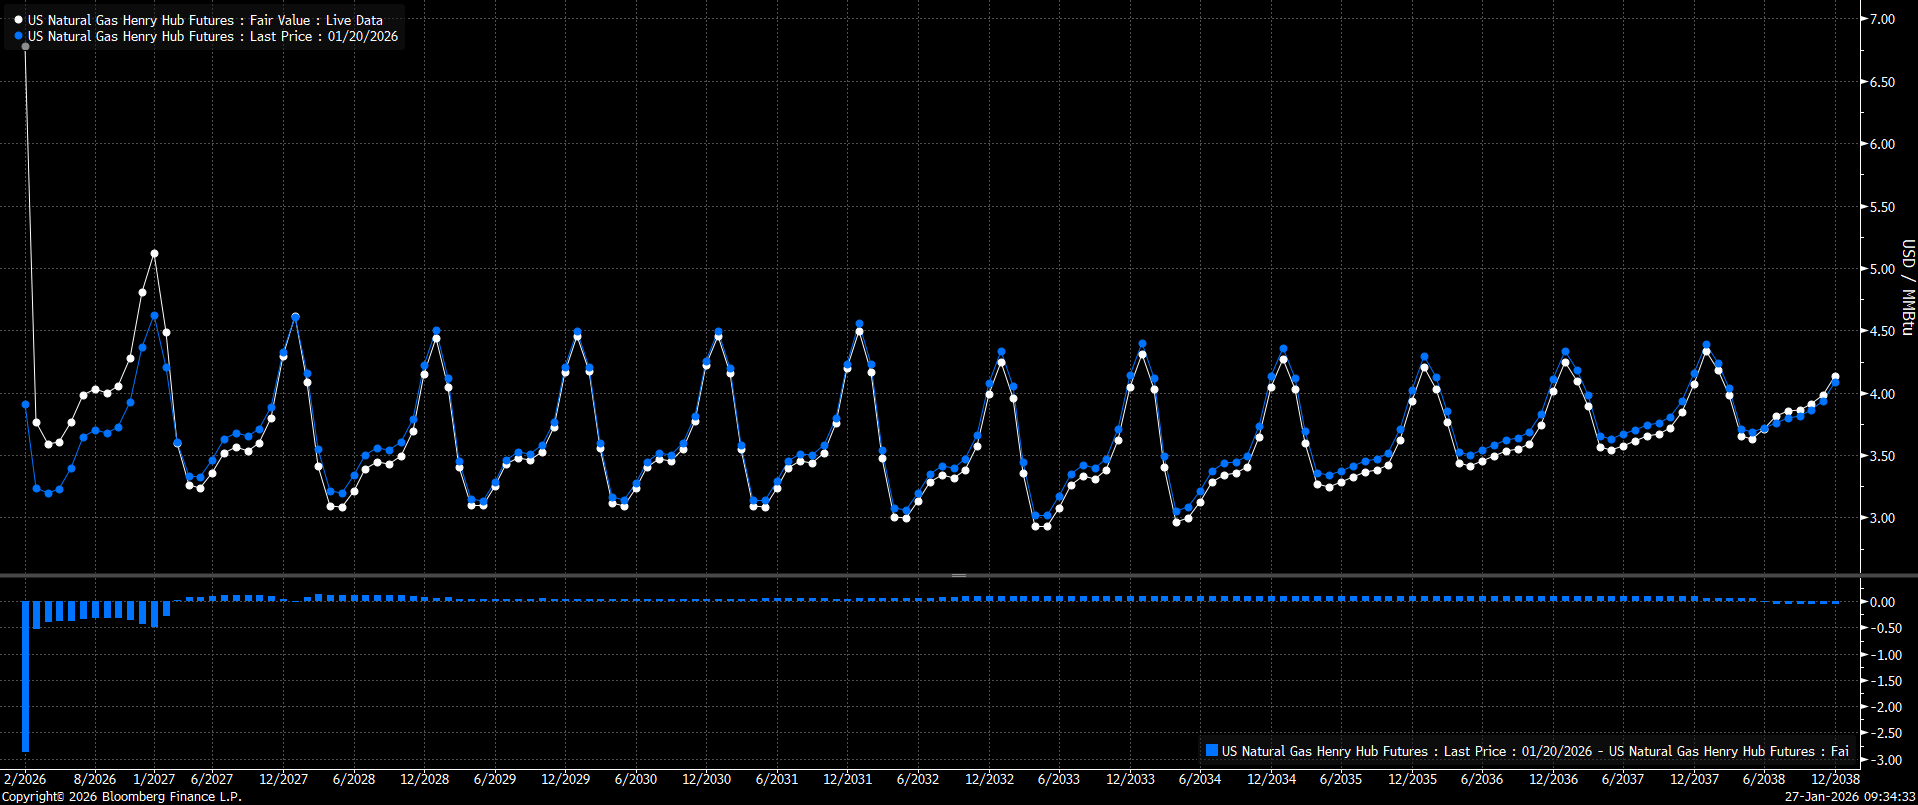 The February contract is currently extremely overbought compared to January 20 levels. As can be seen, the March contract is not experiencing such large increases, which may suggest a slight current overvaluation of prices. Nevertheless, the key factor regarding further price volatility will be the restoration of production, at least to the 100-105 bcfd range. Source: Bloomberg Finance LP
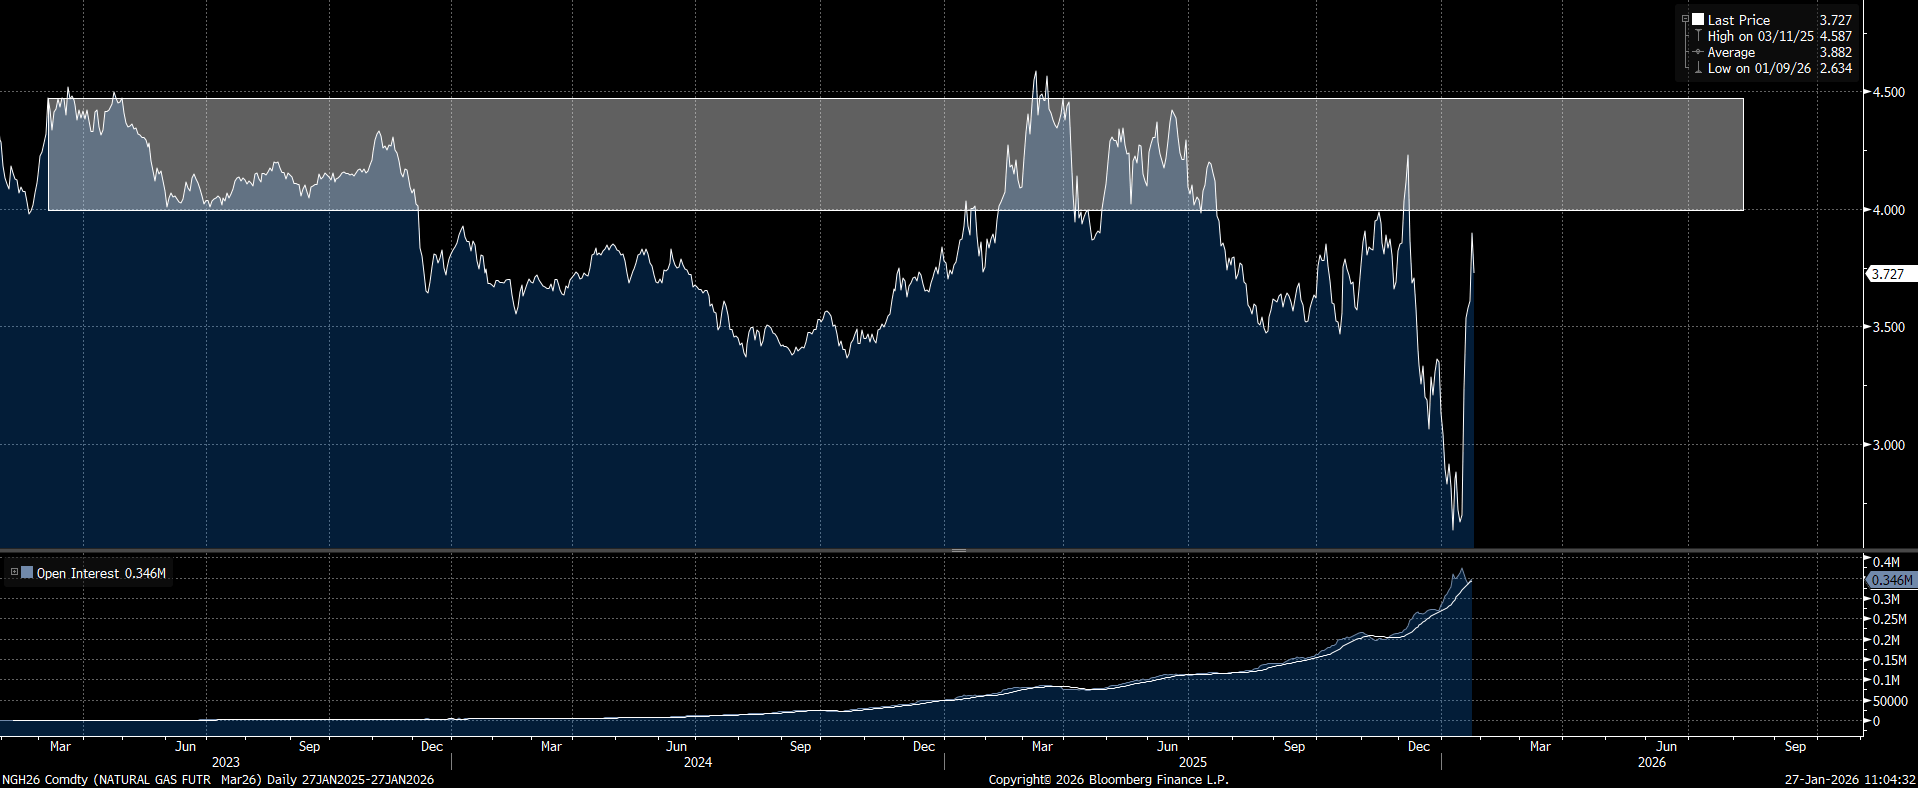 An absence of weather anomalies from this point forward should lead to a drop in gas prices for the March contract to at least the $3.5 level; however, looking at the trading history of the current contract, significant supply is visible between $4 and $4.5/MMBTU. Therefore, an attempt to test these areas cannot be ruled out, especially since we do not yet see a decline in open interest for this contract. If we notice a significant drop at the beginning of February, it could signal the start of a correction. Source: Bloomberg Finance LP
Cocoa:
- We are observing extreme oversold conditions in the futures market. Price indicators based on deviations also suggest excessive selling.
- A leading indicator in the form of the change in open interest positions compared to the annual change in cocoa prices suggests a narrowing of losses and a recovery in the near term.
- Cocoa deliveries to ports are still lower than last year, even with estimates of a larger oversupply. Deliveries reached 1.2 million tonnes, whereas in the previous year, it was 1.24 million tonnes since the beginning of October.
- The latest ICCO report showed that global ending stocks for the 24/25 season reached 1.1 million tonnes. It is indicated that for the current season, stocks could reach 1.7 million tonnes.
- Barry Callebaut recorded a 22% drop in sales volume in the three months ended November 2025. This shows that demand destruction in 2025 actually took place on a large scale.
- Q4 processing data showed the largest declines in Europe and Asia. It is indicated that due to lower prices in the first quarter of this year, we should observe a recovery compared to Q4 2025.
- Exchange inventories tracked by ICE are rebounding to 1.7 million bags. The current rebound in inventories is consistent with seasonality. Stocks should theoretically rebound until June. Inventories are currently higher than in the previous year.
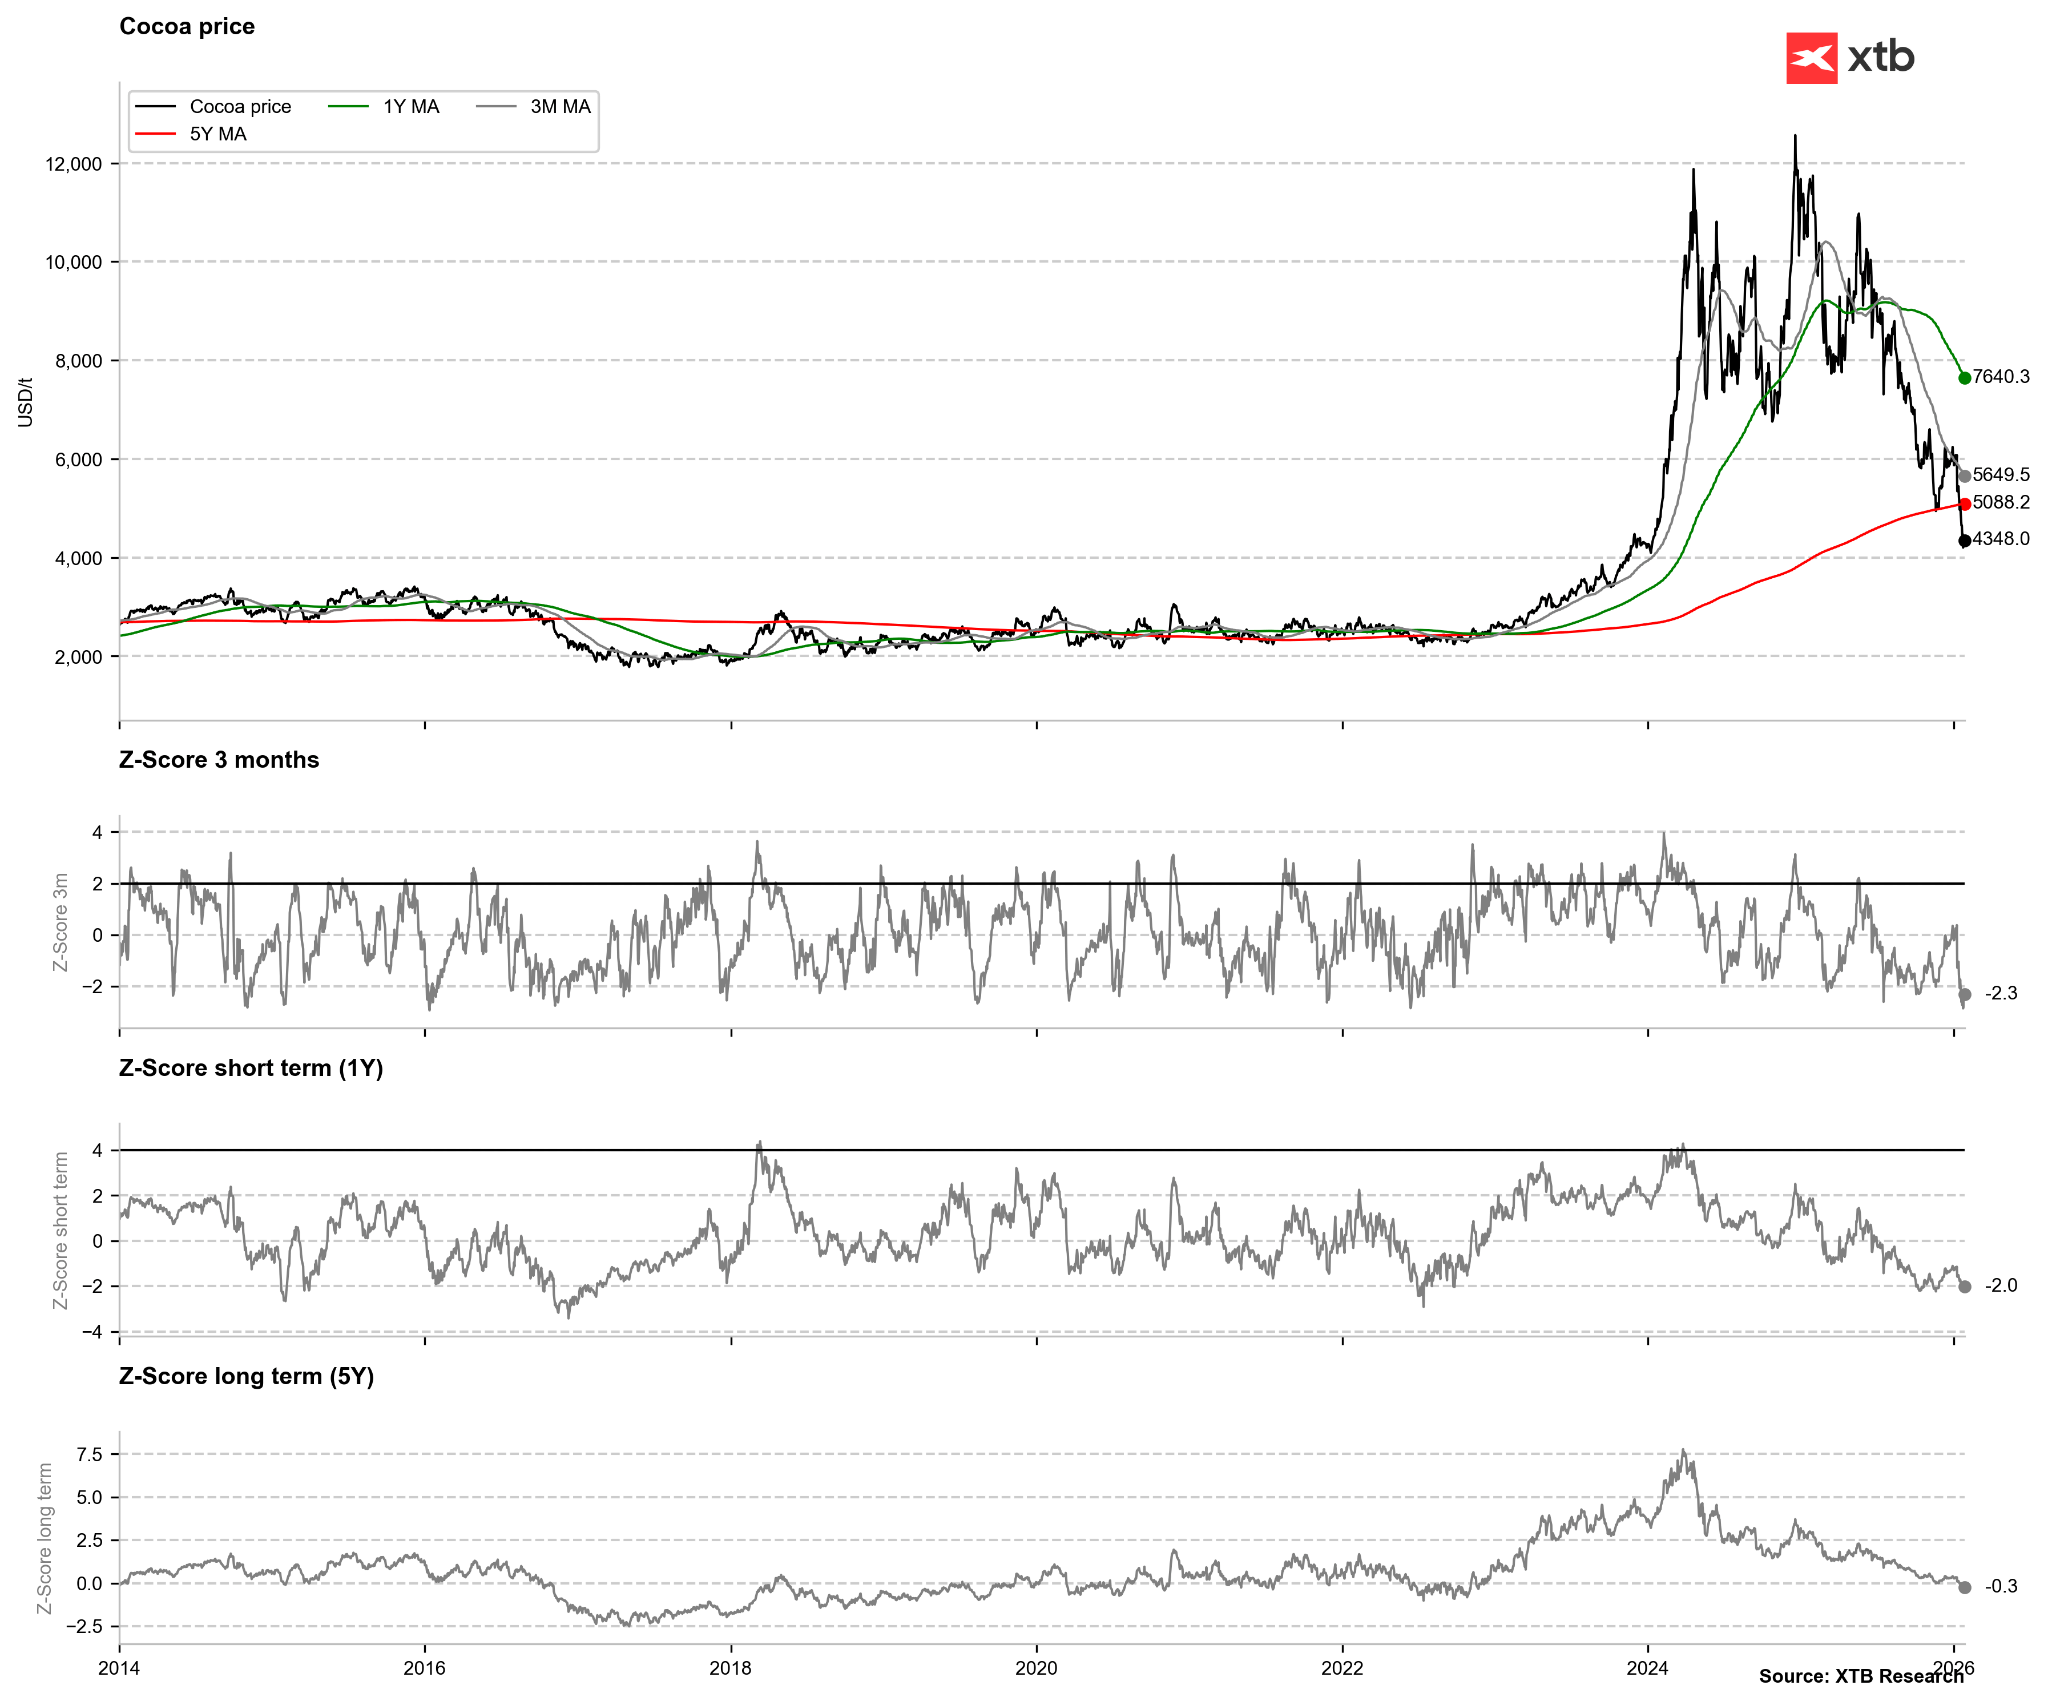 The price of cocoa is extremely oversold when looking at the 1-year and 3-month averages. Cocoa is also below its 5-year average—in 2023, this was a signal of a recovery. Source: Bloomberg Finance LP, XTB
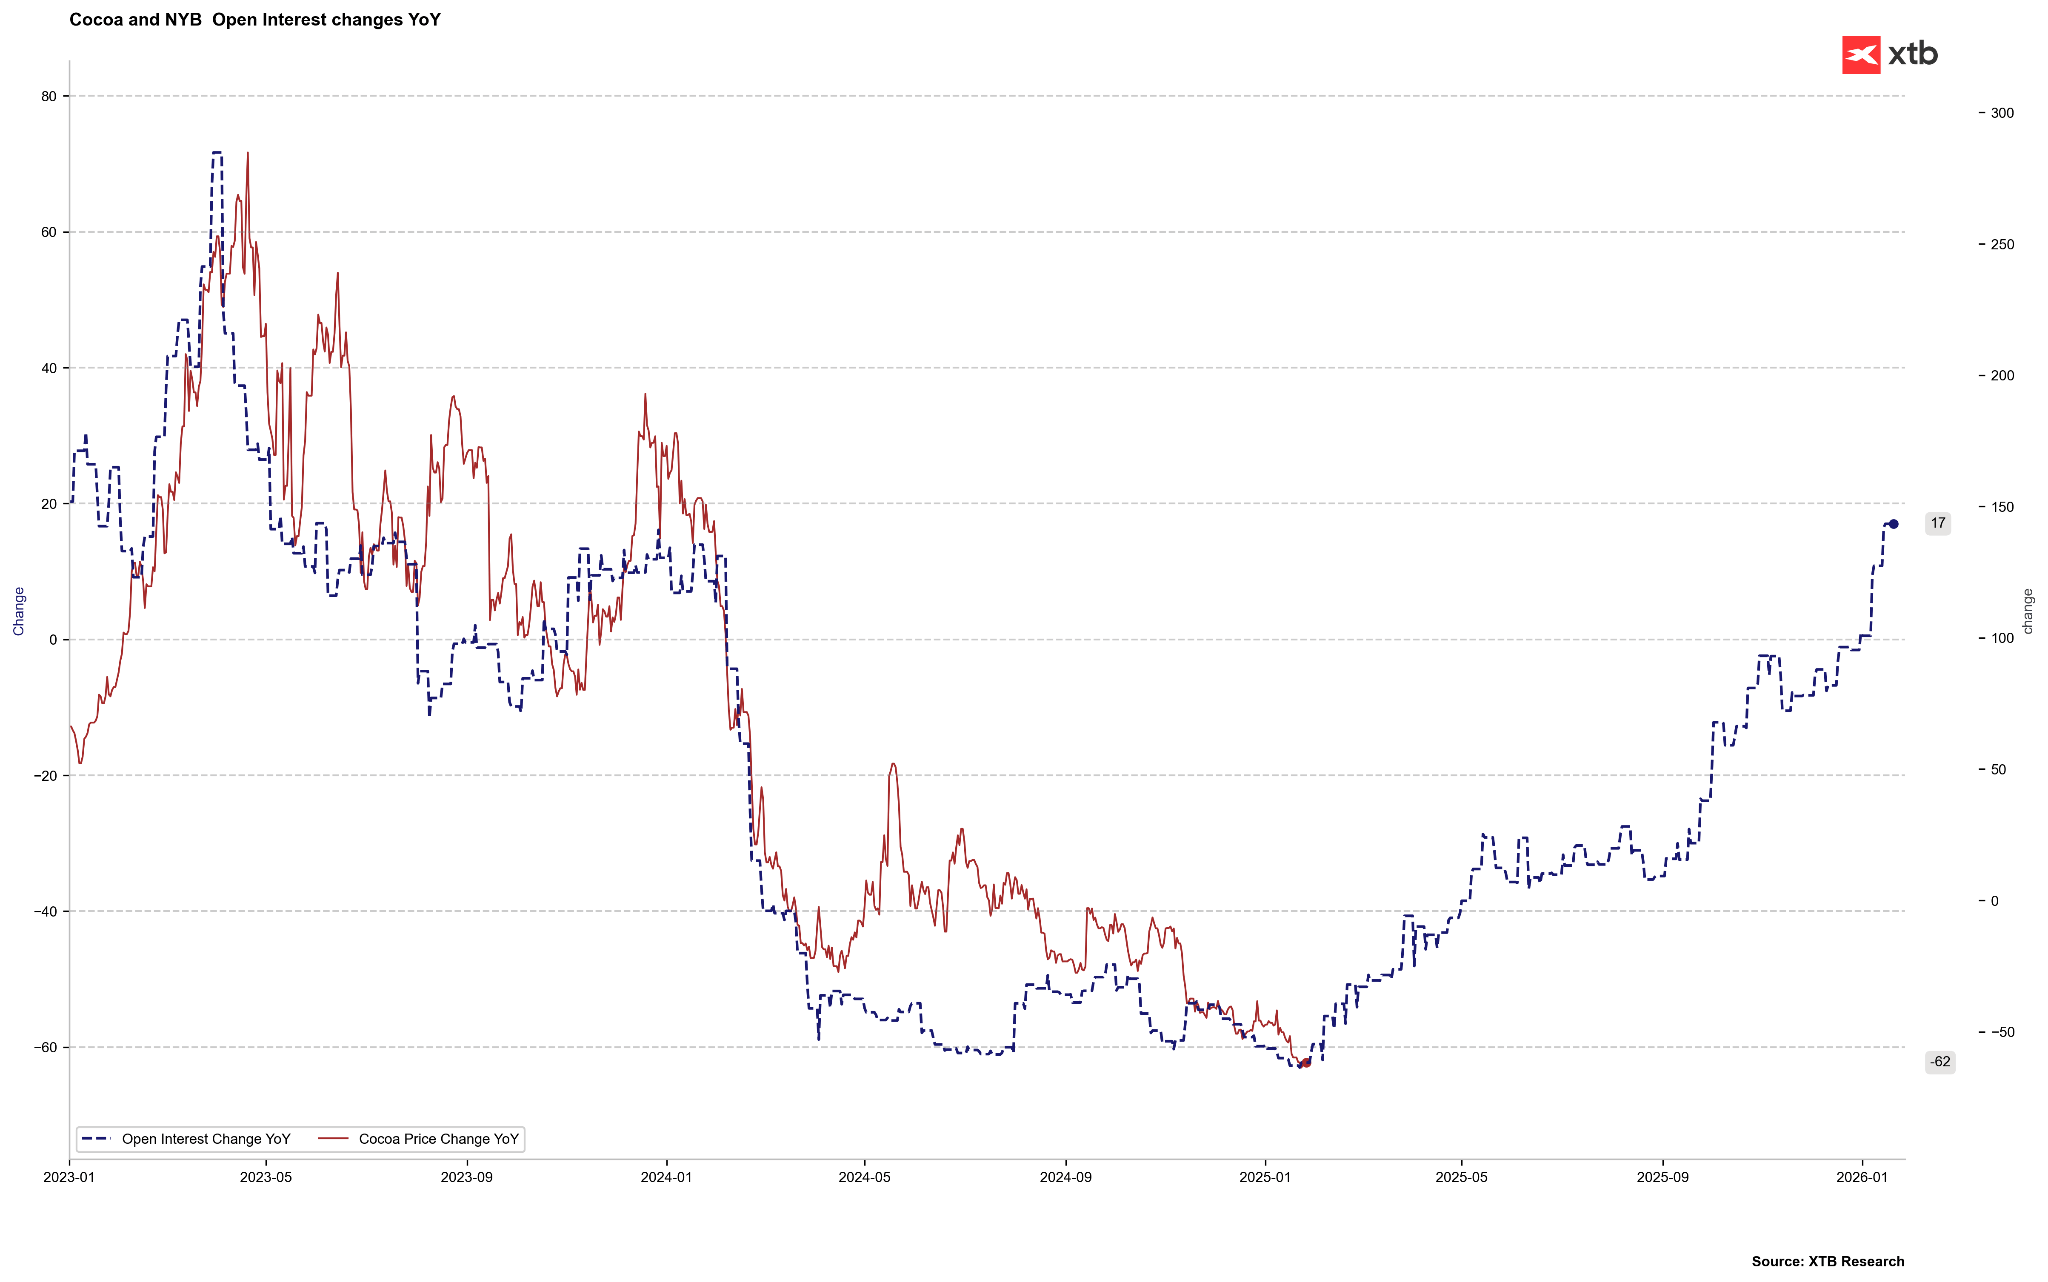 If the change in cocoa position counts were to be a leading indicator for the annual price change (which has worked relatively well since 2023), the significant recovery in the futures market suggests that the annual change around May should be close to zero. In May, we recorded cocoa prices around $9,000 per tonne. Currently, the July contract, which will be traded in May, is priced at approximately $4,500 per tonne. Six months ago, the July contract was priced at $4,700. Through December of this year, cocoa remains in a slight contango. Source: Bloomberg Finance LP
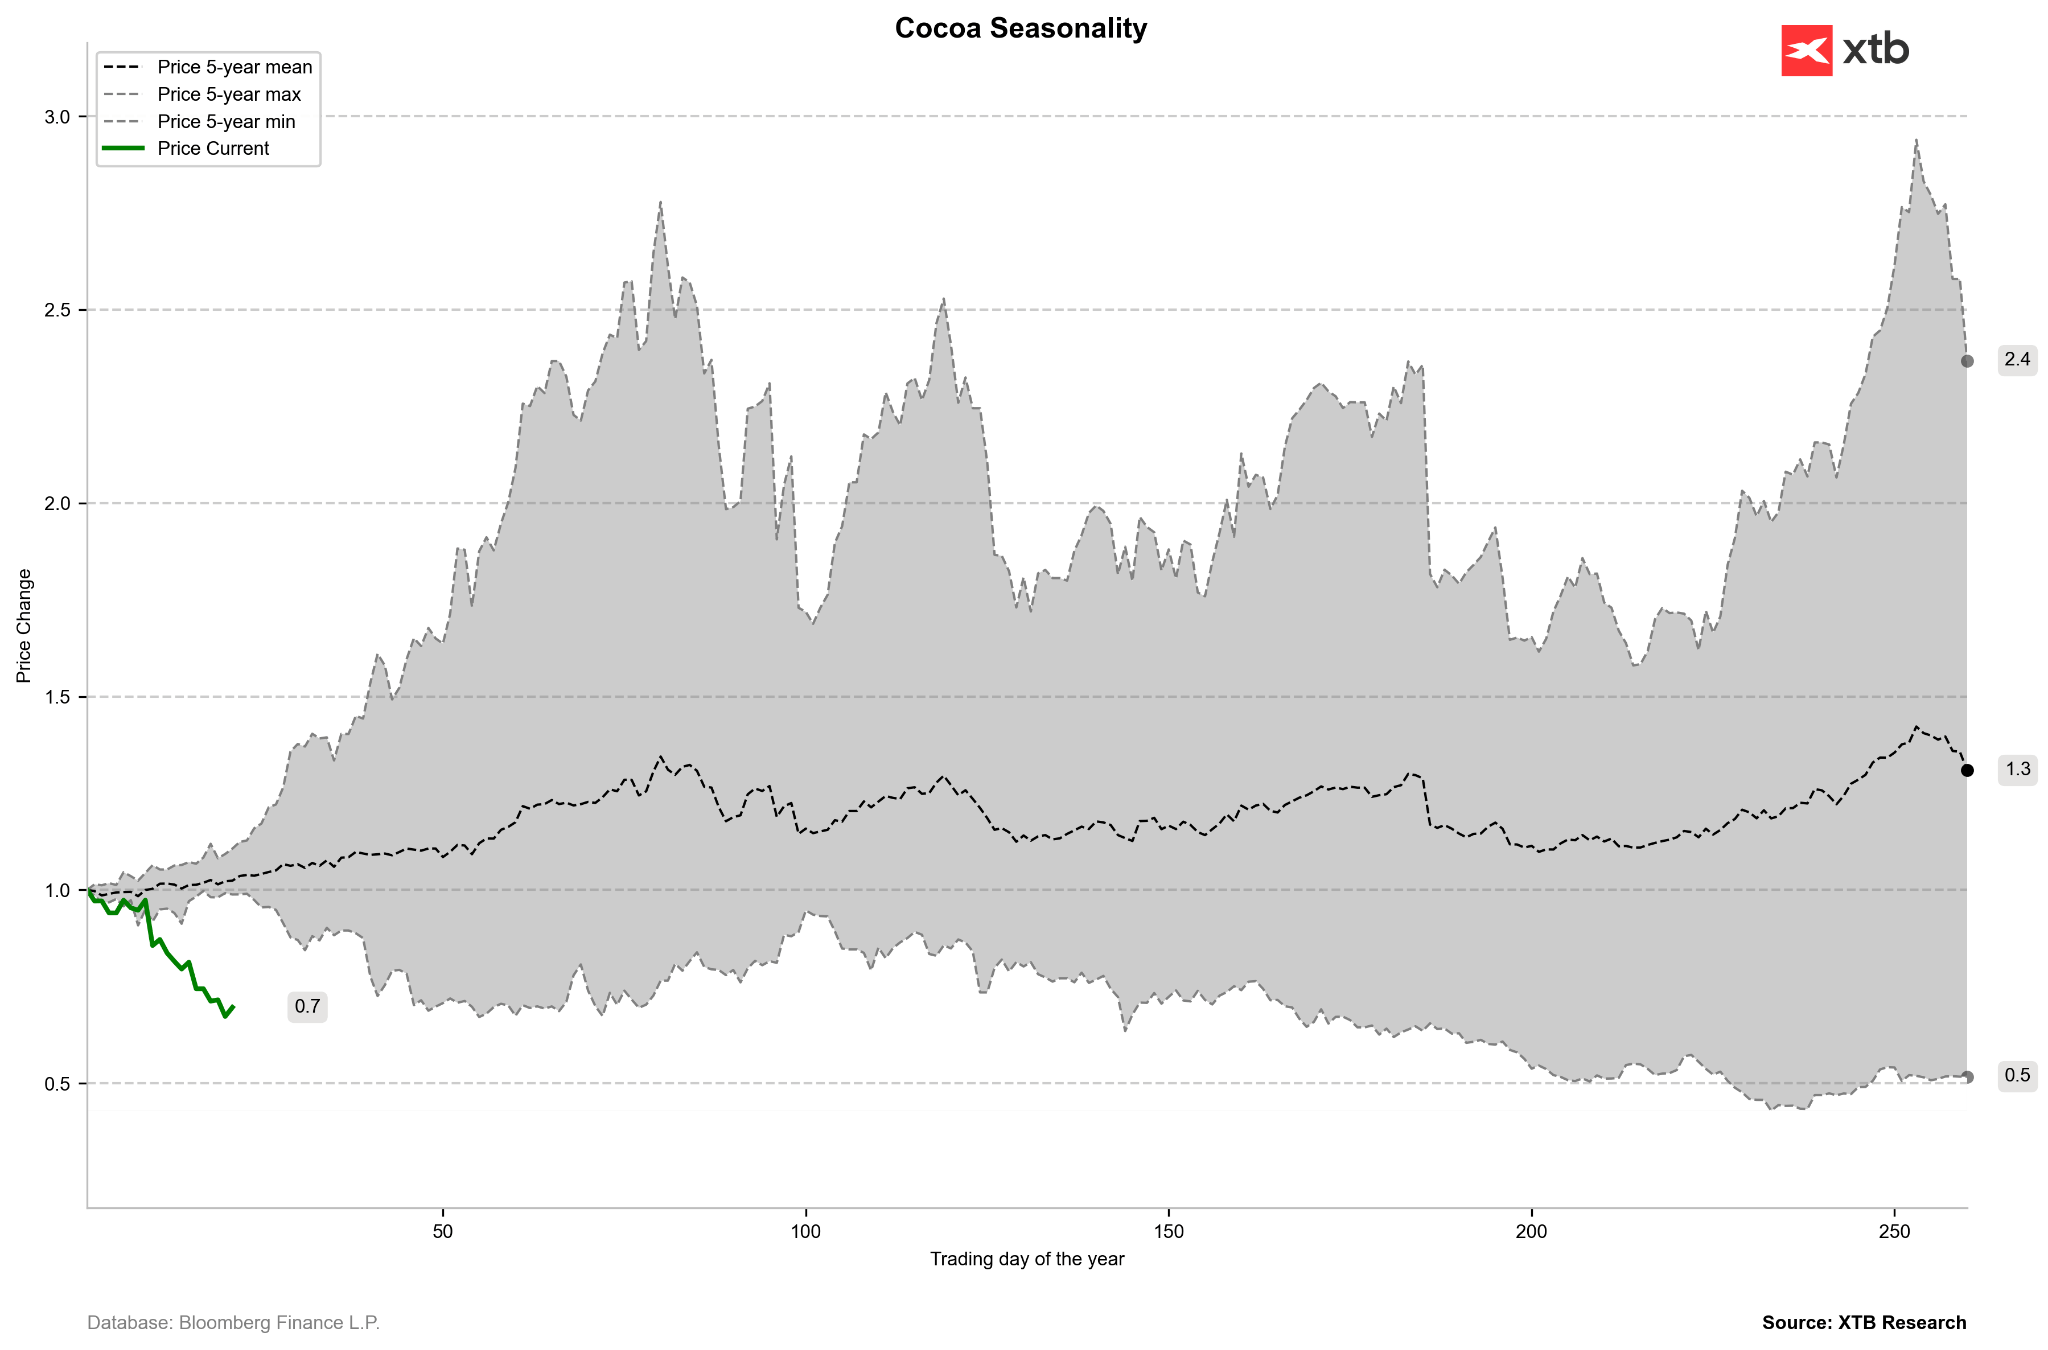 The sell-off in the cocoa market is quite strong and is reaching the maximum range for the first quarter seen in the last 5 years. Although the market is currently experiencing a significant shift, it can be expected that we should be relatively close to a local bottom. Source: Bloomberg Finance LP, XTB
The material on this page does not constitute financial advice and does not take into account your level of understanding, investment objectives, financial situation or any other specific needs. All information provided, including opinions, market research, mathematical results and technical analyzes published on the Website or transmitted To you by other means, it is provided for information purposes only and should in no way be construed as an offer or solicitation for a transaction in any financial instrument, nor should the information provided be construed as advice of a legal or financial nature on which any investment decisions you make should be based exclusively To your level of understanding, investment objectives, financial situation, or other specific needs, any decision to act on the information published on the Website or sent to you by other means is entirely at your own risk if you In doubt or unsure about your understanding of a particular product, instrument, service or transaction, you should seek professional or legal advice before trading. Investing in CFDs carries a high level of risk, as they are leveraged products and have small movements Often the market can result in much larger movements in the value of your investment, and this can work against you or in your favor. Please ensure you fully understand the risks involved, taking into account investments objectives and level of experience, before trading and, if necessary, seek independent advice.