S&P 500 — US Large Cap Index
 FTSE 100 — UK Blue Chips
 Euro Stoxx 50 — Eurozone Leaders
 DAX 40 — German Equities
 CAC 40 — French Market Index
 Nikkei 225 — Japan Benchmark
 Hang Seng — Hong Kong Index
 Shanghai Composite — China Mainland
 ASX 200 — Australian Market
 TSX Composite — Canada Index
 Nifty 50 — India Large Cap
 STI Index — Singapore Market
 KOSPI — South Korea Index
 Bovespa — Brazil Equities
 JSE Top 40 — South Africa Index
 IPC Index — Mexico Market

Key takeaways
- European natural gas trades with strong gains while crude oil prices face supply pressure.
- US natural gas futures hover near 3.0 USD/MMBtu amid low storage surpluses and rising LNG exports.
- Cocoa prices rebound due to projected production drops in Ivory Coast and Ghana.
- Spot gold trades above 4.100 USD/oz as central bank buying and ETF holdings provide strong support.
- WTI crude trades near 87 USD/bbl as Middle East maritime flows and pipeline exports recover.
Commodities Overview
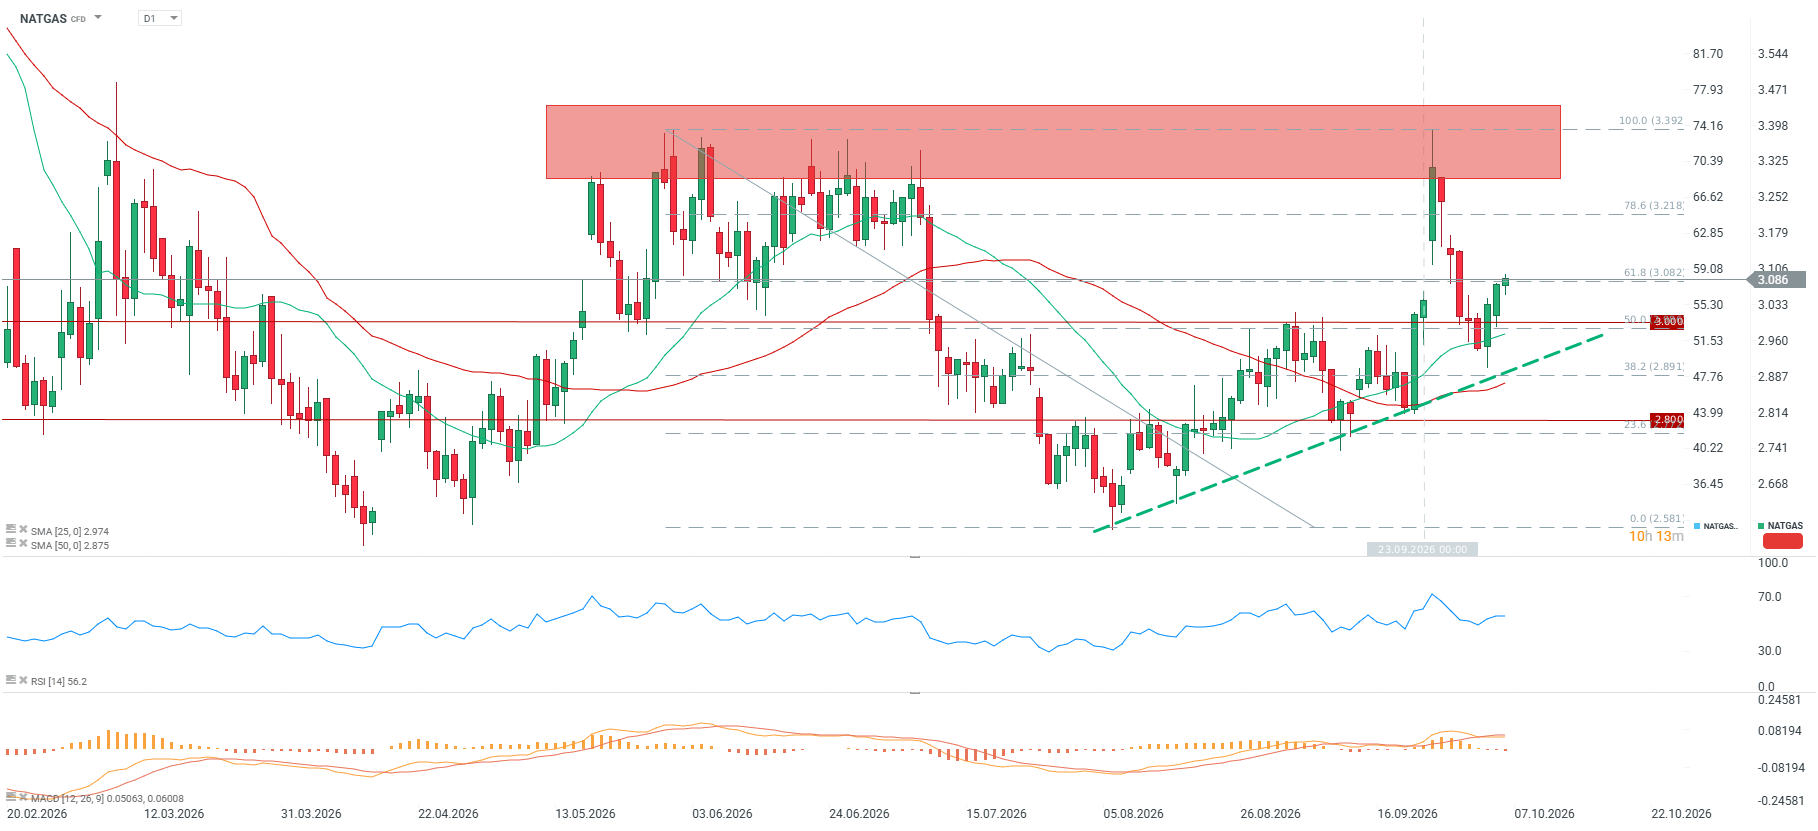
In the commodities market, we are observing a clear polarization in the energy sector, where European natural gas continues its strong wave of appreciation (+2.24% today, +162.78% YTD), while crude oil prices have come under strong supply pressure. Today’s declines in Brent crude (-3.07%) and WTI (-2.46%) deepen the correction, driven by reports of political actions in the US aimed at lowering fuel costs and key importers, such as India, seeking new supply directions.
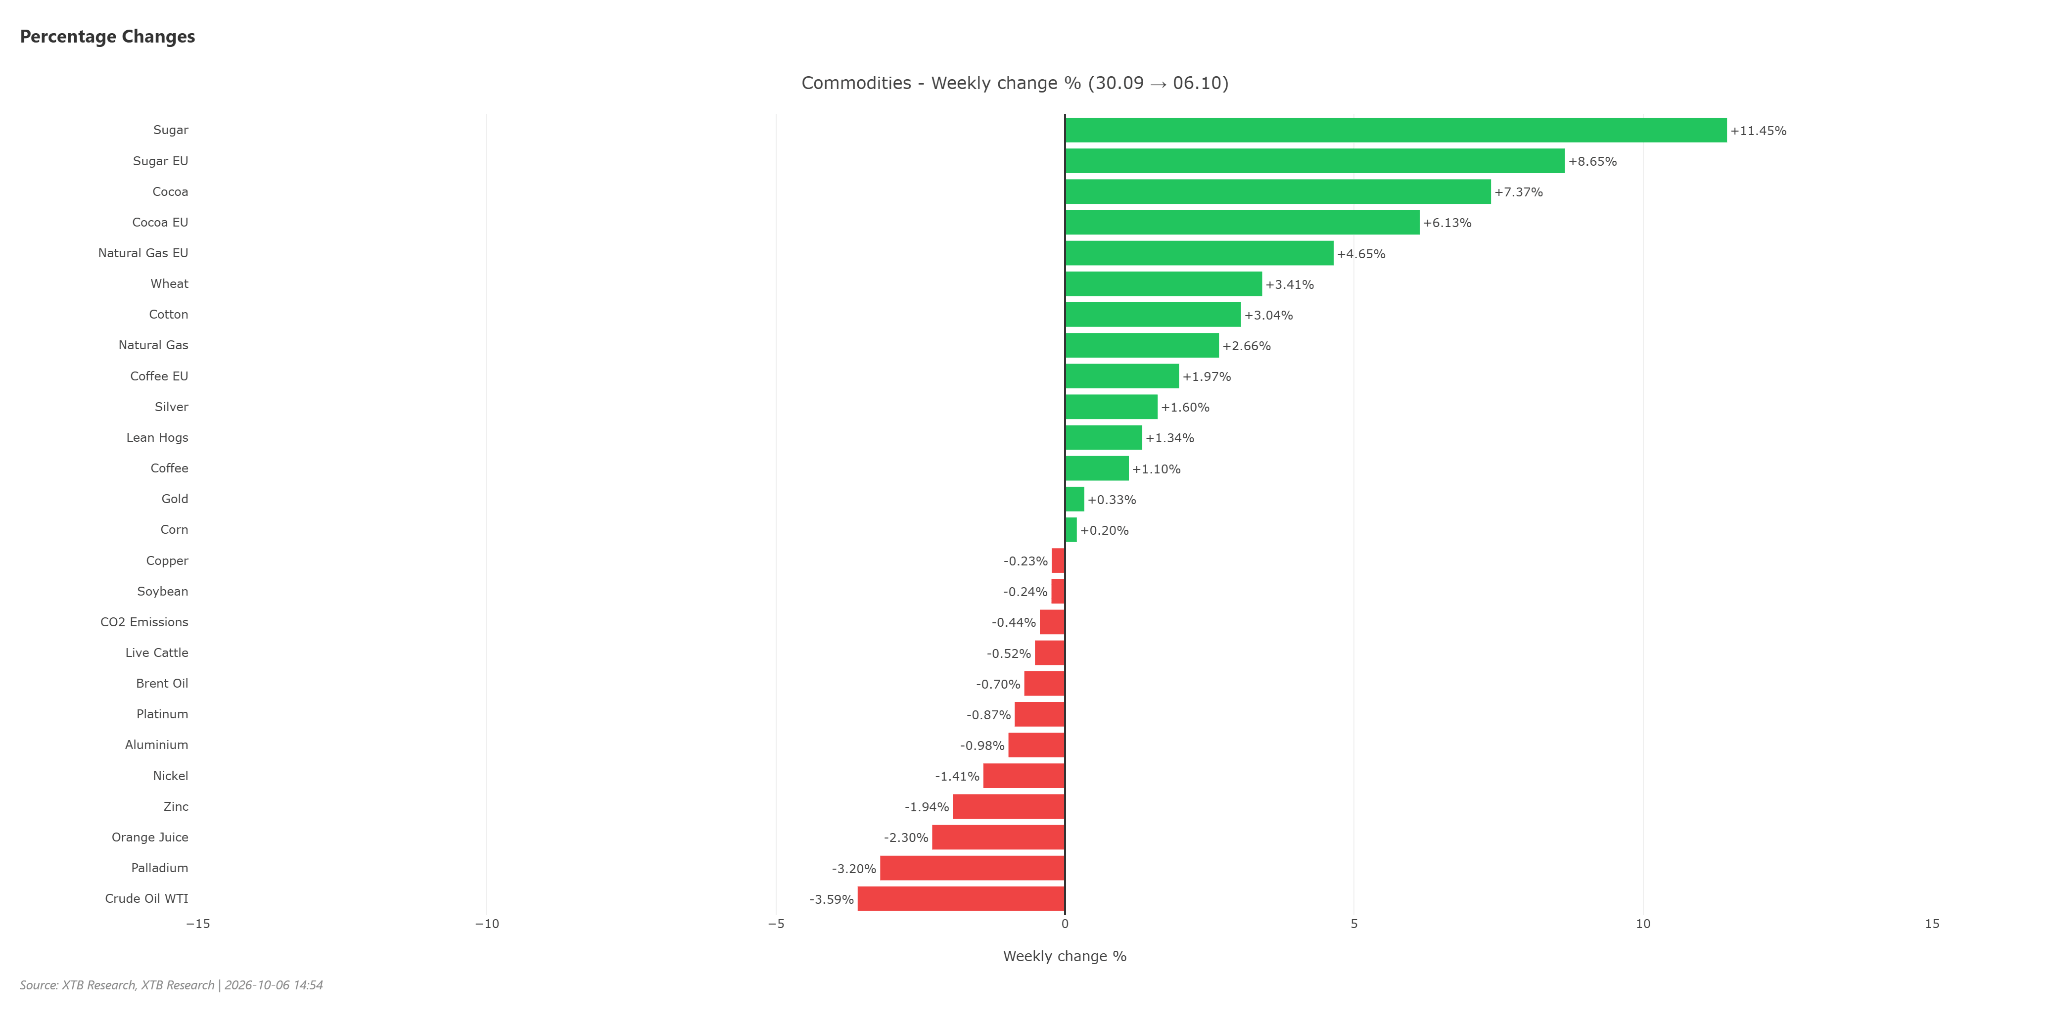
Despite the current decline, oil is still defending over 50% gains year-to-date, contrasting with the orange juice market, where today’s rise (+1.90%) is merely a temporary rebound in a deep downtrend (-24.48% YTD). Among industrial commodities, extremely high valuations stand out – copper is trading at +2.58σ above its 5-year average, and zinc reaches +1.56σ, confirming strong structural demand for base metals. At the opposite extreme, lean hogs remain at -1.62σ from the long-term average, while European cocoa, after a dynamic weekly rebound (+6.13%), returned to declines today (-2.43%). In the near term, key for investors will be monitoring the sustainability of the correction in the crude oil market and the ability of industrial metals to maintain such high valuation premiums in a volatile macroeconomic environment.
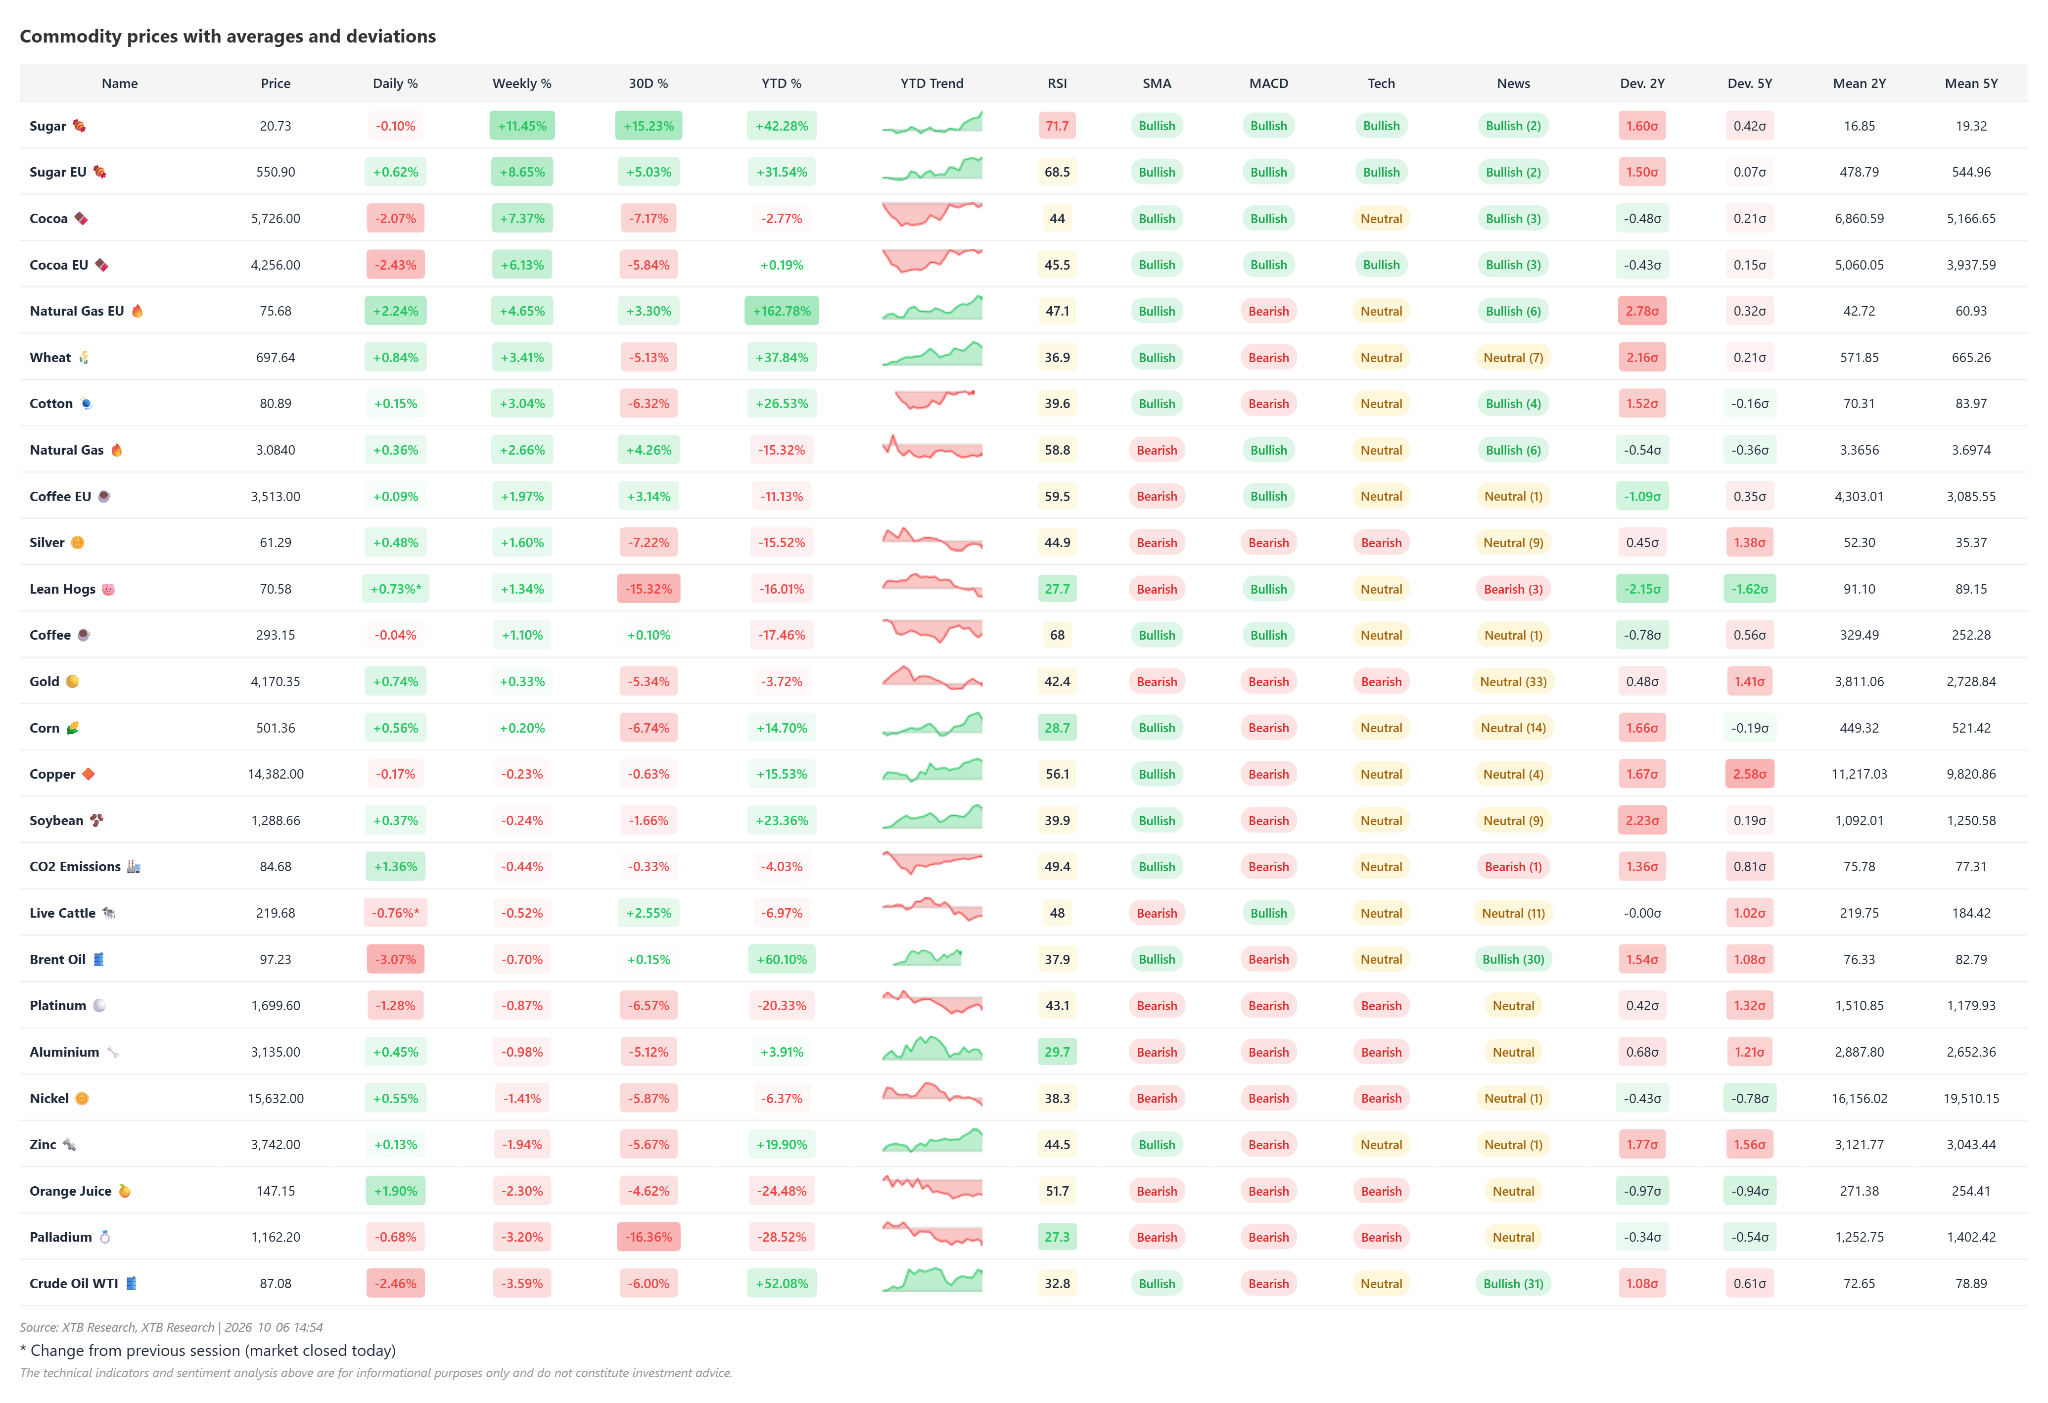
The commodities sector is currently characterized by strong polarization in terms of speculator positioning: extreme overbought conditions in the agricultural segment and copper, alongside severe oversold conditions in natural gas and lean hogs. Concurrently, commercials (hedgers) hold positions heavily opposing speculators, which, combined with stretched prices, increases the risk of a turning point across key markets.
- Sugar (Double Overbought Extreme): Speculator positioning is stretched to the upside, accompanied by severe price overheating. Commercials are hedging with aggressive short positions, creating textbook conditions for rapid profit-taking.
- Lean Hogs (Extreme Oversold and Divergence): Speculator positioning is scraping historical lows (net -76.2k, z2Y = -2.25, 0.0% percentile), and prices are deeply depressed (z-price1Y = -1.97, 1M -15.3%). However, a divergence emerged this week – prices rebounded +3.0% despite further fund selling (-7.9k), while commercials hold a record net long (+72.0k, z = 2.19), foreshadowing a bottom formation or short squeeze.
- Natural Gas (Crowded Short Side): Speculators expanded short positions by another -14.5k (-0.3σ), pushing net positioning to -231.0k. A clear divergence exists – despite fund pessimism, prices are rising while producers/hedgers accumulate contracts, creating asymmetric short-squeeze risk.
- Soybean Meal, Corn, and Soybeans (Speculative Capital Exhaustion): Soybean meal remains extremely overbought. Meanwhile, corn (-26.3k) and soybeans (-24.7k) show capital outflows alongside falling prices (corn 1W -4.0%), confirming a downtrend and profit-taking against a massive commercial short position (-448.5k in corn).
- COMEX Copper (Lack of Price Reaction to Crowding): Speculators are stretched near peak levels (net 85.4k, z2Y = 1.85, 99.8% percentile, 76% long), yet price momentum has completely faded (1W 0.0%, 1M -0.3%). Commercials maintain a large net short position (-94.8k, z = -1.70); the absence of new price highs amid such one-sided positioning poses a risk of correction.
- Brent vs. WTI Crude (Largest Weekly Dynamics): Brent experienced the strongest weekly shift in positioning, rising +8.5k (+0.7σ, price +2.4%), reducing fund short exposure. The opposite occurred in WTI, where speculators pulled back -31.6k net (-0.5σ), reacting to weaker price performance (-1.8% 1W).
The greatest risk of a painful downward correction is accumulating in sugar and soybean meal, whereas the largest asymmetric opportunity for a strong upward recovery appears in lean hogs and natural gas, where commercial hedgers are accumulating dips against exhausting speculative supply.
Natgas
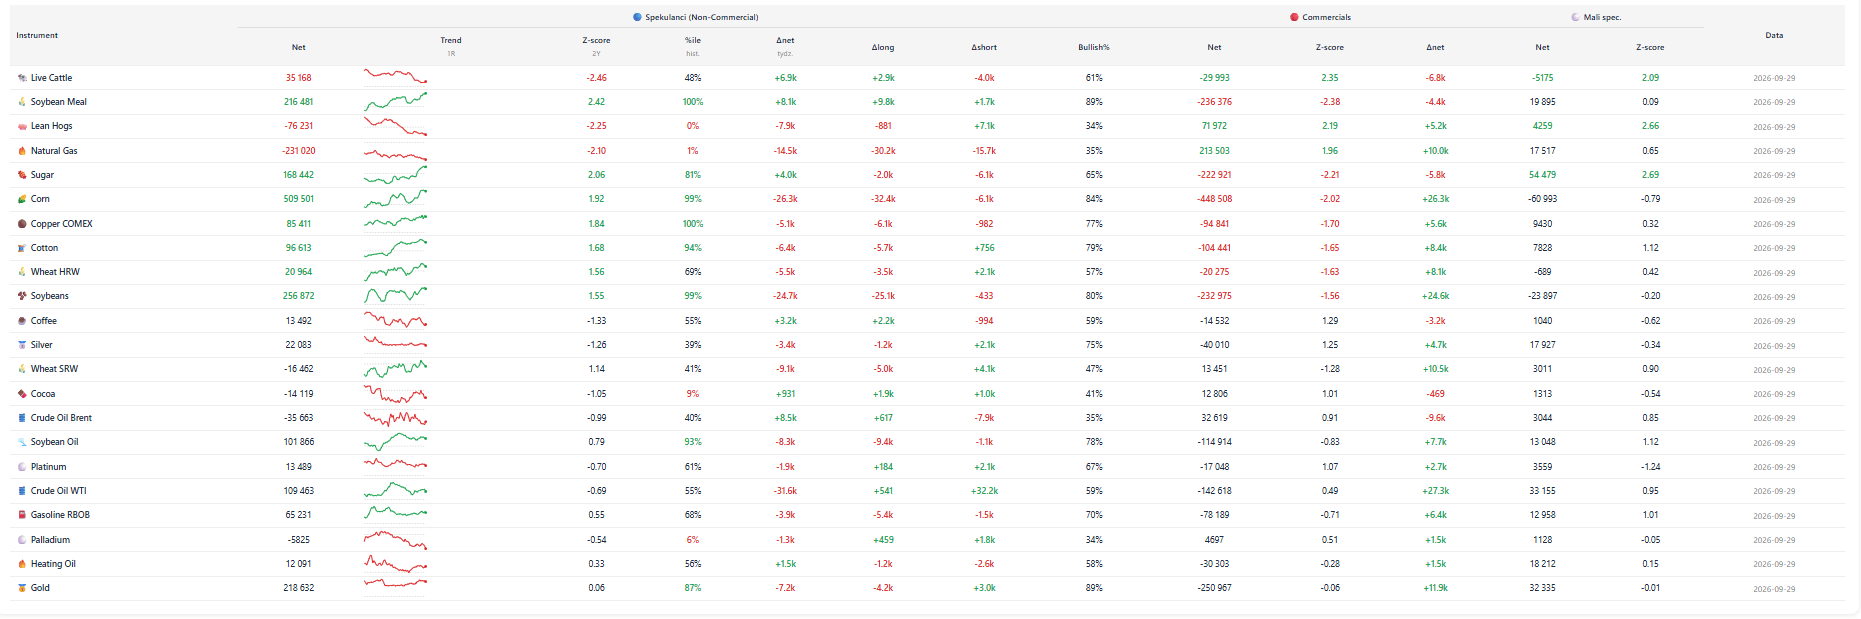
- US natural gas prices (NATGAS) are trading close to 3.0 USD/MMBtu, recording a positive weekly return of +2.40% and a monthly gain of +3.99%, while maintaining clear negative long-term dynamics: -15.54% year-to-date (YTD) and -12.56% over the last twelve months.
- The market sits 7.00% above its 50-period moving average, though overall trend indicators (SMA and MACD) continue to generate bearish signals, with a neutral RSI standing at 58 points.
- Key technical support is defined by the psychological zone around 3.000 USD/MMBtu, a break of which opens room to test 2.850 USD/MMBtu.
- In turn, the nearest market resistance concentrates near 3.230 USD/MMBtu, and clearing it would allow a test of local highs around 3.350 USD/MMBtu.
Fundamental and Market Context
- The weekly US natural gas storage report showed an injection of 64.00 billion cubic feet (bcf), signaling an acceleration in injection pace relative to the prior reading of 53.00 bcf. However, this remains slightly below average, bringing inventories closer to the 5-year average.
- Market analysts estimate that the US natural gas storage surplus relative to the five-year average compressed to 2.4% for the week ending September 25, down from 2.9% recorded the previous week.
- Feedgas volumes delivered to nine major US liquefied natural gas (LNG) export terminals averaged 17.9 bcfd in September, rising from 17.2 bcfd in August.
- TC Energy officially lifted force majeure on the Columbia Gas Transmission Mountaineer Xpress pipeline following successful emergency repairs, enabling regional production growth and easing transport bottlenecks in the coming days.
- Meteorological models for the US project near-normal temperatures through at least October 15, significantly limiting power sector demand for both cooling and early heating during the shoulder season.
- US natural gas futures temporarily slipped below the psychological 3.00 USD/MMBtu mark in early October, hitting a multi-week low after gaining 3.1% in September but closing Q3 down 7.6%.
- The European natural gas market enters the heating season under fundamentally different conditions than the US market, facing historically low underground gas storage levels, driving a structural divergence between stable Henry Hub and European hubs.
- Tight European inventories necessitate maintaining a high price premium over the US, encouraging maximum utilization of regasification capacity and a steady drain of US gas through Gulf Coast liquefaction infrastructure.
- US transmission capacity remains under pressure from rising shale supply, which, in the absence of weather extremes in early October, forces producers to manage wellhead output flexibly while awaiting winter heating demand.
- The convergence of maintenance work at US export facilities with the autumn dip in domestic consumption limits immediate upside breakout potential in the US, shifting market balancing responsibility onto LNG cargo loadings bound for Europe.
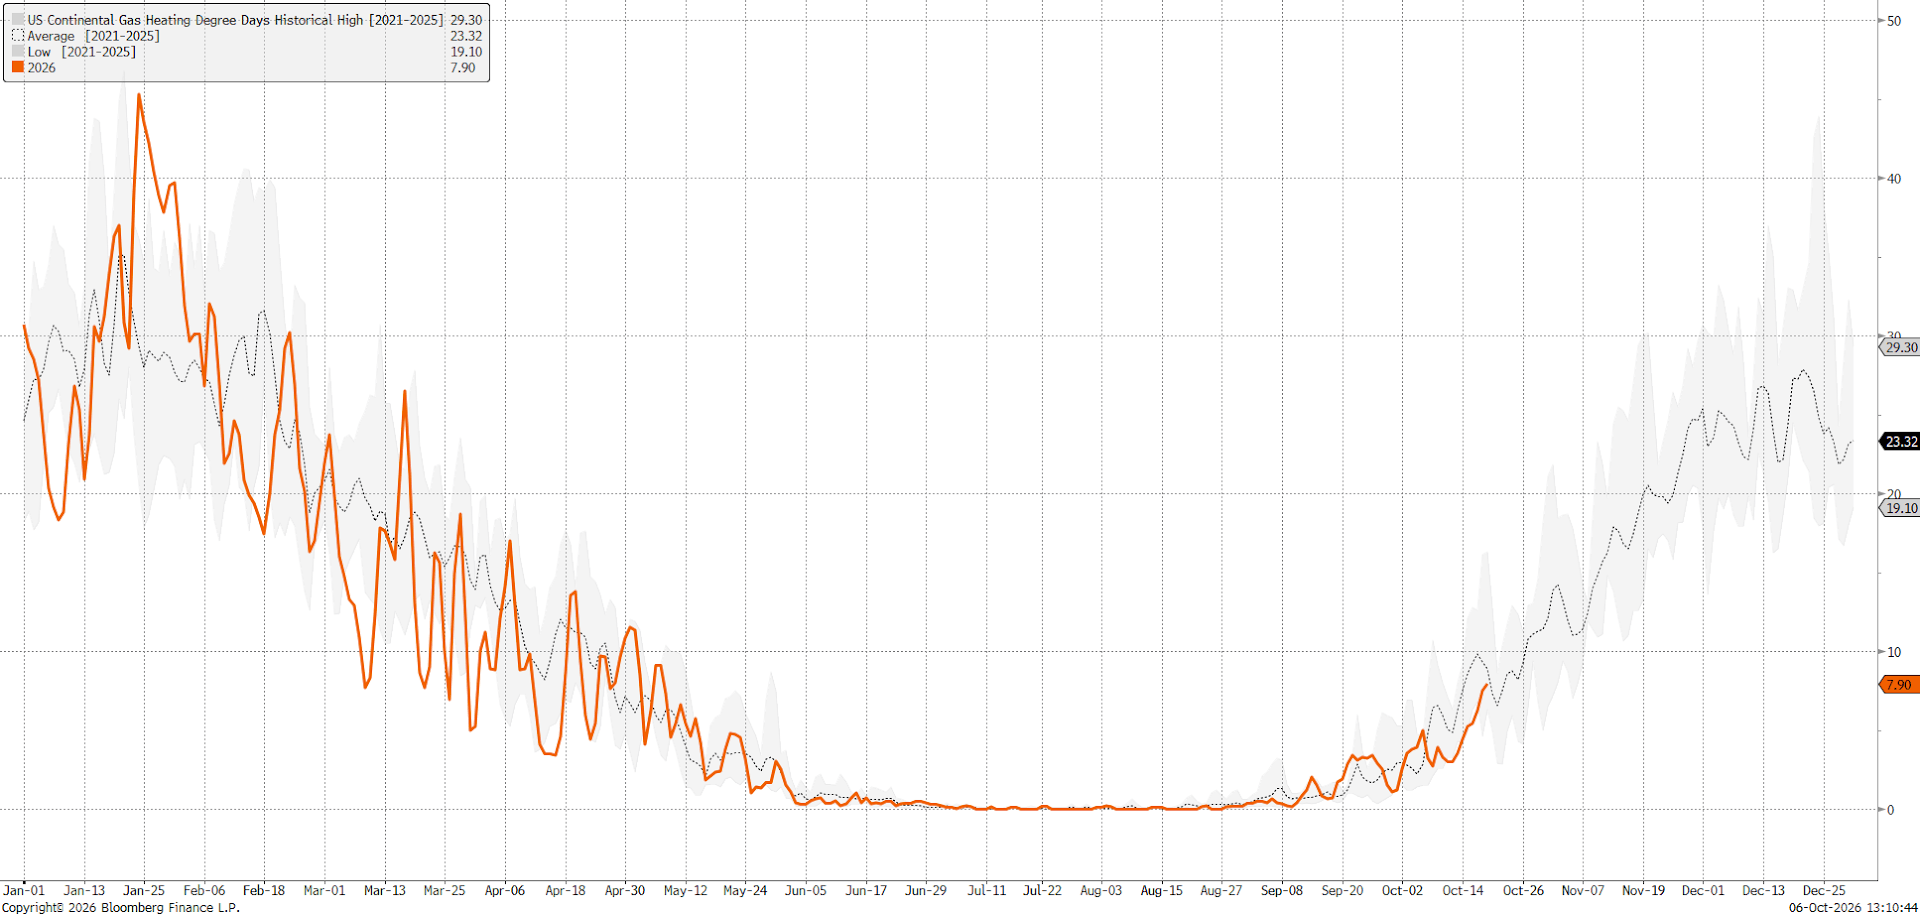
Heating degree days remain below the 5-year average, pointing to potentially lower gas usage. However, increased gas flow to LNG terminals reduces storage injection capacity. Source: Bloomberg Finance LP
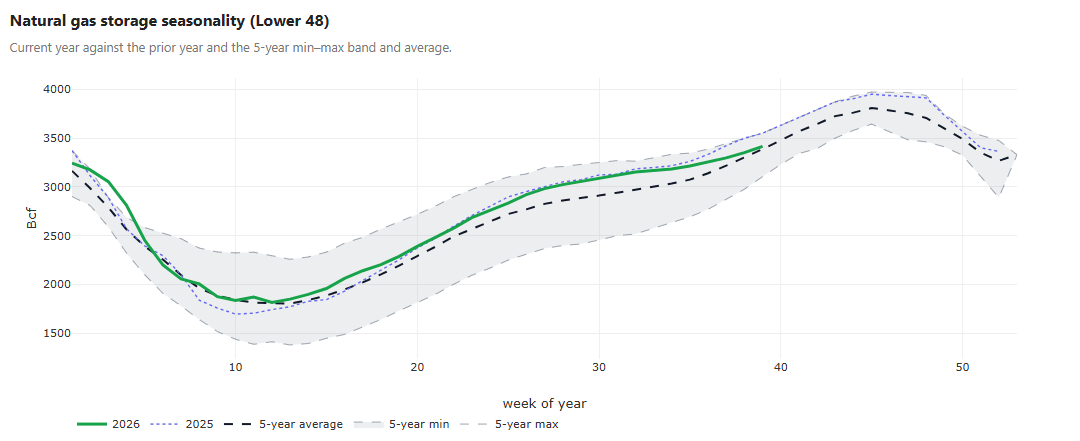
Gas inventories have approached the 5-year average, indicating that the start of the heating season could be quite interesting despite warm temperature forecasts. Source: EIA, XTB
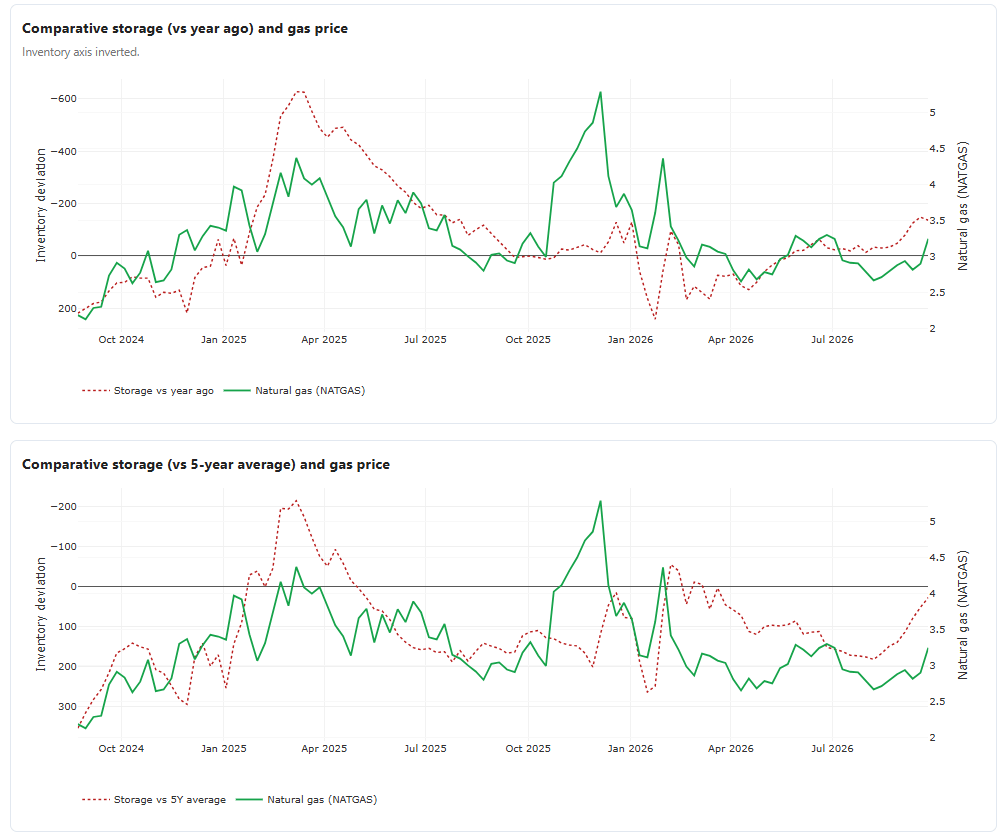
Comparative storage remains at low levels (inverted axes). Note, however, that similar situations around the turn of the year previously led to noticeable price pullbacks. Source: Bloomberg Finance LP, XTB
Historical Valuation (Z-score) and CFTC Positioning
- Standardized historical valuation metrics for natural gas futures sit in moderate undervaluation territory.
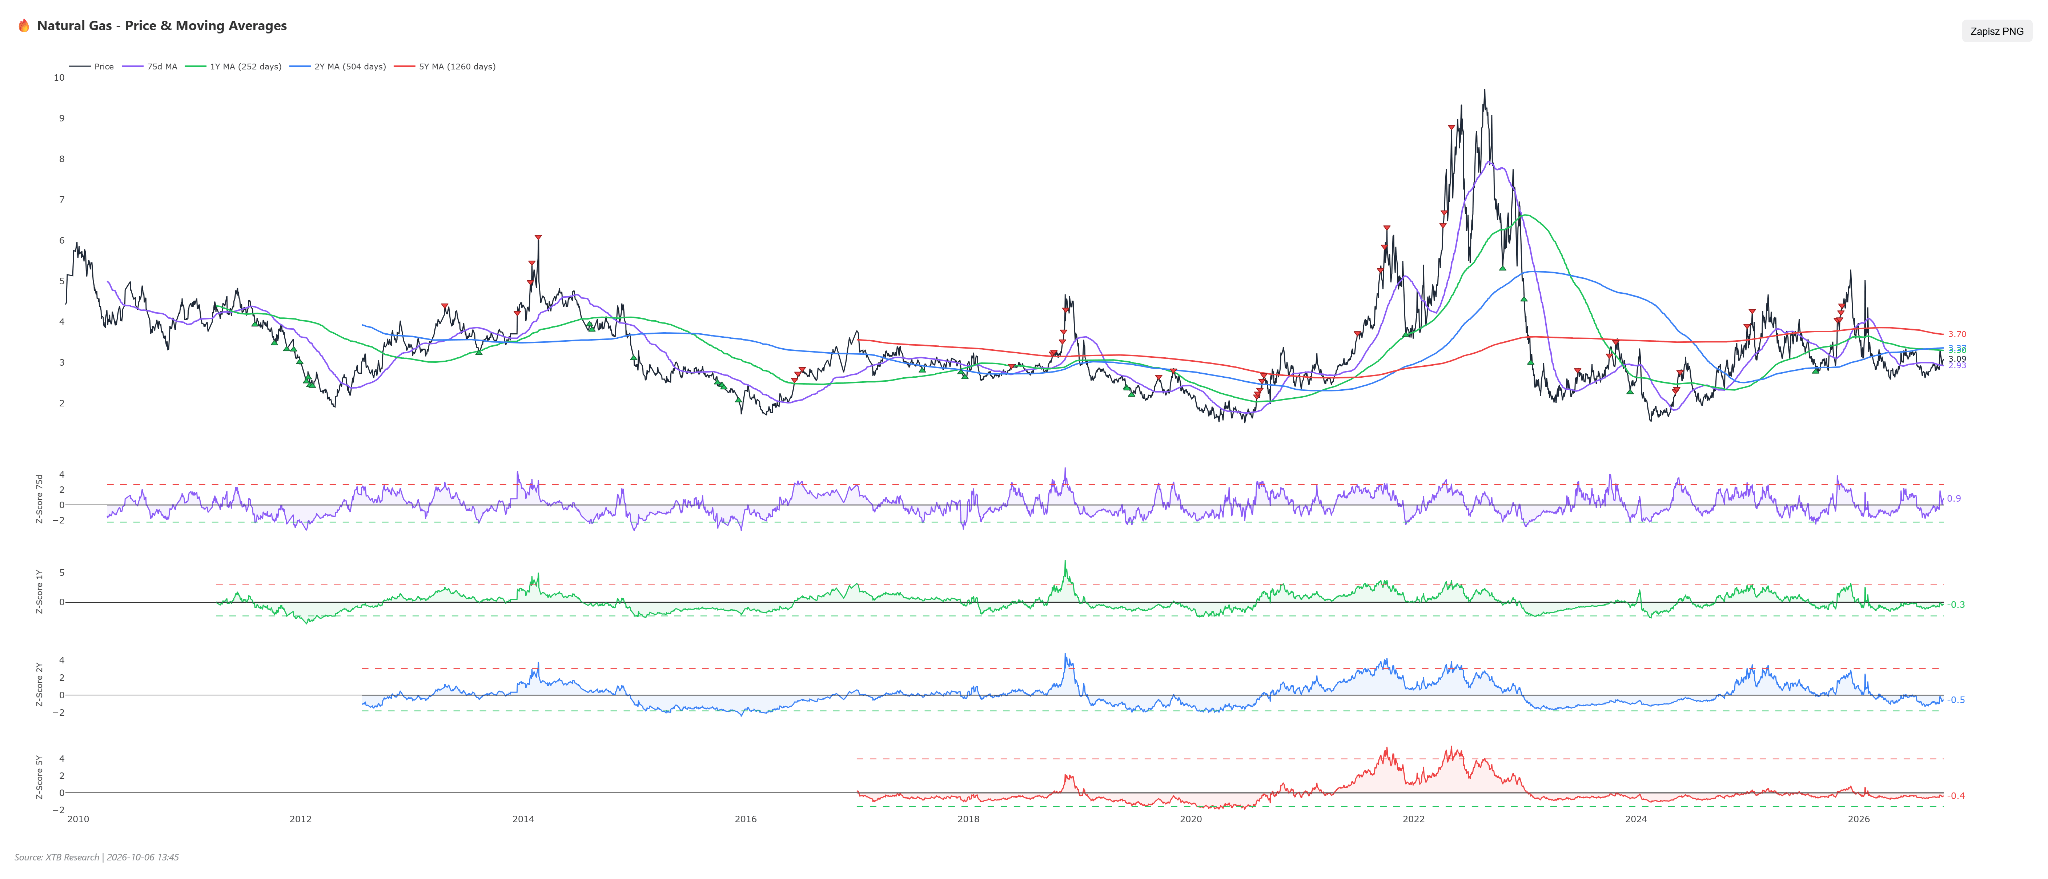
- The 1-year Z-score stands at -0.37, the 2-year metric sits at -0.55, while the 5-year horizon reaches -0.36.
- Analyzing the trajectory of the 5-year Z-score over the past six months highlights a clear valuation evolution.
- Six months ago, the index stood at a low level of -0.61 before rebounding over subsequent months to reach -0.32 three months ago. One month ago, it dipped back toward -0.46 before stabilizing and rising to its current level of -0.36.
- Currently, natural gas trades slightly above its 75-session moving average but below its 1.2-year and 5-year moving averages, with no clear signal generated.
- A starkly contrasting, extreme structure is revealed by CFTC positioning data for large speculative traders as of September 29, 2026.
- Net speculative positioning remains deeply negative at -231,020 contracts, corresponding to an extreme Z-score of -2.10 and a historical percentile of just 1.4%.
- This means speculative capital exposure on the short side is among the deepest in trading history.
- On a weekly basis, these investors expanded their negative exposure further, reducing net positioning by another 14,490 contracts, shrinking long position share to just 35.3%.
- Net positions are at their lowest levels since 2020. Short positions have decreased, but long positions are being closed more aggressively. Historically, such net levels did not necessarily signal a contrarian buy.
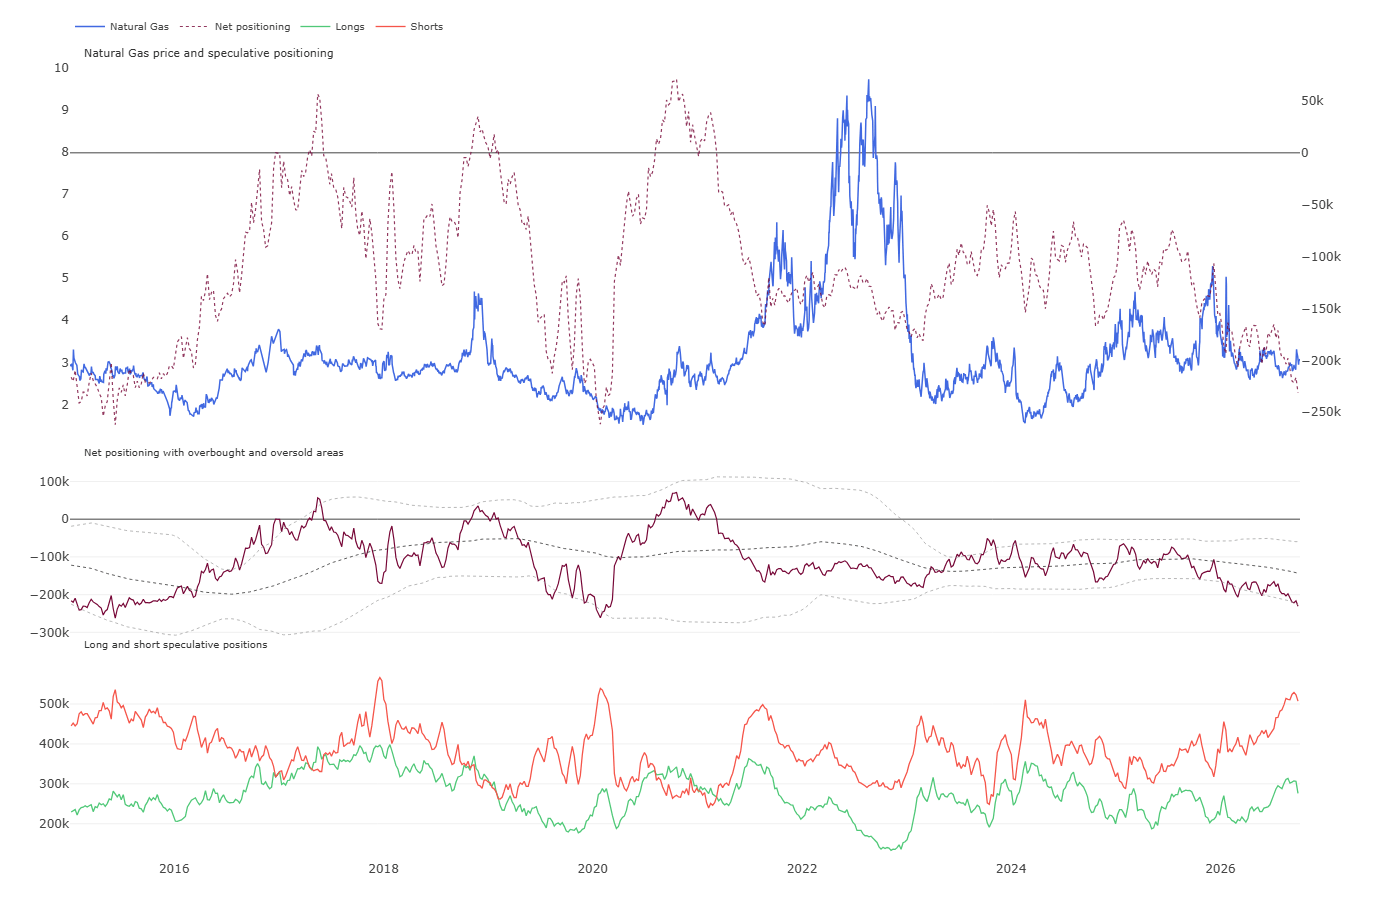
- A distinct gap exists between market valuation based on price deviations and speculative position structure.
- While Z-scores suggest only moderate price undervaluation relative to multi-year averages, fund positioning in futures reflects extreme, near-unprecedented pessimism.
- This setup creates a powerful risk asymmetry skewed toward a rapid upward rally.
- With short positions so heavily accumulated, any unexpected fundamental impulse—such as early cold snaps or escalating supply issues in Europe—poses an immediate short squeeze threat, forcing panic buybacks from speculative funds.
Scenarios
- Bullish Scenario: Sustaining upward pressure requires early winter cold snaps in North America to rapidly boost heating demand and break current neutral temperature profiles. Concurrently, a key catalyst will be LNG export growth above 18.0 bcfd, driven by the critical need to refill depleted European storage before peak winter. Technically, clearing and closing a daily candle above resistance at 3.230 USD/MMBtu would trigger short covering by hedge funds (short squeeze), opening a direct path toward testing 3.550 USD/MMBtu and eventually the psychological 3.900 USD/MMBtu barrier.
- Bearish Scenario: The downside case materializes if mild weather persists deep into late October, preventing heating demand from developing and keeping weekly storage injections above 70–80 bcf. Additional supply pressure would come from fully restored capacity on the Mountaineer Xpress pipeline and any unplanned outages at LNG export terminals, trapping gas in the domestic market. Technically, breaking down from the current consolidation below 3.000 USD/MMBtu would invalidate short-term gains, pushing NATGAS futures down to support at 2.850 USD/MMBtu, and under continued supply dominance, toward 2.620 USD/MMBtu.
Cocoa
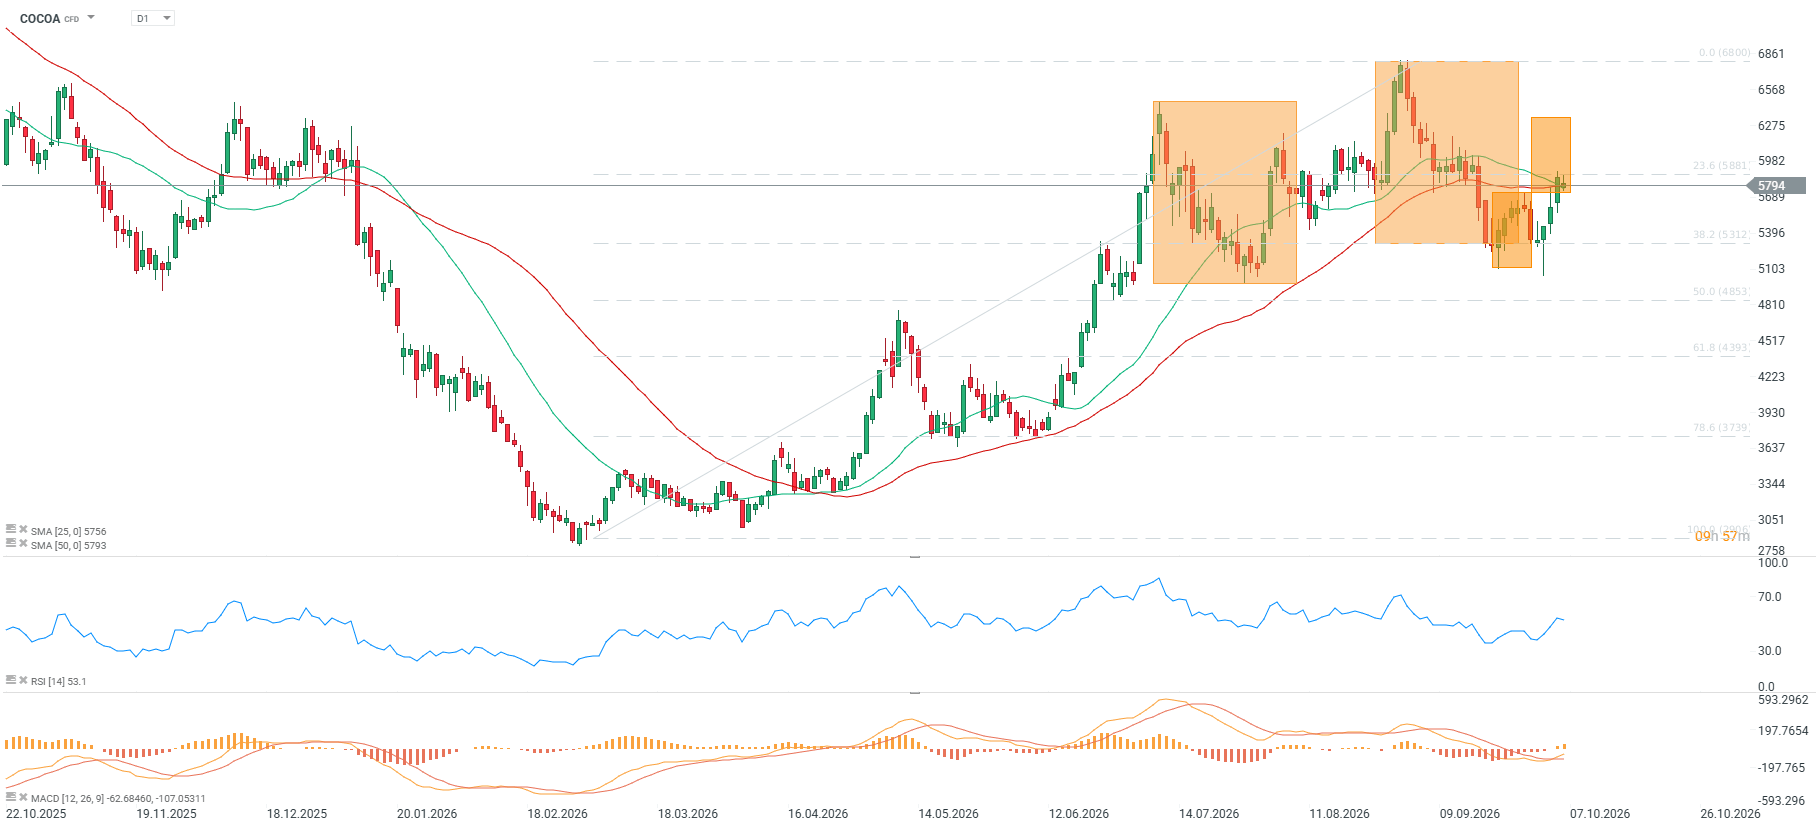
- Cocoa prices stand at 5,777.0 USD/t, recording a noticeable weekly rebound of +8.33%, alongside monthly declines of -6.34%, -1.90% year-to-date, and -5.94% year-over-year.
- RSI at 45 points indicates neutral market conditions with room for further movement, while moving average (SMA) signals and MACD have generated bullish indications.
- Prices are consolidating just below a key moving average, showing a -0.28% deviation relative to the 50 SMA.
- The nearest major technical resistance sits in the 5,950–6,000 USD/t zone, while key support is marked around 5,400–5,500 USD/t, whose defense sparked a wave of short covering.
- Cocoa is breaking out of a potential neckline near 5,700 and attempting to breach the 25 and 50 SMAs. If successful, pattern projections point to an upside target as high as 6,300.
Fundamental and Market Context
- Cocoa production in Ivory Coast for the upcoming 2026/27 season is projected to drop about 20% to 1.75 million tons, serving as the main driver behind recent price rebounds.
- Early October arrivals show low volumes, but this stems from logistical issues and does not yet represent full early-season data.
- Harvests in Ghana, the world’s second-largest producer, are forecasted at 650,000 tons for the 2026/27 season, representing a 13% YoY supply decline due to growing weather risks.
- An unusually strong El Niño poses a direct threat of intensifying dry Harmattan winds starting November 2026, which could further deplete soil moisture and damage flowers during a critical crop phase.
- Short-term supply pressure is cushioned by high availability of old-crop cocoa following a large global surplus in 2025/26 and warehouse stocks at a two-year high of 3.43 million bags.
- Heavy rains and flooding in western Ivory Coast (Kouibly region) washed out roads and destroyed bridges, paralyzing local transport and directly delaying bean deliveries from farms to export ports.
- Agrometeorological conditions in southern Ivory Coast around Agboville are more balanced, where sunny spells help farmers dry harvested beans and support ongoing crop development.
- In Ghana’s Kwabeng region, rainfall deficits were noted, but optimal soil moisture retention paired with sunshine beneficially limits fungal disease pressure, including black pod disease.
- Torrential rains in Cameroon near Yaoundé stimulated tree biomass growth but triggered widespread black pod spread and road damage, disrupting traditional sun-drying processes.
- In southwestern Cameroon, logistical hurdles and lack of sunlight forced farmers to rely heavily on drying ovens to protect bean quality from mold.
- In southwestern Nigeria around Benin City, severe storms damaged pods directly on cocoa trees, creating ideal conditions for rapid black pod expansion.
- In southeastern Nigeria around Ikom, growers are transplanting hybrid seedlings during moderate rain and sun, though harvest start dates were pushed back a month to November due to earlier rainy season delays.
- West Africa’s soft commodities sector shows deep cross-border trade disruption, constraining flows between countries at the start of the new harvest cycle.
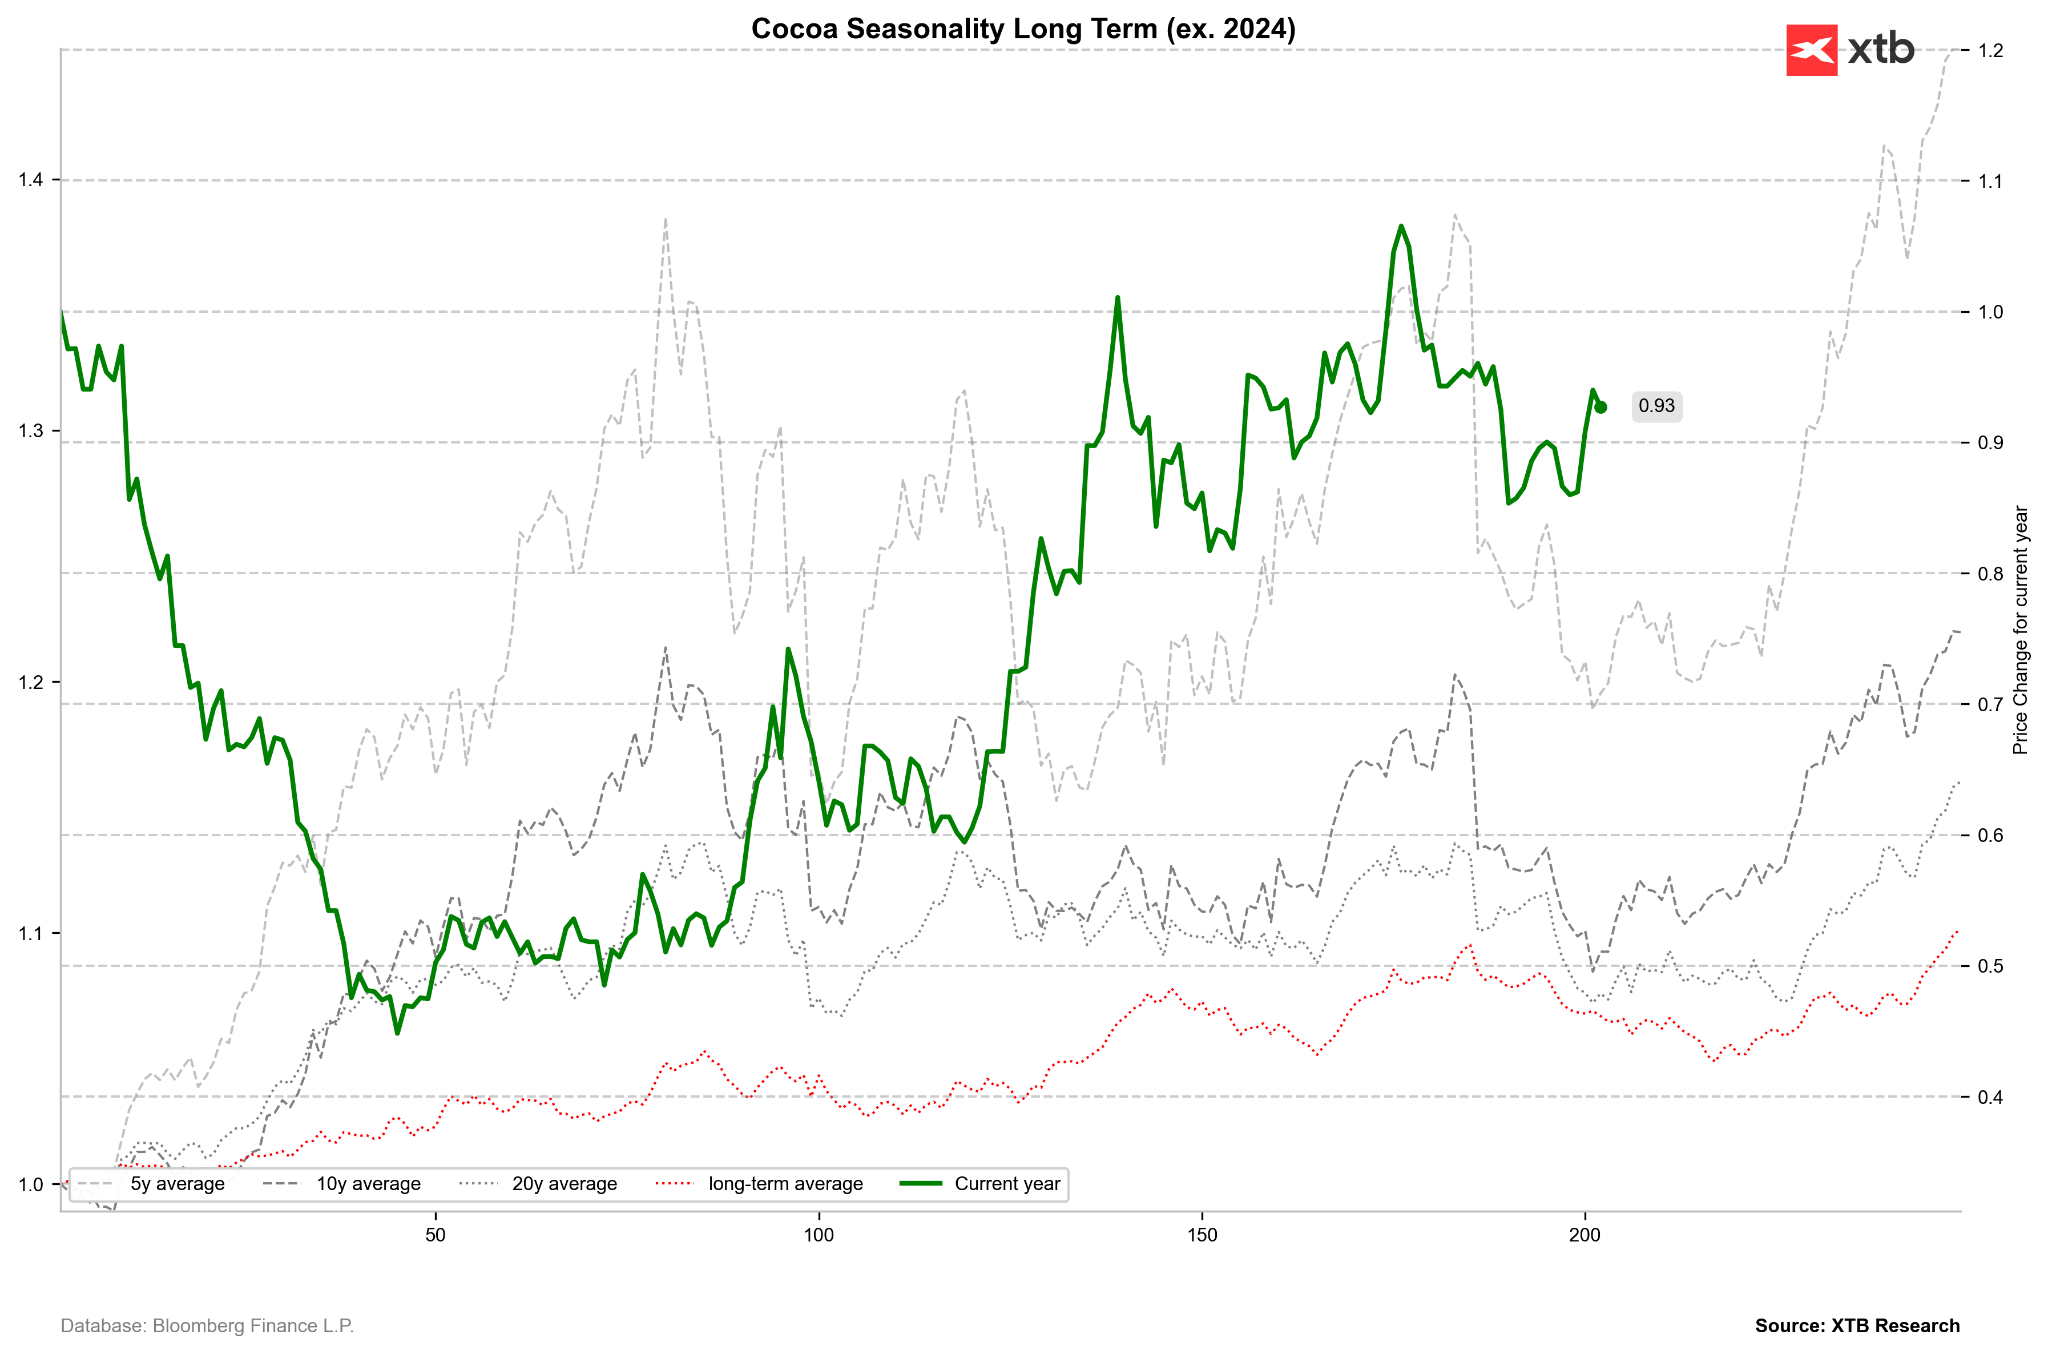
Cocoa seasonality typically points toward year-end gains. If harvests indeed deteriorate, a return to the 6,000–7,000 range remains possible before year-end. Source: Bloomberg Finance LP, XTB
Historical Valuation (Z-score) and CFTC Positioning
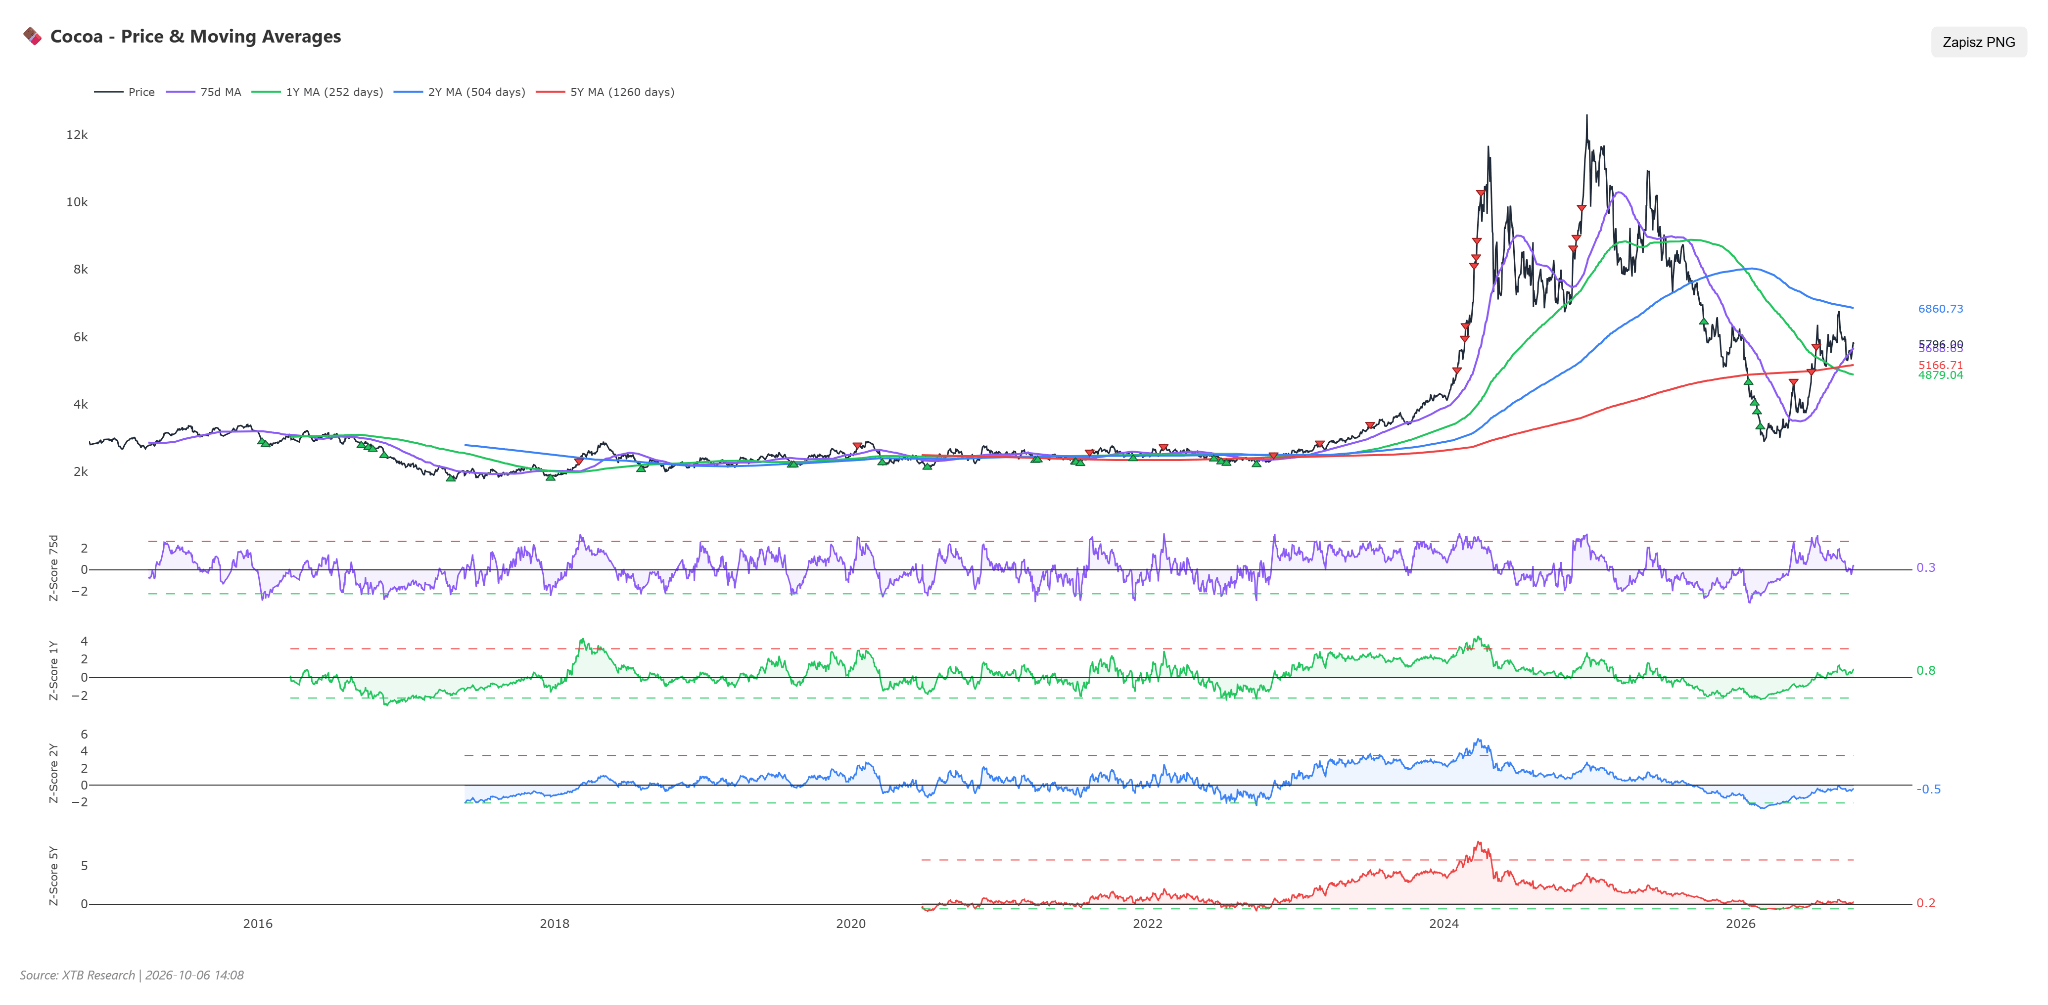
- Cocoa valuation measured by standard deviation metrics reflects elevated levels annually, with the 1-year Z-score at +0.81, while 2-year Z-score stands negative at -0.46, and 5-year valuation sits at +0.23.
- The evolution of the 5-year Z-score over the last six months shows a clear recovery trajectory: six months ago, it sat deeply negative at -0.63 before rising to slightly positive territory (+0.01) three months ago.
- The upward trend continued, reaching +0.38 one month ago before stabilizing and pulling back slightly to the current +0.23 reading.
- Crossing back above the 75-session moving average may signal growing bull strength, though historically, rebounds from this average were rare, seen only during powerful rallies in March/October 2023 and May 2024.
- CFTC data from September 29, 2026, shows speculative investors maintaining a heavy net short position of -14,119 contracts.
- This positioning corresponds to a Z-score of -1.05 and a historical percentile of just 8.6%, illustrating that leveraged fund exposure is unusually depressed.
- Long position share stands at a modest 40.6%, though in the latest report, speculators paused short expansion and bought back 931 contracts net.
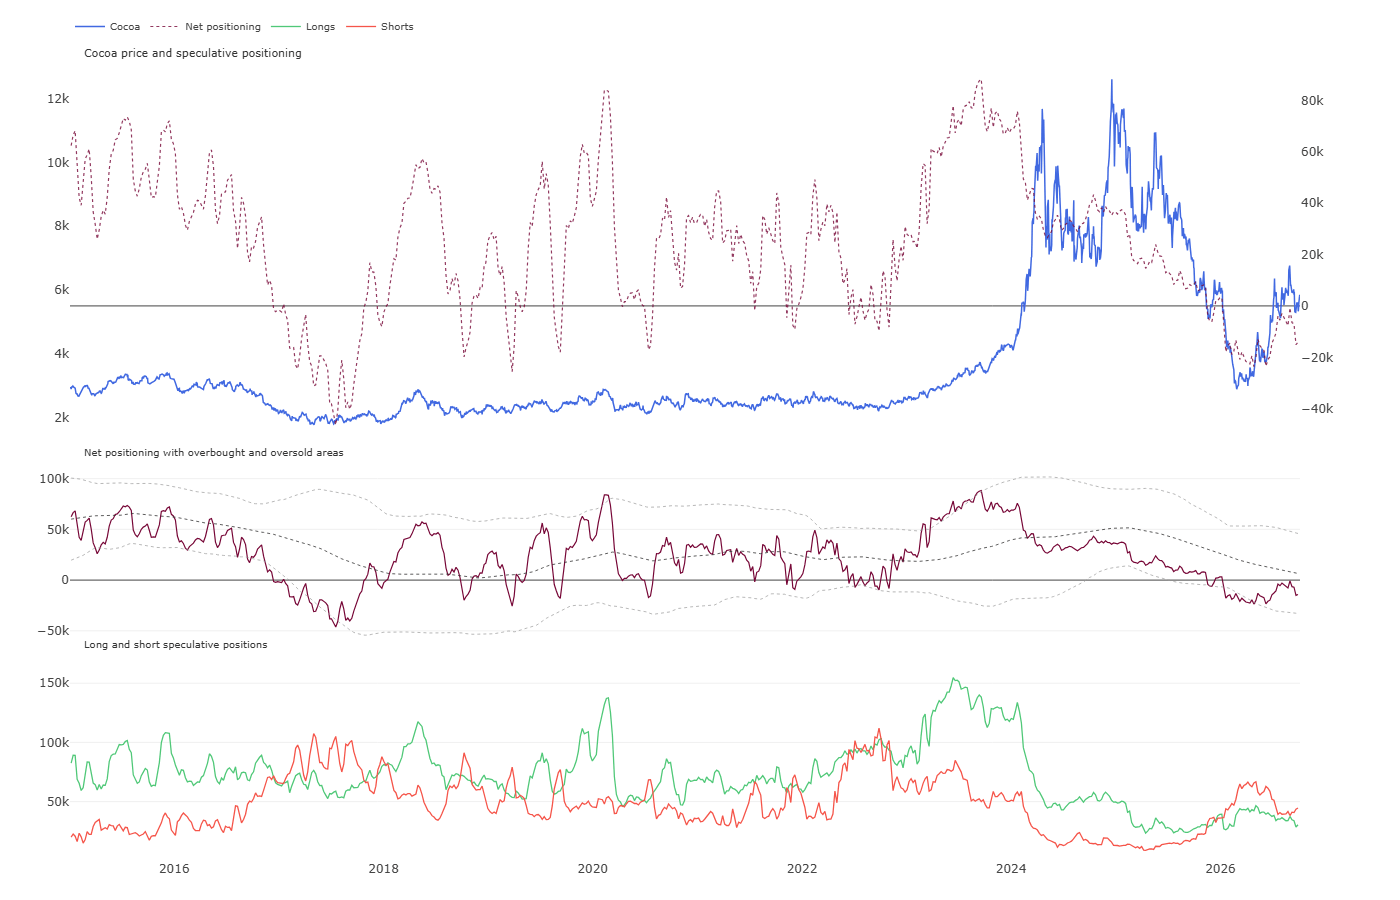
- Speculative positioning sharply contradicts the moderately neutral multi-year valuation (5-year Z-score +0.23), reflecting extreme bearish bias (8.6th percentile).
- This asymmetry, combined with mounting supply and logistical disruptions in West Africa, creates a high risk of a rapid short squeeze, where panicked short covering by institutional investors could trigger an outsized upside impulse.
Scenarios
- Bullish Scenario: Continued short covering by hedge funds alongside expanding El Niño effects and Harmattan damage across West Africa, coupled with ongoing transport and bridge paralysis in Ivory Coast, pushes prices above 50-day moving average resistance. Under these conditions, the market would look past high inventory levels to discount severe harvest deficits in Ghana and Ivory Coast, driving cocoa prices toward 6,200–6,500 USD/t.
- Bearish Scenario: Weather improvements in western Ivory Coast allowing quick repairs to port-bound transport routes, paired with pressure from 2-year high old-crop stocks (3.43 million bags) and a lack of Harmattan escalation, prompt market participants to resume selling. Technically, rejection at 5,800 USD/t and a fall back below 5,600 USD/t would align with econometric model forecasts, pushing cocoa toward support at 5,400 USD/t and medium-term into the 4,650–4,800 USD/t area.
Gold
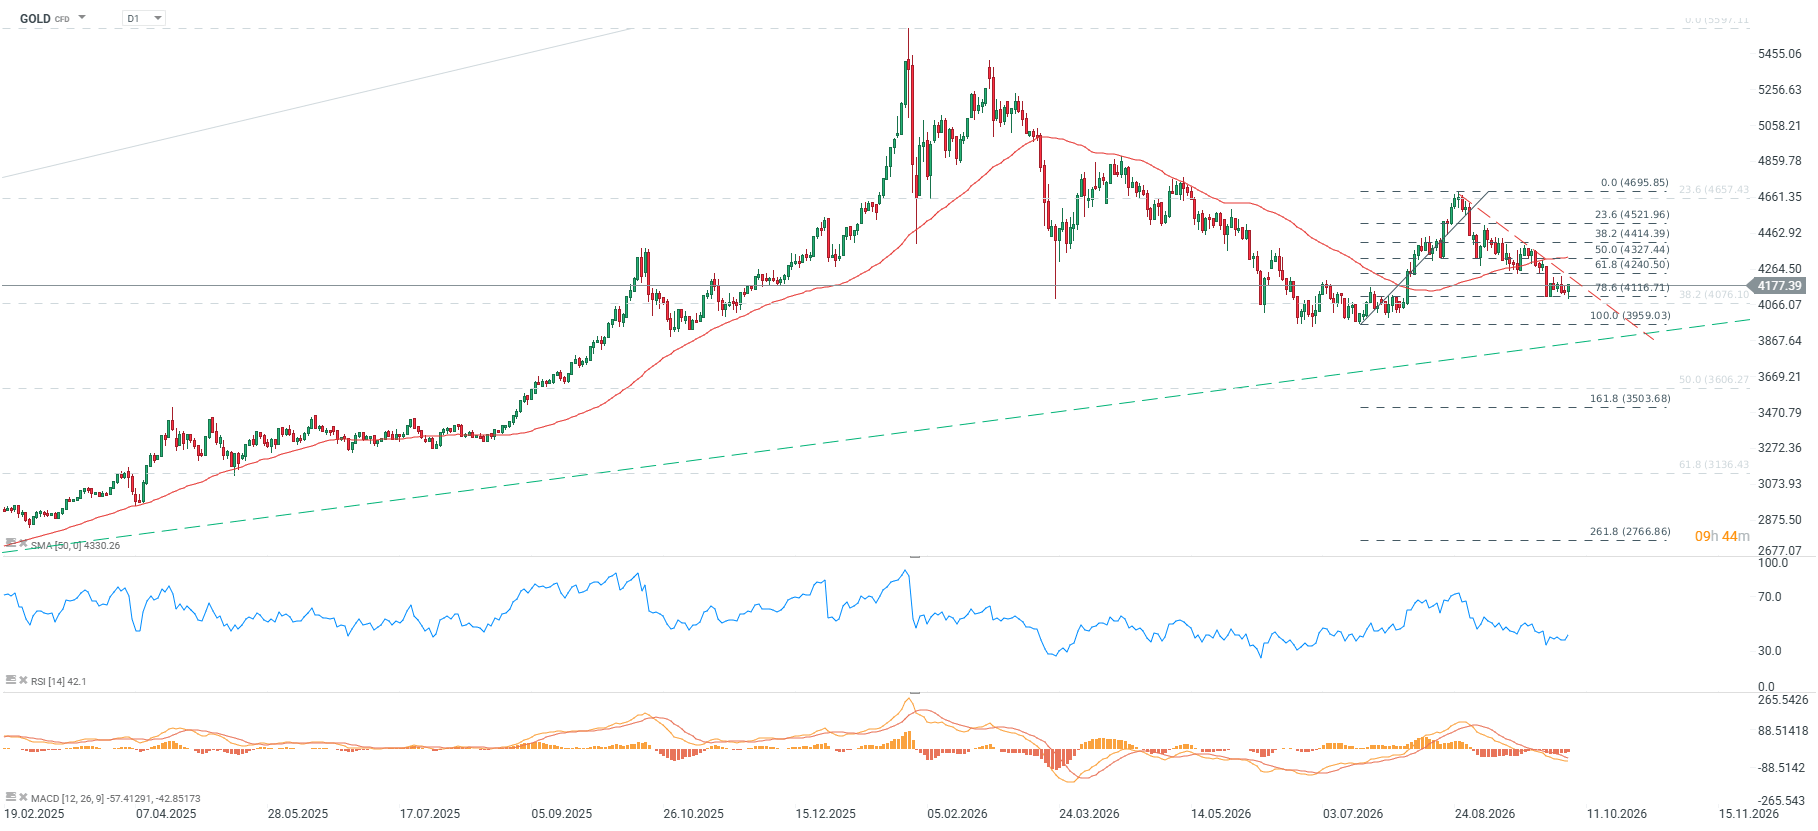
- Spot gold trades at 4,177 USD/oz, showing a modest weekly gain of 0.22%, alongside a notable monthly decline of 5.45% and a year-to-date return of -3.83% (up 4.55% year-over-year).
- RSI sits at 42 points, reflecting supply dominance without entering extreme oversold territory, while negative deviation from the 50-period moving average (-3.80%) alongside bearish SMA and MACD setups confirms bearish technical sentiment.
- Immediate key support spans 4,130.00–4,100.00 USD/oz, with immediate resistance at 4,200.00 USD and further resistance around 4,330.00 USD.
- Gold remains in a short-term downtrend, and until it reclaims the 50 SMA, a test of the 3,900 to 4,100 zone remains possible.
Fundamental and Market Context
- Spot gold trades above 4,100.00 USD/oz despite US Treasury yields remaining above 5.00%, pointing to an ongoing structural repricing of bullion relative to traditional real interest rate models in the US.
- Holdings in global physically-backed gold ETFs reached a 4-year high, forming a crucial demand floor defending the 4,130.00 USD/oz zone against deeper sell-offs.
- Gold bounced off two-month lows following a pause in Treasury selling, where a mild yield dip softened the US dollar and lowered the opportunity cost of holding non-yielding metal.
- September US payroll data came in significantly below expectations, adding just 29,000 nonfarm jobs against a consensus of 90,000, alongside a downward revision of August data to 133,000 jobs.
- US unemployment rose to 4.2%, while annual wage growth slowed unexpectedly to 3.0% (lowest since May 2021), significantly reducing leeway for further Fed monetary tightening.
- Following jobs data, market pricing slashed October Fed rate hike odds toward 20%, while December tightening odds remain estimated above 80% (totaling over 100%).
- Fed officials, including Vice Chair Philip Jefferson and NY Fed President John Williams, signaled in speeches the need to take additional time to assess whether further hikes are necessary to return inflation to target.
- The People’s Bank of China increased official gold reserves to 2,346.43 tons from 2,313.46 tons previously, representing an inflow of 32.97 tons of physical metal under its reserve diversification program.
- The Central Bank of the Russian Federation reported a reduction in gold holdings to 2,282.98 tons from 2,304.75 tons, selling 21.77 tons net.
- Long-term gold valuation remains supported by macroeconomic projections; an econometric model based on yields, ETFs, and the dollar suggests gold should trade around 4,500 over a 12-month horizon.
- Current spot gold prices sit 25.73% below their all-time high of 5,608.35 USD/oz.
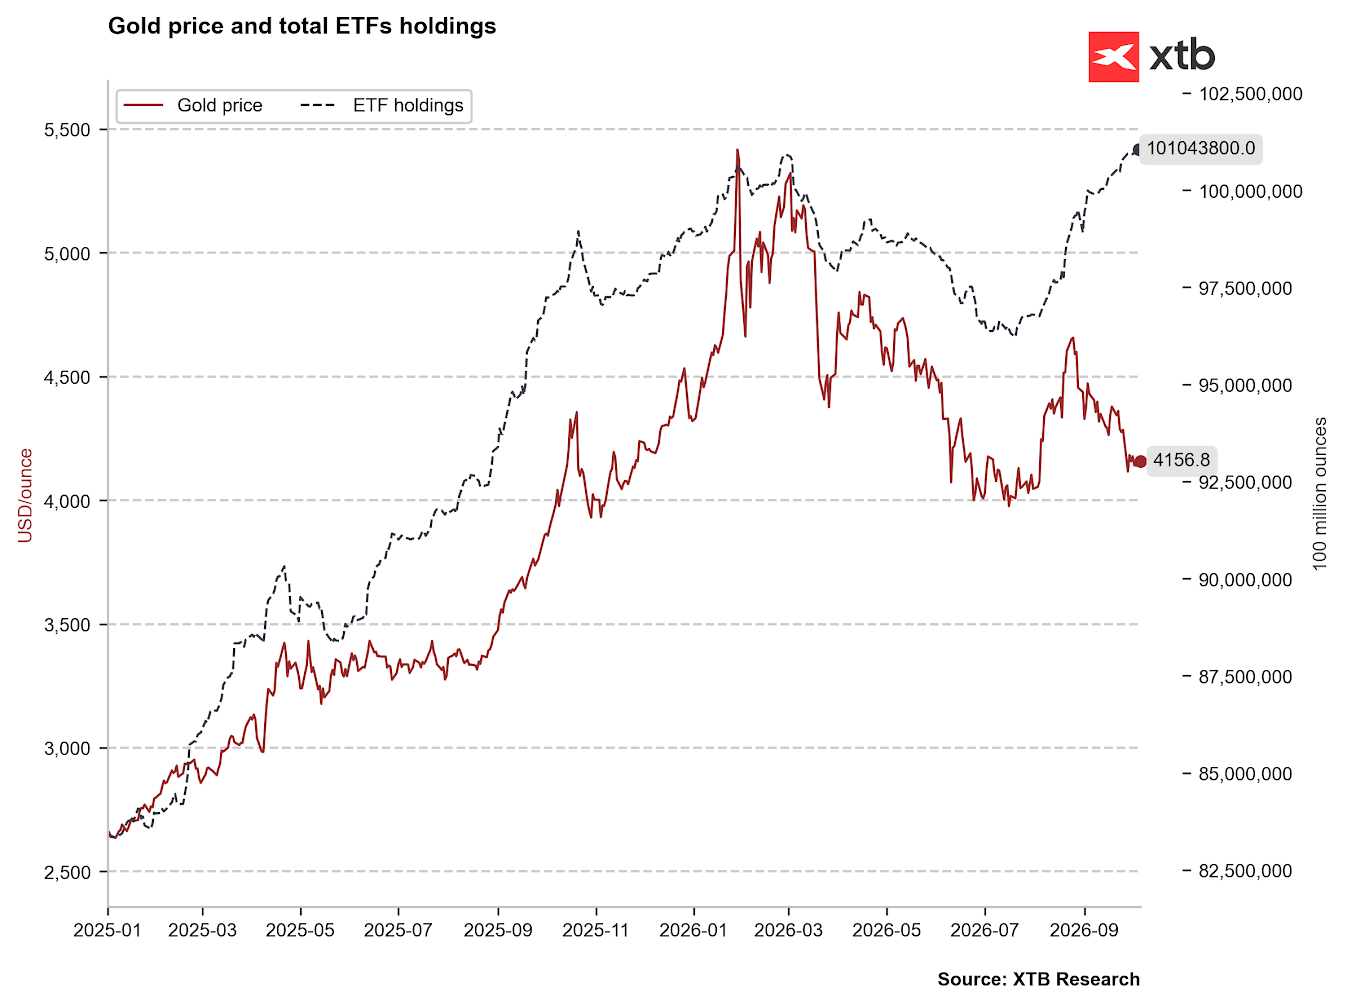
Despite gold selling off, ETFs began aggressively buying gold, echoing the summer 2025 setup right before a strong September rally tied to Fed stance shifts. Source: Bloomberg Finance LP, XTB
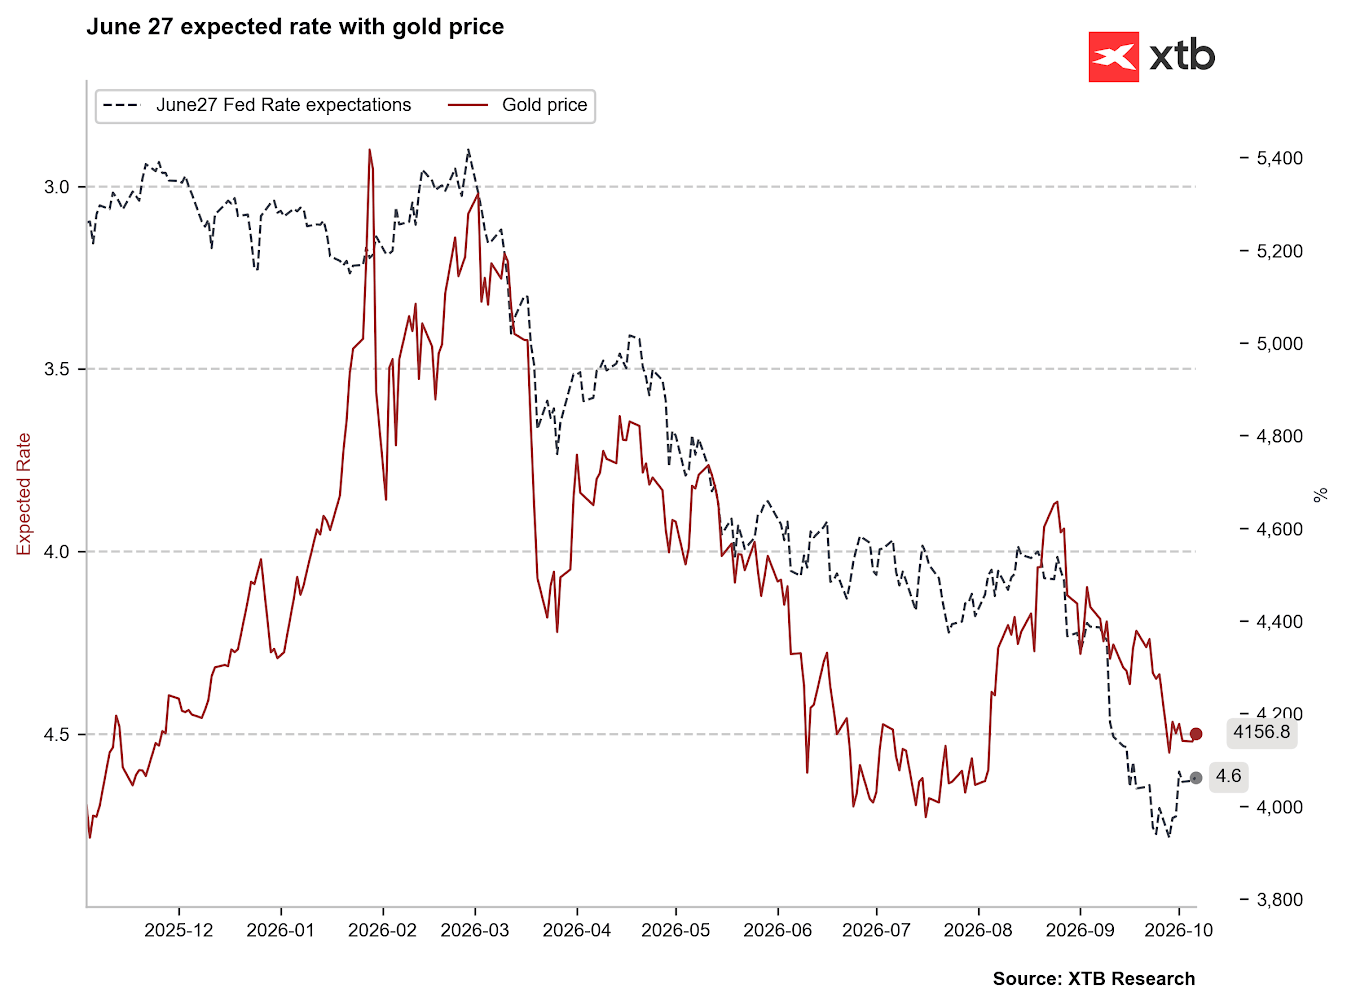
Despite lower odds of an October hike, the market remains strongly positioned for further rate increases, pointing toward 2-3 more moves through mid-next year. Source: Bloomberg Finance LP, XTB
Historical Valuation (Z-score) and CFTC Positioning
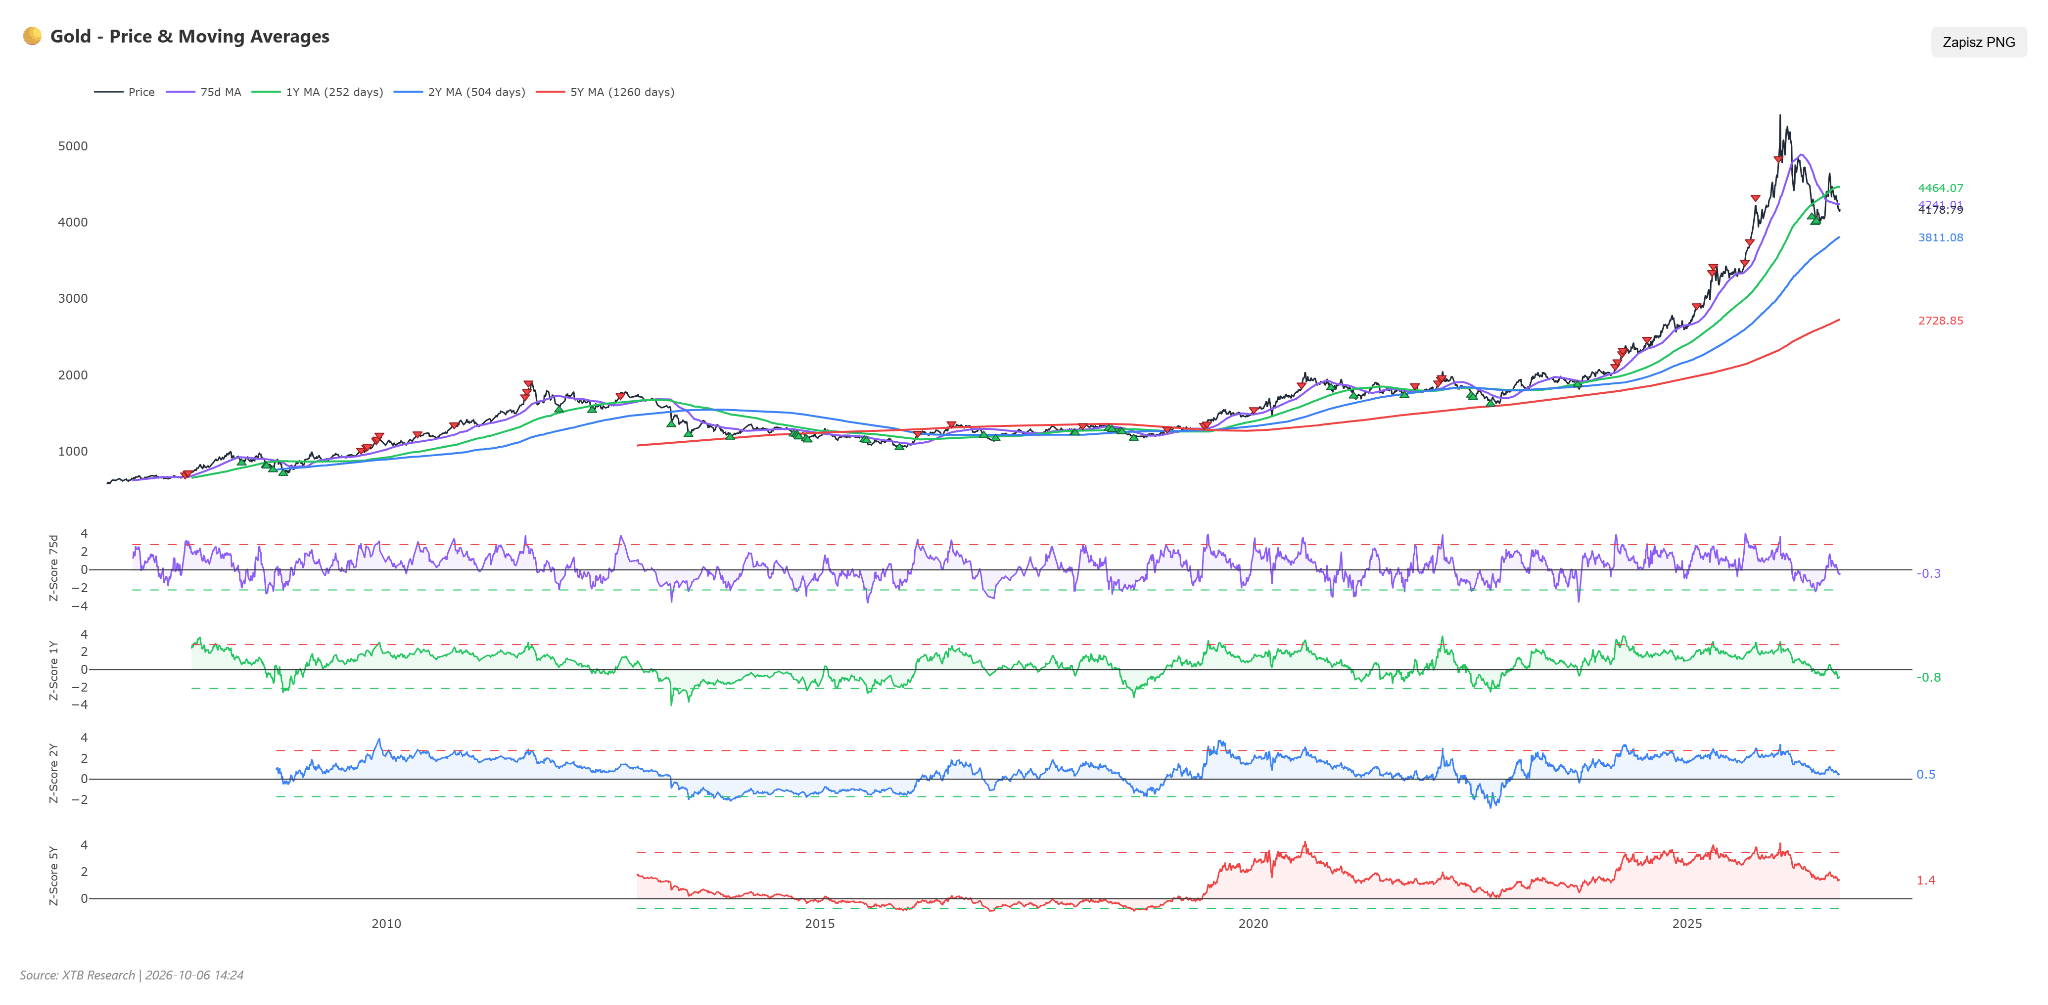
- Standardized price deviation metrics (Z-scores) indicate varying bullion valuations depending on the chosen timeframe.
- The 1-year Z-score stands at -0.85, signaling a moderate price cooldown and relative undervaluation over the past twelve months.
- Conversely, longer-term indicators sit on the positive side, reaching +0.47 for 2-year and +1.40 for 5-year periods.
- The evolution of the 5-year Z-score over the last six months displays a clear downward trend.
- Six months ago, this index sat at an extremely elevated +2.51 level before dropping to +1.60 three months later.
- A month ago brought a temporary bounce to +1.73, but recent weeks saw a renewed decline, stabilizing at the current +1.40 level.
- The CFTC speculative positioning report as of September 29, 2026, shows leveraged funds and financial investors holding net long positions of +218,632 contracts.
- The Z-score for this position sits at +0.06, yet historical percentile positioning reaches 86.6%, testifying to high structural market saturation in bullish positions. Speculators trimmed net exposure by 7,221 contracts during the week, though long position share remains extremely high at 88.9%.
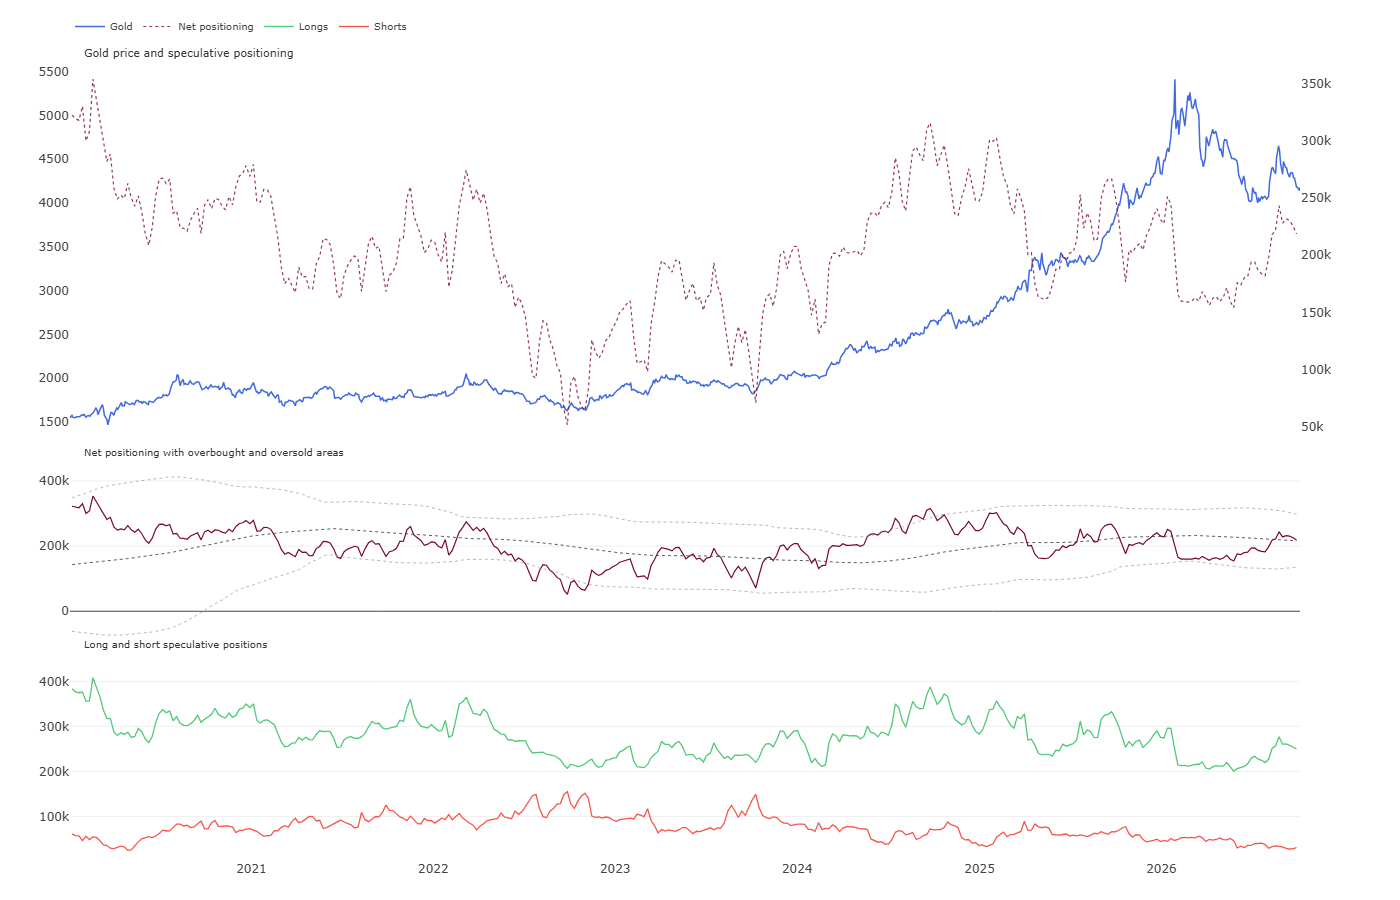
- A synthesis of both perspectives highlights risk asymmetry. Although the drop in 5-year price Z-score confirms profit-taking and reduced overbought conditions, speculative positioning at the 86.6th percentile with nearly 89% longs leaves the market vulnerable to further position unwinding, especially after the recent bounce.
- This setup implies that absent fresh pro-inflationary impulses or hawkish Fed rhetoric, the overhang of speculative long positions could prompt another wave of forced liquidation, deepening technical correction.
Scenarios
- Bullish Scenario: Gold resuming a sustained uptrend requires a definitive breakout and hold above technical resistance at 4,200.00 USD/oz, backed by confirmation of a dovish Fed pivot. Falling rate hike odds late in the year—triggered by worsening US employment readings and wage growth slowing below 3.0%—would need to push Treasury yields below 5.00% and weaken the US dollar index. Under these conditions, sustained central bank buying (notably PBoC) and ETF inflows would propel gold to test local peaks around 4,330.00 USD, clearing a medium-term path toward the econometric model target of 4,546.76 USD/oz.
- Bearish Scenario: A deeper decline materializes if gold breaks below key support in the 4,130.00–4,100.00 USD/oz zone, triggering stop-loss cascades and forced liquidation of saturated speculative net long positions. A key fundamental driver would be renewed hawkish expectations for the December Fed meeting (pricing rate hike odds above current 80%), driven by core inflation rebounds. Rising Treasury yields would pressure ETF holdings, driving prices down first to 4,020.00 USD support, and under a strong sell-off, toward psychological support at 3,950.00 USD/oz.
Oil
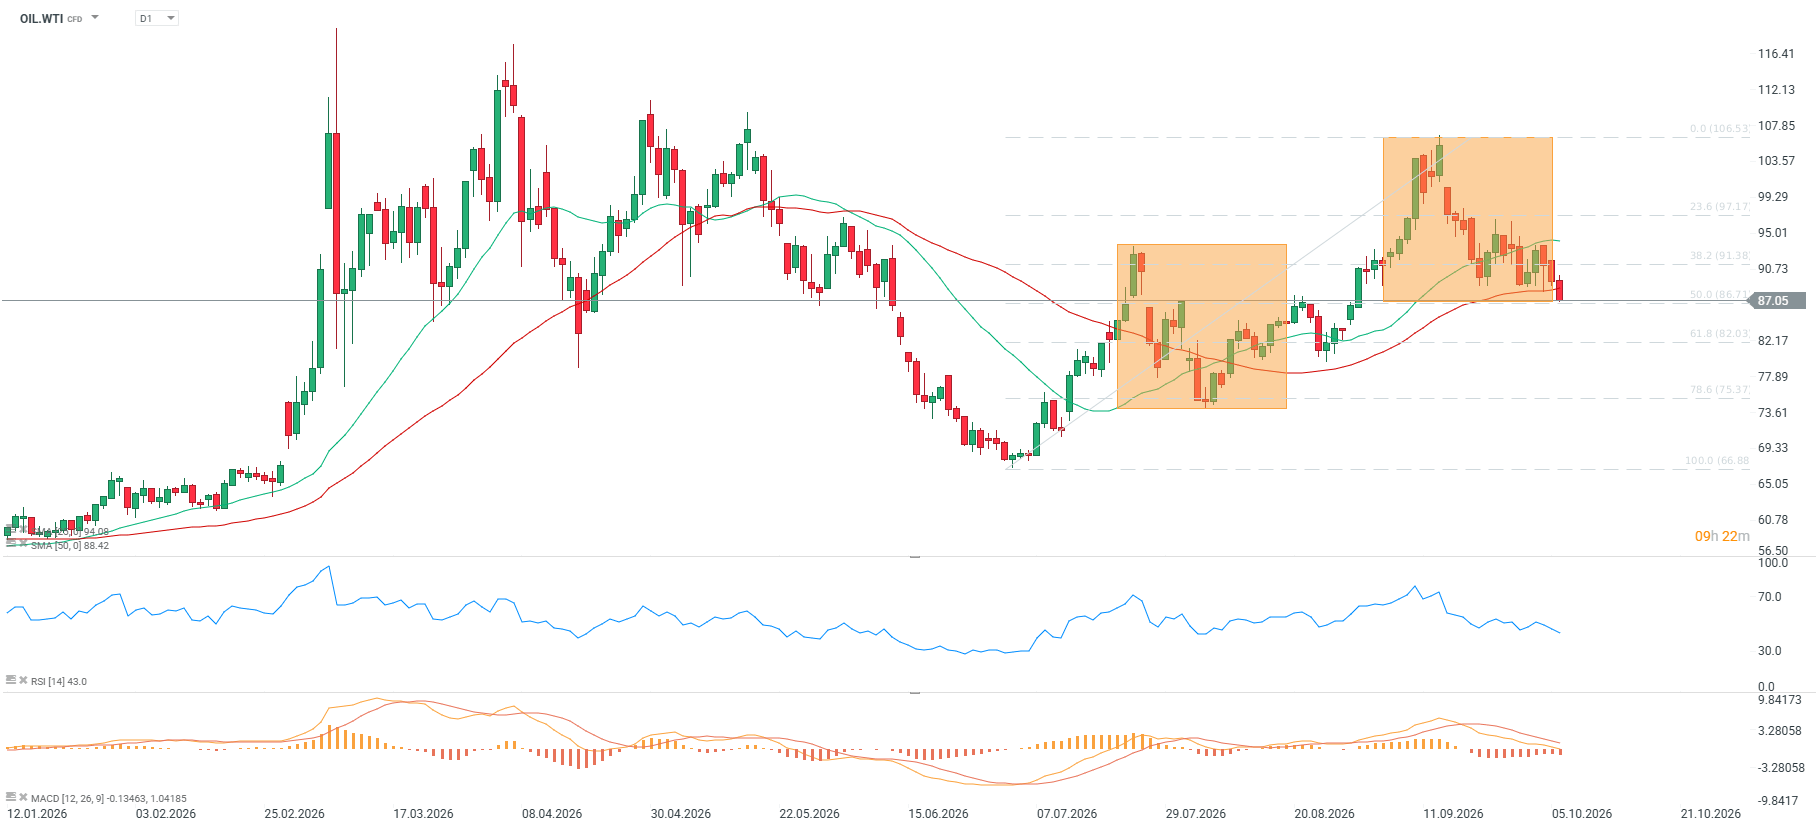
- Current WTI crude trades at 87 USD/bbl, while European Brent benchmark trades between 98.22–100.92 USD/bbl.
- Medium term, WTI marks a 3.13% weekly drop and a 5.56% monthly decline, while retaining strong YTD gains of +52.79% and +41.04% YoY.
- RSI dropped to 33 points, approaching oversold territory, MACD generates a sell signal, and prices dipped 1.06% below the 50-period moving average, though overall SMA alignment remains technically bullish.
- Key short-term support following a break below 88.54 USD sits at 86.31 USD and 84.36 USD for WTI, while main technical resistance for Brent centers around 103.90 USD.
Fundamental and Market Context
- Daily crude flows through the Strait of Hormuz recovered to 17.5 million barrels per day, representing nearly 98% of pre-conflict volumes in the Persian Gulf region.
- Reports also indicate daily refined product flows reached 2 million barrels per day.
- Throughput on Saudi Arabia’s East-West Pipeline reached 5.8 million barrels per day (80% of nominal capacity), bypassing less secure maritime routes through the Strait of Hormuz.
- Middle East crude exports in late September exceeded pre-war averages over a four-day stretch, pointing to rapid logistical recovery.
- G7 nations agreed on a coordinated release of 100 million barrels of crude oil and diesel from strategic reserves, pledging not to introduce energy export barriers.
- Saudi Aramco cut November Official Selling Prices (OSP) for Arab Light to Asian buyers sharply, expanding discounts to 5 USD below regional benchmarks (from 2 USD discount in October).
- The Joint Ministerial Monitoring Committee (JMMC) and OPEC+ delegates decided on October 4 to keep November output targets unchanged, maintaining 2 million bpd production cuts through late 2026.
- Reassessing baseline capacity for OPEC+ members was officially postponed to 2027 due to infrastructure instability in conflict areas. According to the IEA, OPEC production capacity fell sharply.
- A group of seven key OPEC+ producers raised combined August production by 630,000 bpd to 25 million bpd, which remains about 5 million bpd below pre-conflict levels.
- Current Saudi crude output stands at 6.238 million bpd, down from earlier levels of 8.135 million bpd.
- US crude production remains near record highs at 13.948 million bpd (13.955 million bpd weekly average), while Russian output fell to 9.582 million bpd from 9.716 million bpd.
- Recent US inventory reports showed a weekly crude build of 0.92 million barrels (vs 2.97 million build prior), while API estimates signaled a 1.02 million build (vs 1.79 million prior).
- Despite improved crude availability, refined product inventories remain tight, with US middle distillate stocks standing at 105.2 million barrels.
- The oil market shows huge disparities. The Brent-WTI spread widened beyond 10 USD, driven by concerns over potential diesel export bans reducing refinery crude purchases. Reports also suggest the US administration is actively trying through various methods to push prices down ahead of midterm elections.
- Vitol’s CEO stated that commercial oil stocks in Western nations were depleted following war disruptions in Iran, creating sudden deficit risks if fresh supply shocks emerge.
- Japanese officials held talks with Saudi Arabia and the UAE during the Asia Zero Emission Community (AZEC) summit to secure ongoing crude supply to Asian nations.
- Iraq’s parliament included a conservative crude oil price assumption of 58 USD/bbl in its draft 2027 national budget.
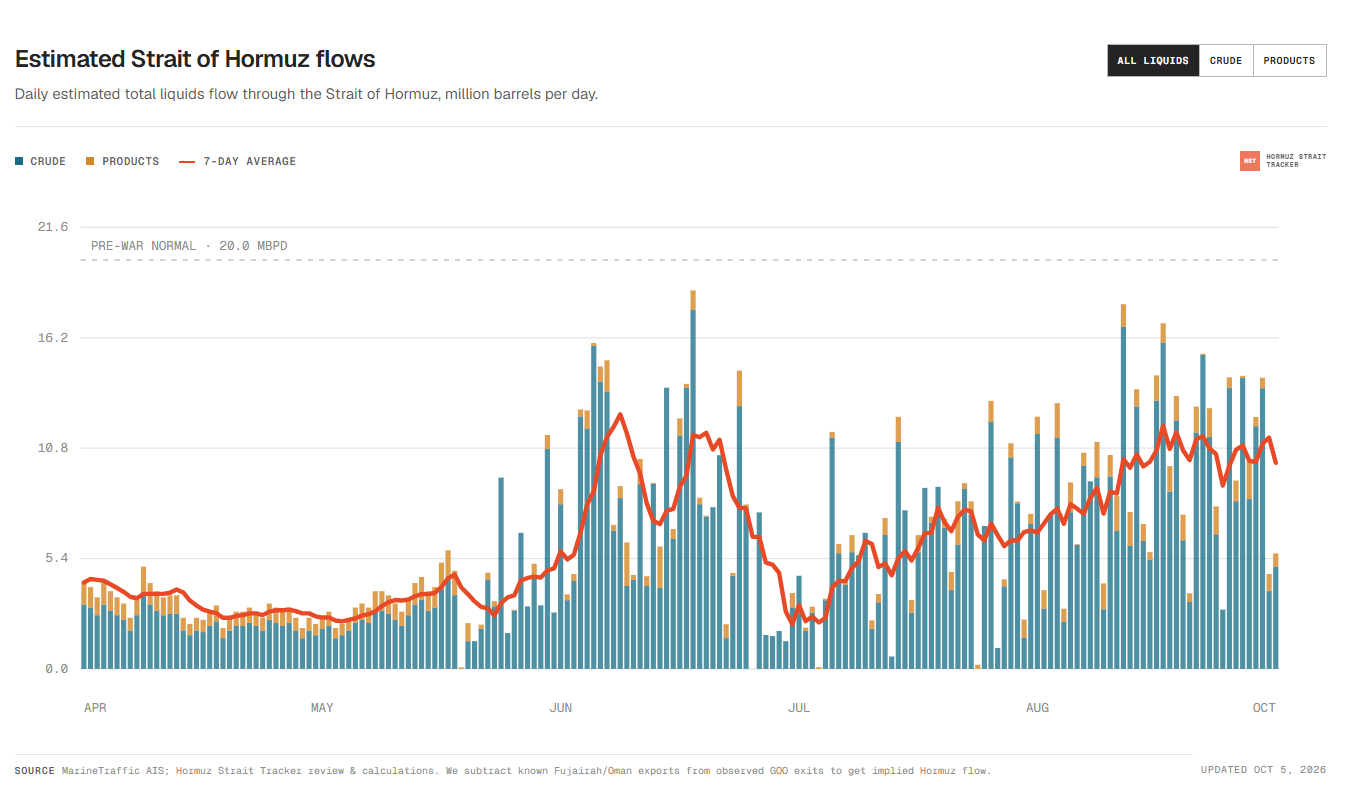
Crude deliveries through the Strait of Hormuz picked up visibly of late, but lingering issues remain. Speculation suggests the UAE and other Gulf states are quietly paying Iran to avoid vessel attacks, raising export costs while preserving oil revenue. Source: hormuzstraittracker.com
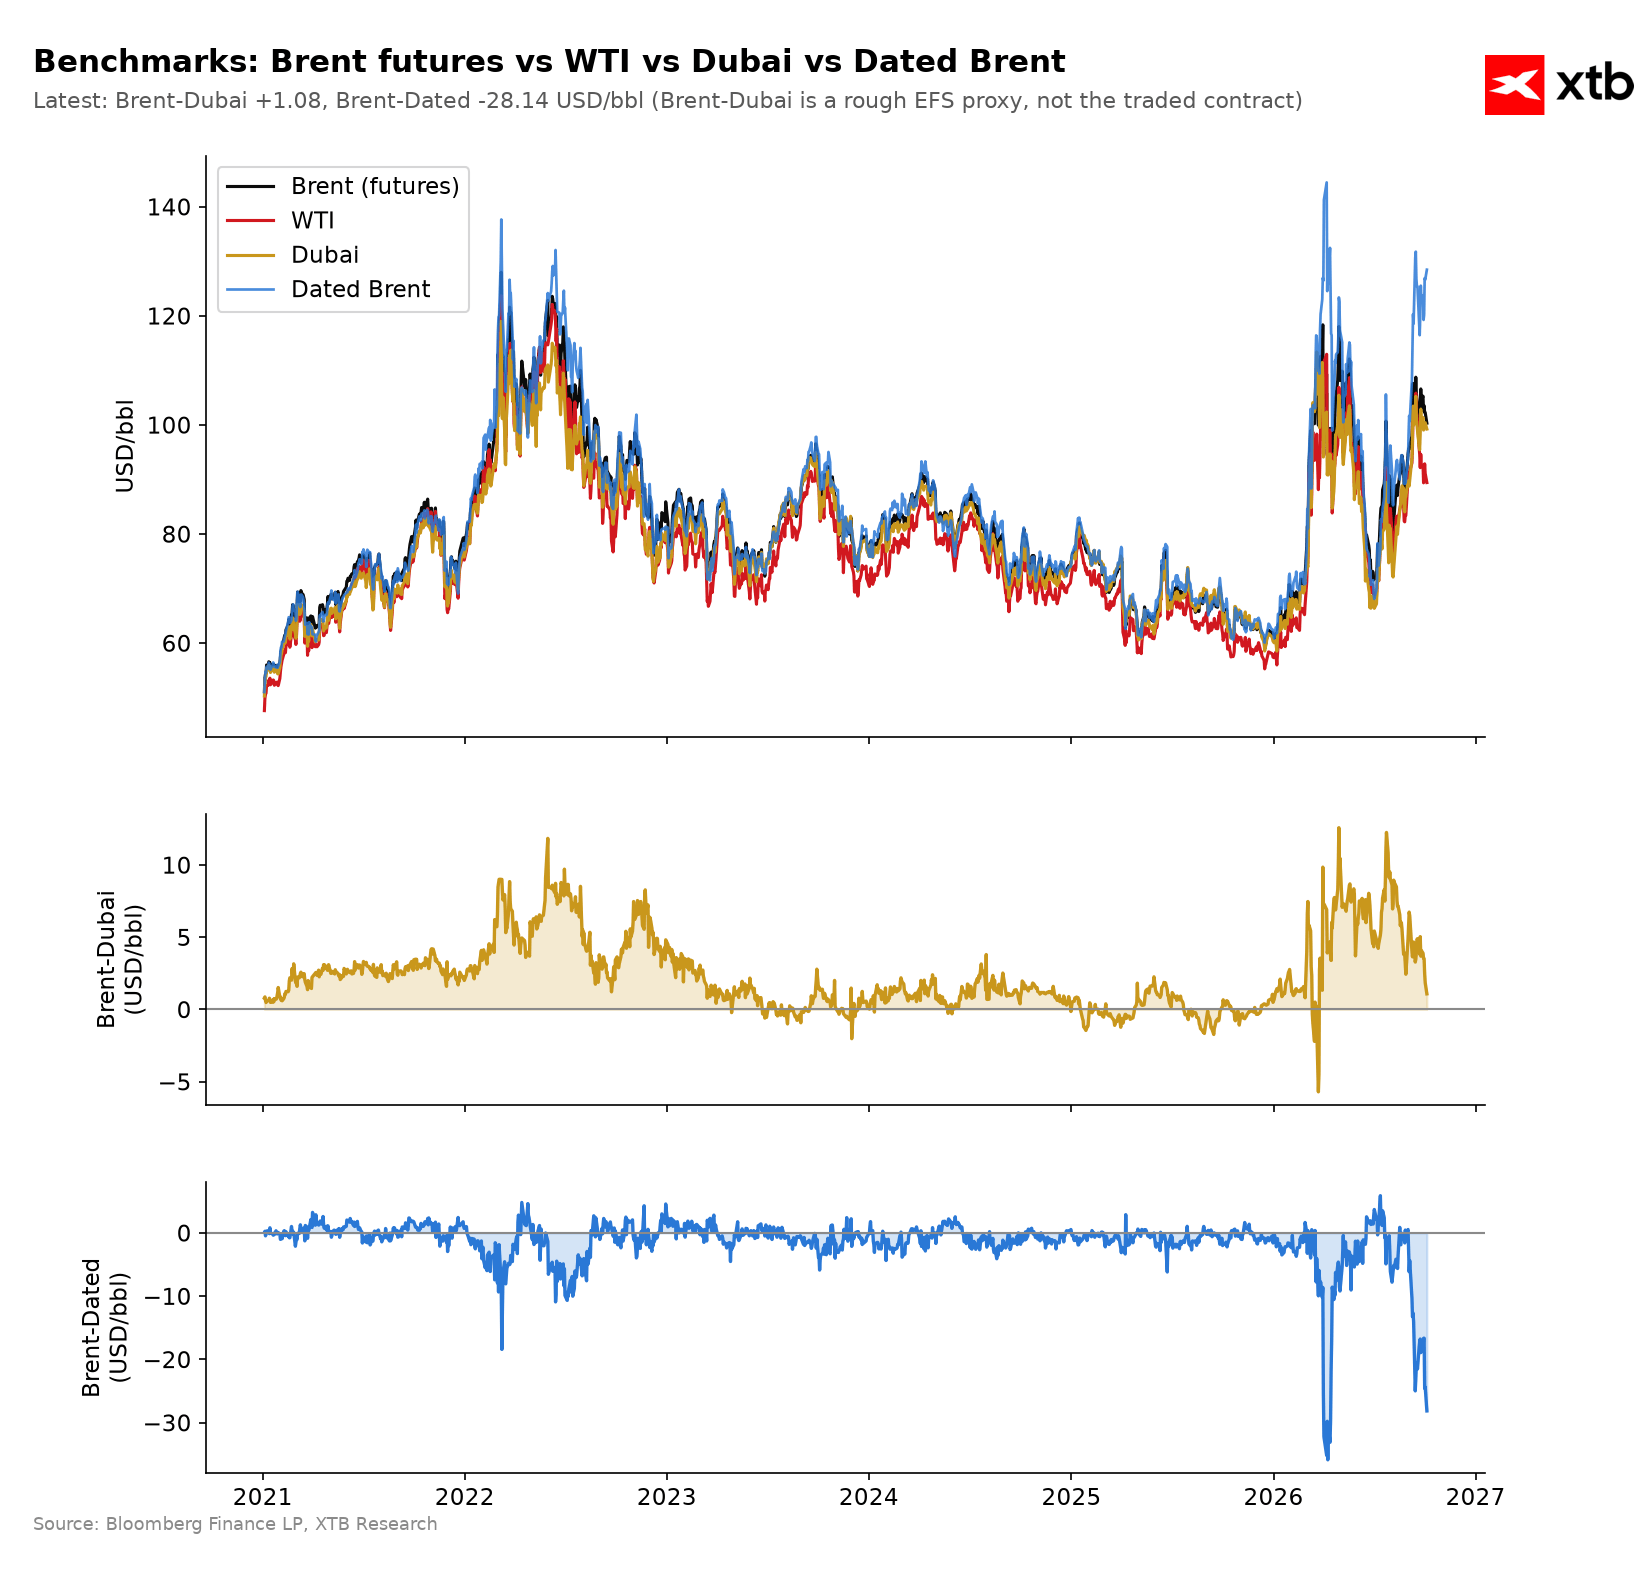
Physical Brent prices remain elevated, but the Brent-Dubai spread is narrowing. Omani crude prices are falling sharply. Source: Bloomberg Finance LP, XTB
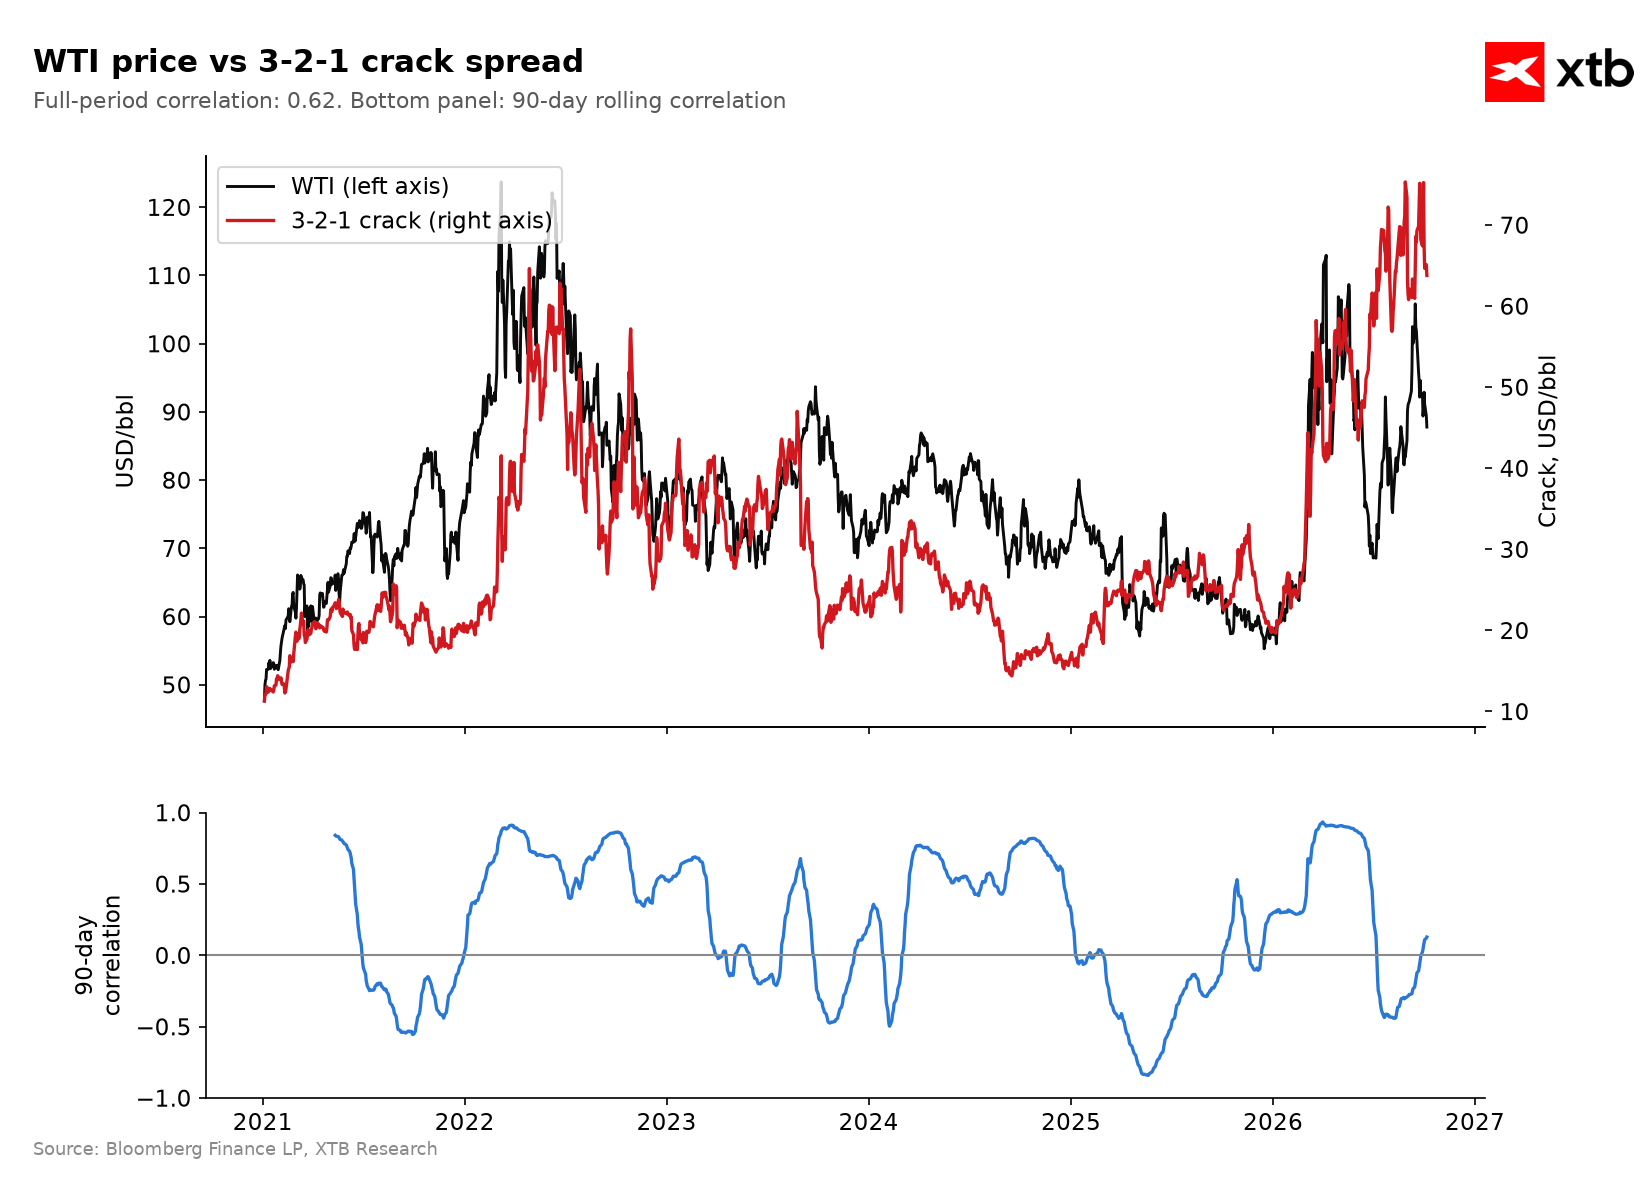
The crack spread in the US is dropping along with WTI prices, but remains at elevated levels. Source: Bloomberg Finance LP, XTB
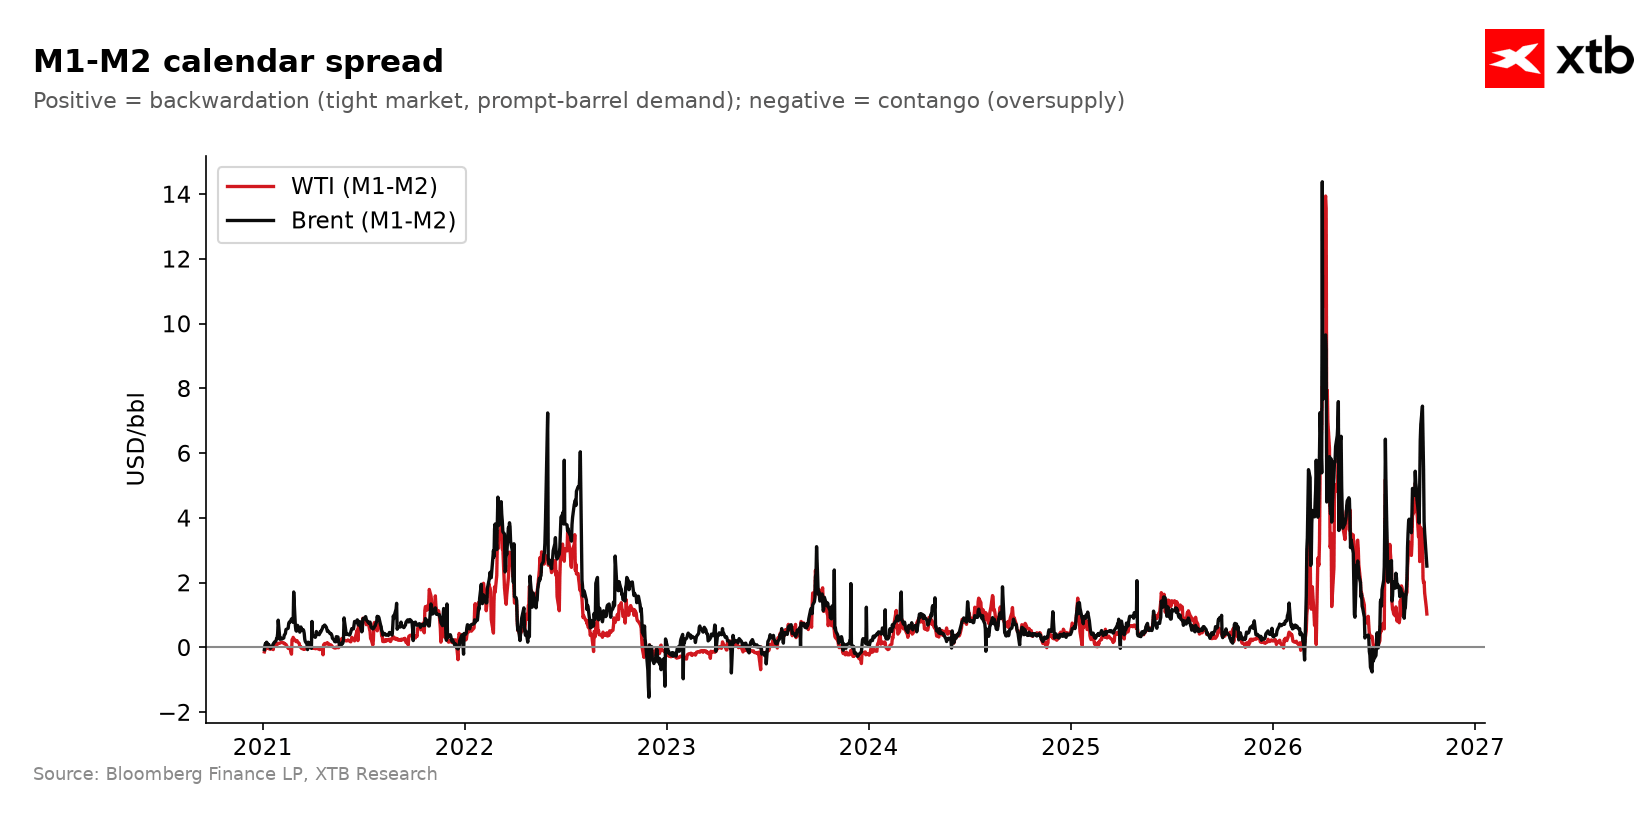
Calendar spreads are starting to decline noticeably. Source: Bloomberg Finance LP, XTB
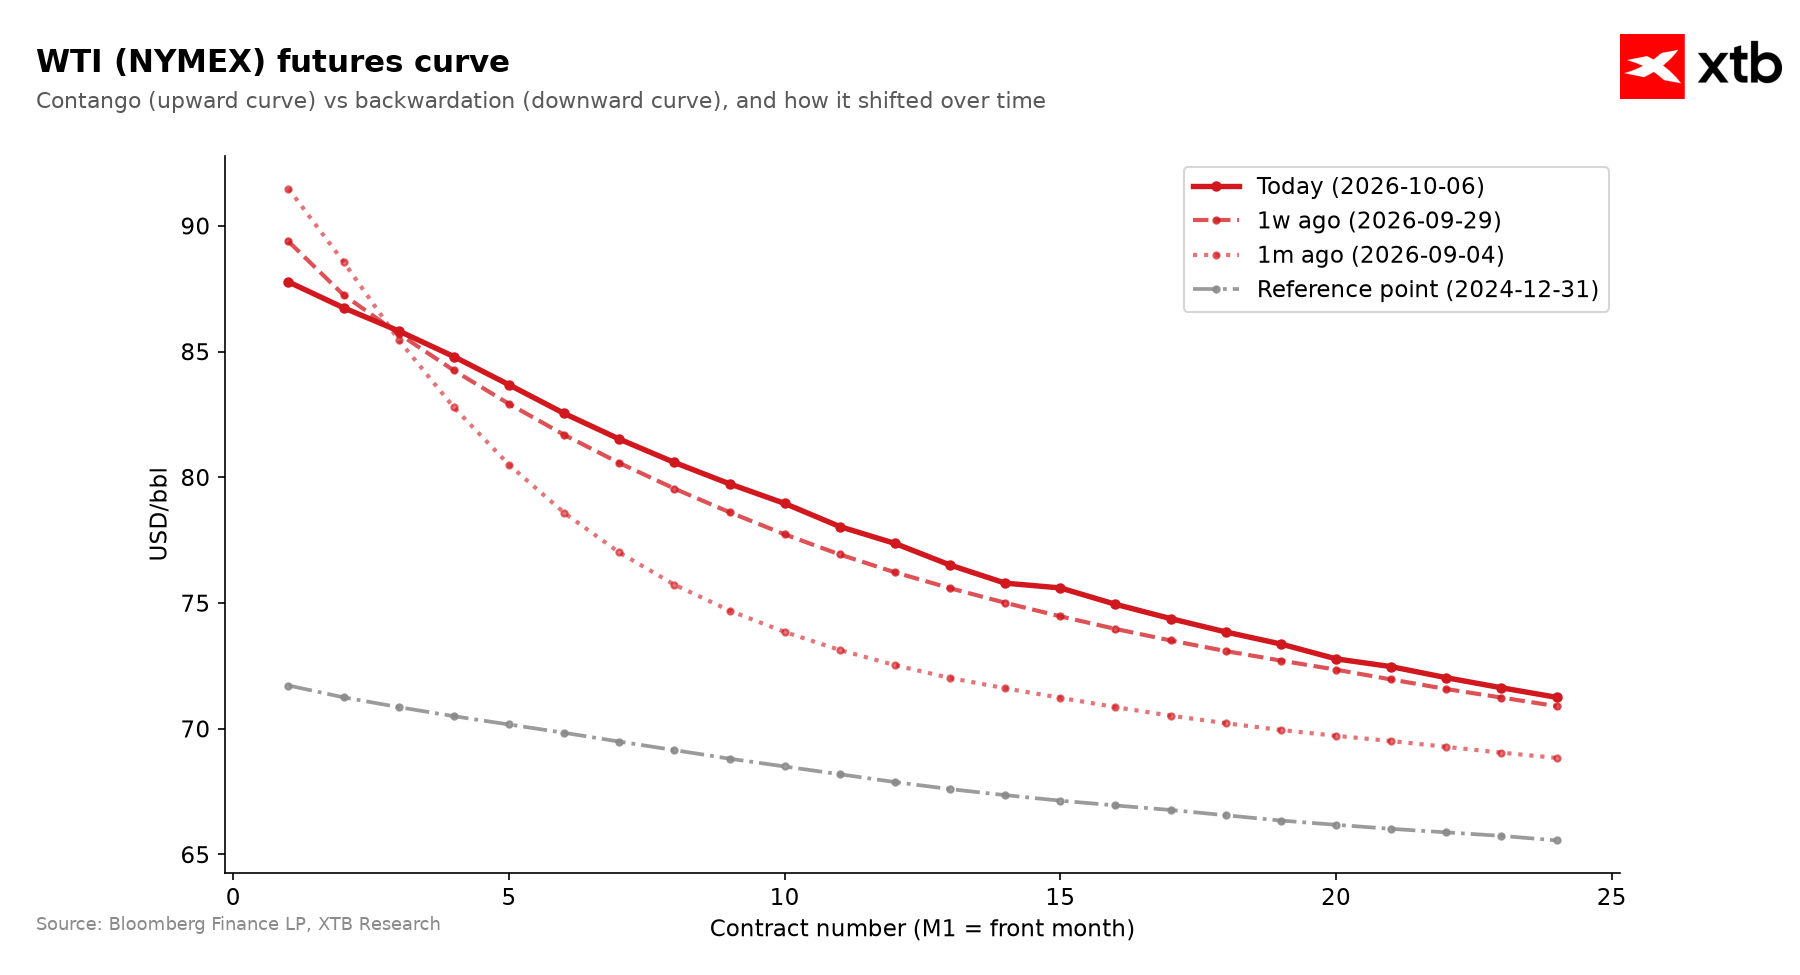
The WTI futures curve is easing noticeably in the short end while shifting higher further out, signaling reduced short-term pressure (or artificial price suppression), but persistent underlying issues long term. Source: Bloomberg Finance LP, XTB
Historical Valuation (Z-score) and CFTC Positioning
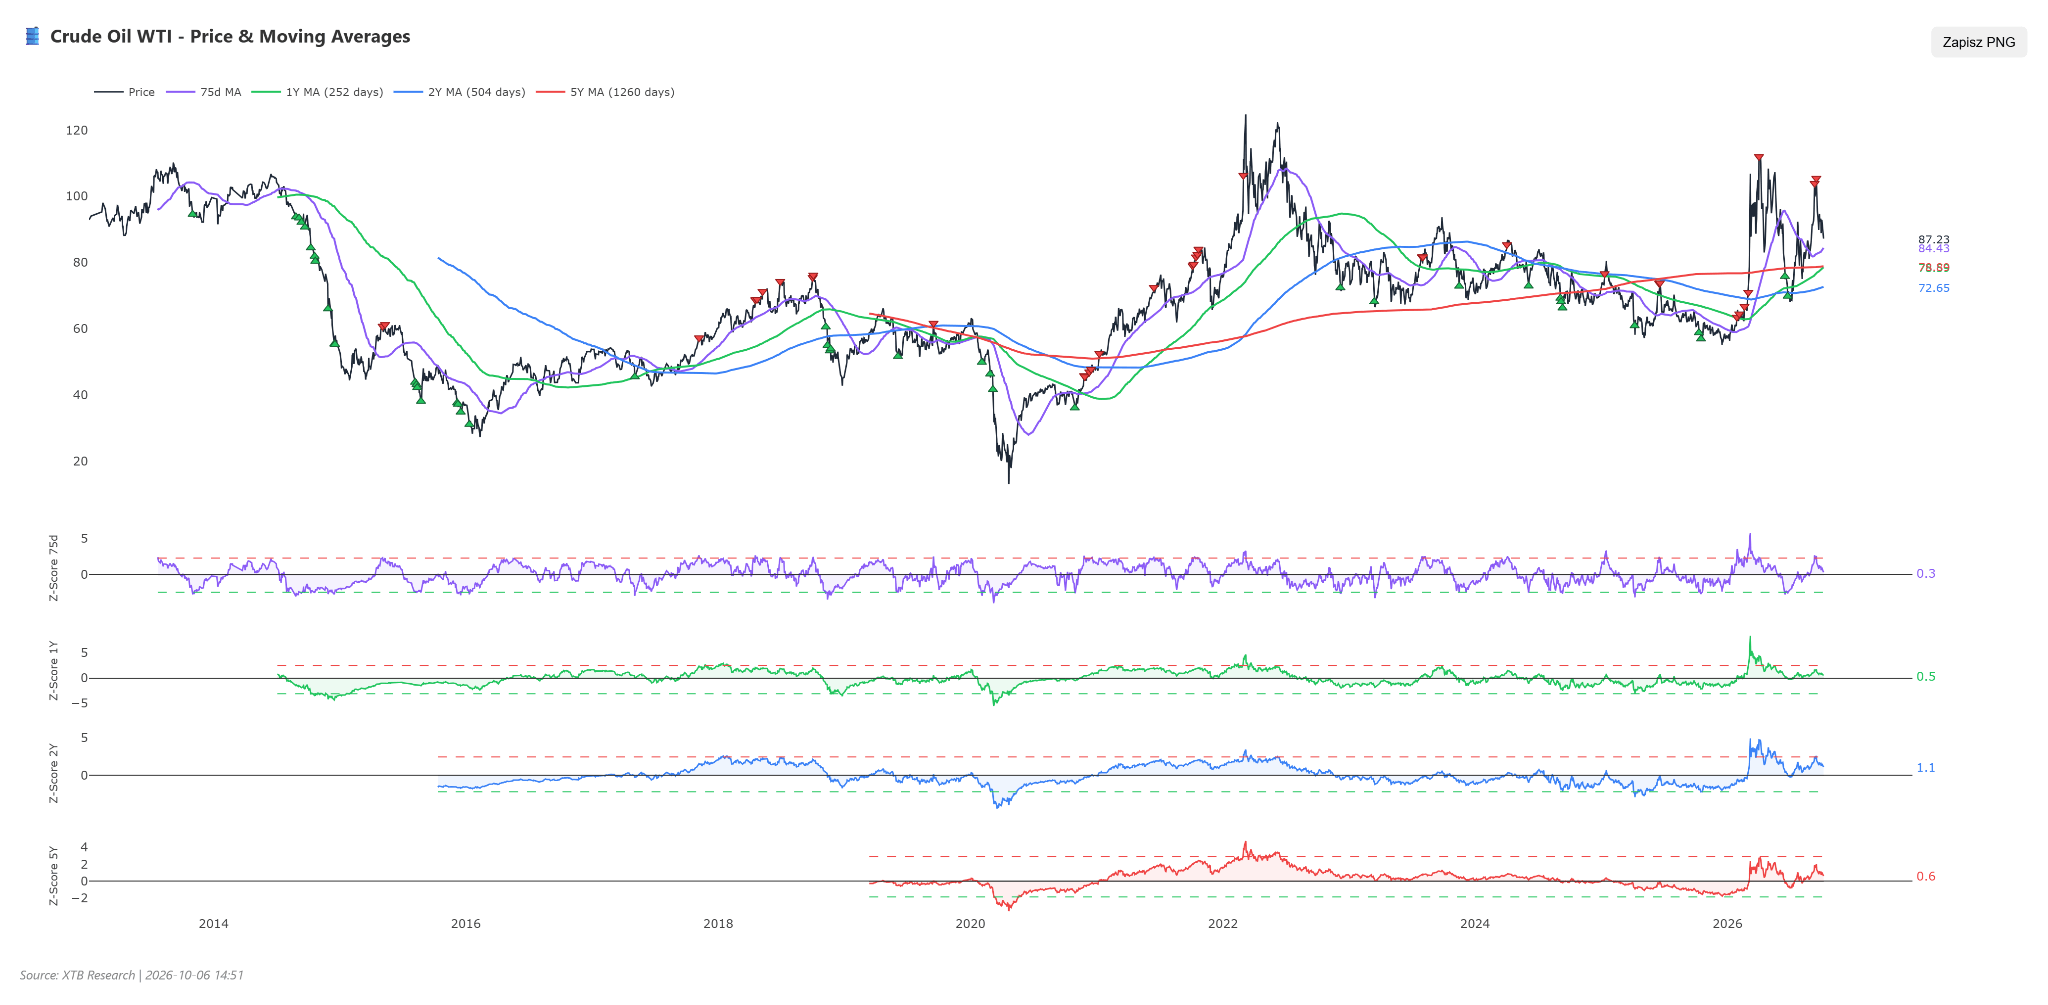
- Standard deviation valuation metrics for WTI crude sit at moderate positive levels, with Z1Y at +0.55, Z2Y at +1.11, and 5-year Z5Y at +0.64.
- Analyzing the historical trajectory of the 5-year Z-score over the last six months reveals dramatic shifts in market sentiment.
- Six months ago, the index stood at an extreme peak of +2.72, reflecting the height of geopolitical risk premium.
- Three months ago, it plunged to negative territory (-0.74) following temporary military stabilization.
- One month ago, the metric bounced to +0.96 on renewed shipping route concerns before settling at +0.64 in recent weeks alongside shipping normalization.
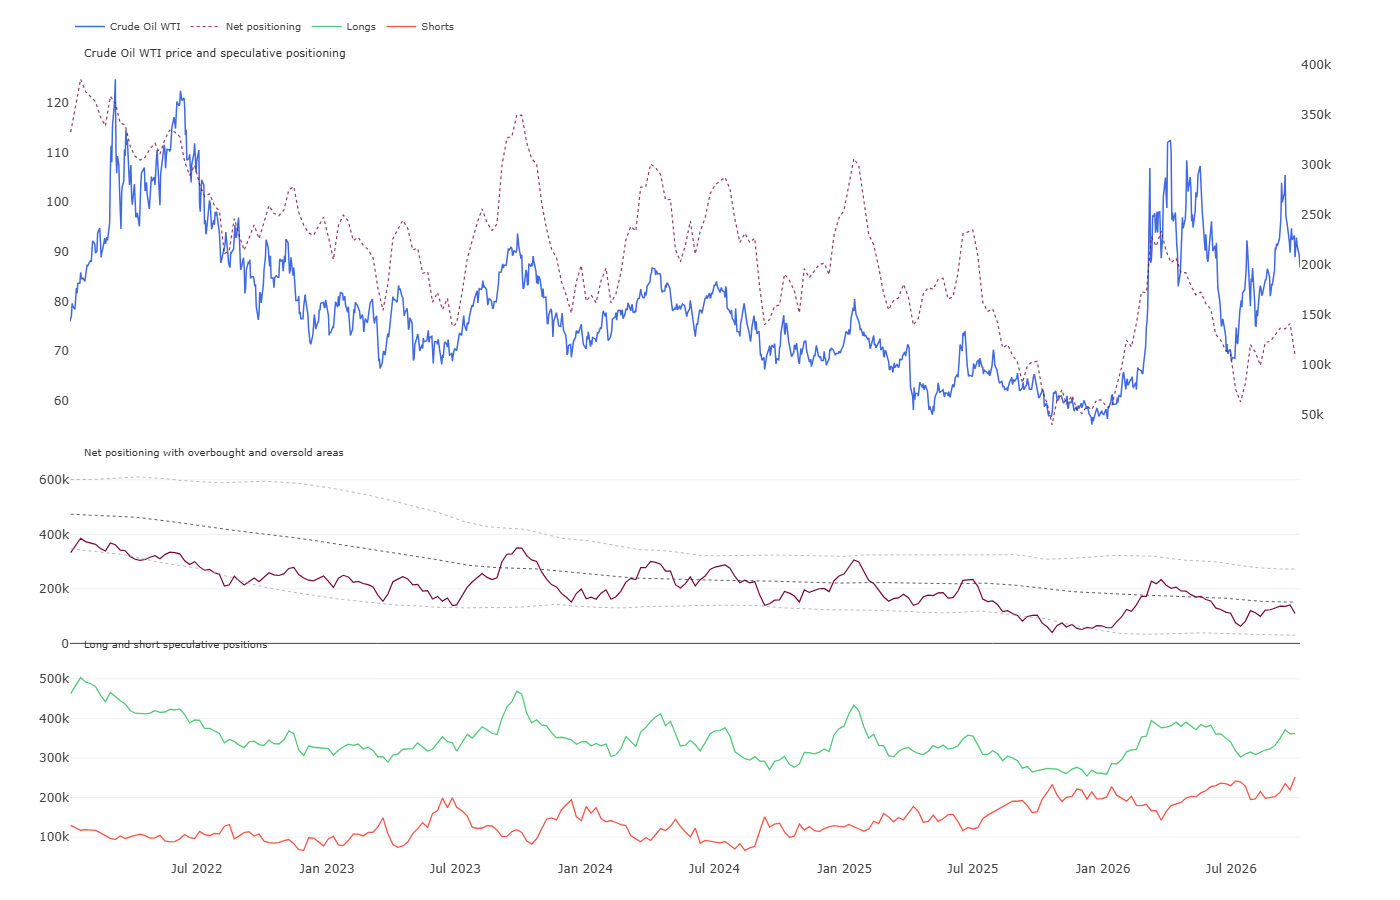
- CFTC positioning data for September 29, 2026, shows net long speculative positioning at +109,463 contracts, matching a Z-score of -0.69 and sitting at the 55.3rd historical percentile.
- Over the week, funds conducted a sharp reduction, selling 31,643 net contracts and lowering long position share to 58.9%.
- The pullback in speculative exposure confirms declining price premiums reflected in lower Z5Y metrics.
- Heavy profit-taking and long liquidation reduce speculative supply overhang, but with Middle East export infrastructure unblocking, pressure favors further valuation cooling.
Scenarios
- Bullish Scenario: Resuming an upward wave requires renewed geopolitical risks, such as re-blockades in the Strait of Hormuz, attacks on East-West pipeline infrastructure, or physical exhaustion of the 100 million barrels released from G7 strategic reserves amid ongoing middle distillate deficits. Technically, holding support at 86.31 USD on WTI followed by a breakout above 88.54 USD and clearing 90.00 USD, along with testing 103.90 USD resistance on Brent, would realize this scenario.
- Bearish Scenario: A deeper sell-off materializes if Middle East crude flows remain above pre-war levels, Aramco continues aggressive Asian OSP price cuts, and record US production near 14 million bpd drives ongoing commercial inventory builds. Technically, a daily close below 86.31 USD on WTI seals bear dominance, sending prices directly to support at 84.36 USD, with medium-term risk extending toward psychological support at 80.00 USD/bbl.