S&P 500 — US Large Cap Index
 FTSE 100 — UK Blue Chips
 Euro Stoxx 50 — Eurozone Leaders
 DAX 40 — German Equities
 CAC 40 — French Market Index
 Nikkei 225 — Japan Benchmark
 Hang Seng — Hong Kong Index
 Shanghai Composite — China Mainland
 ASX 200 — Australian Market
 TSX Composite — Canada Index
 Nifty 50 — India Large Cap
 STI Index — Singapore Market
 KOSPI — South Korea Index
 Bovespa — Brazil Equities
 JSE Top 40 — South Africa Index
 IPC Index — Mexico Market

Market Situation
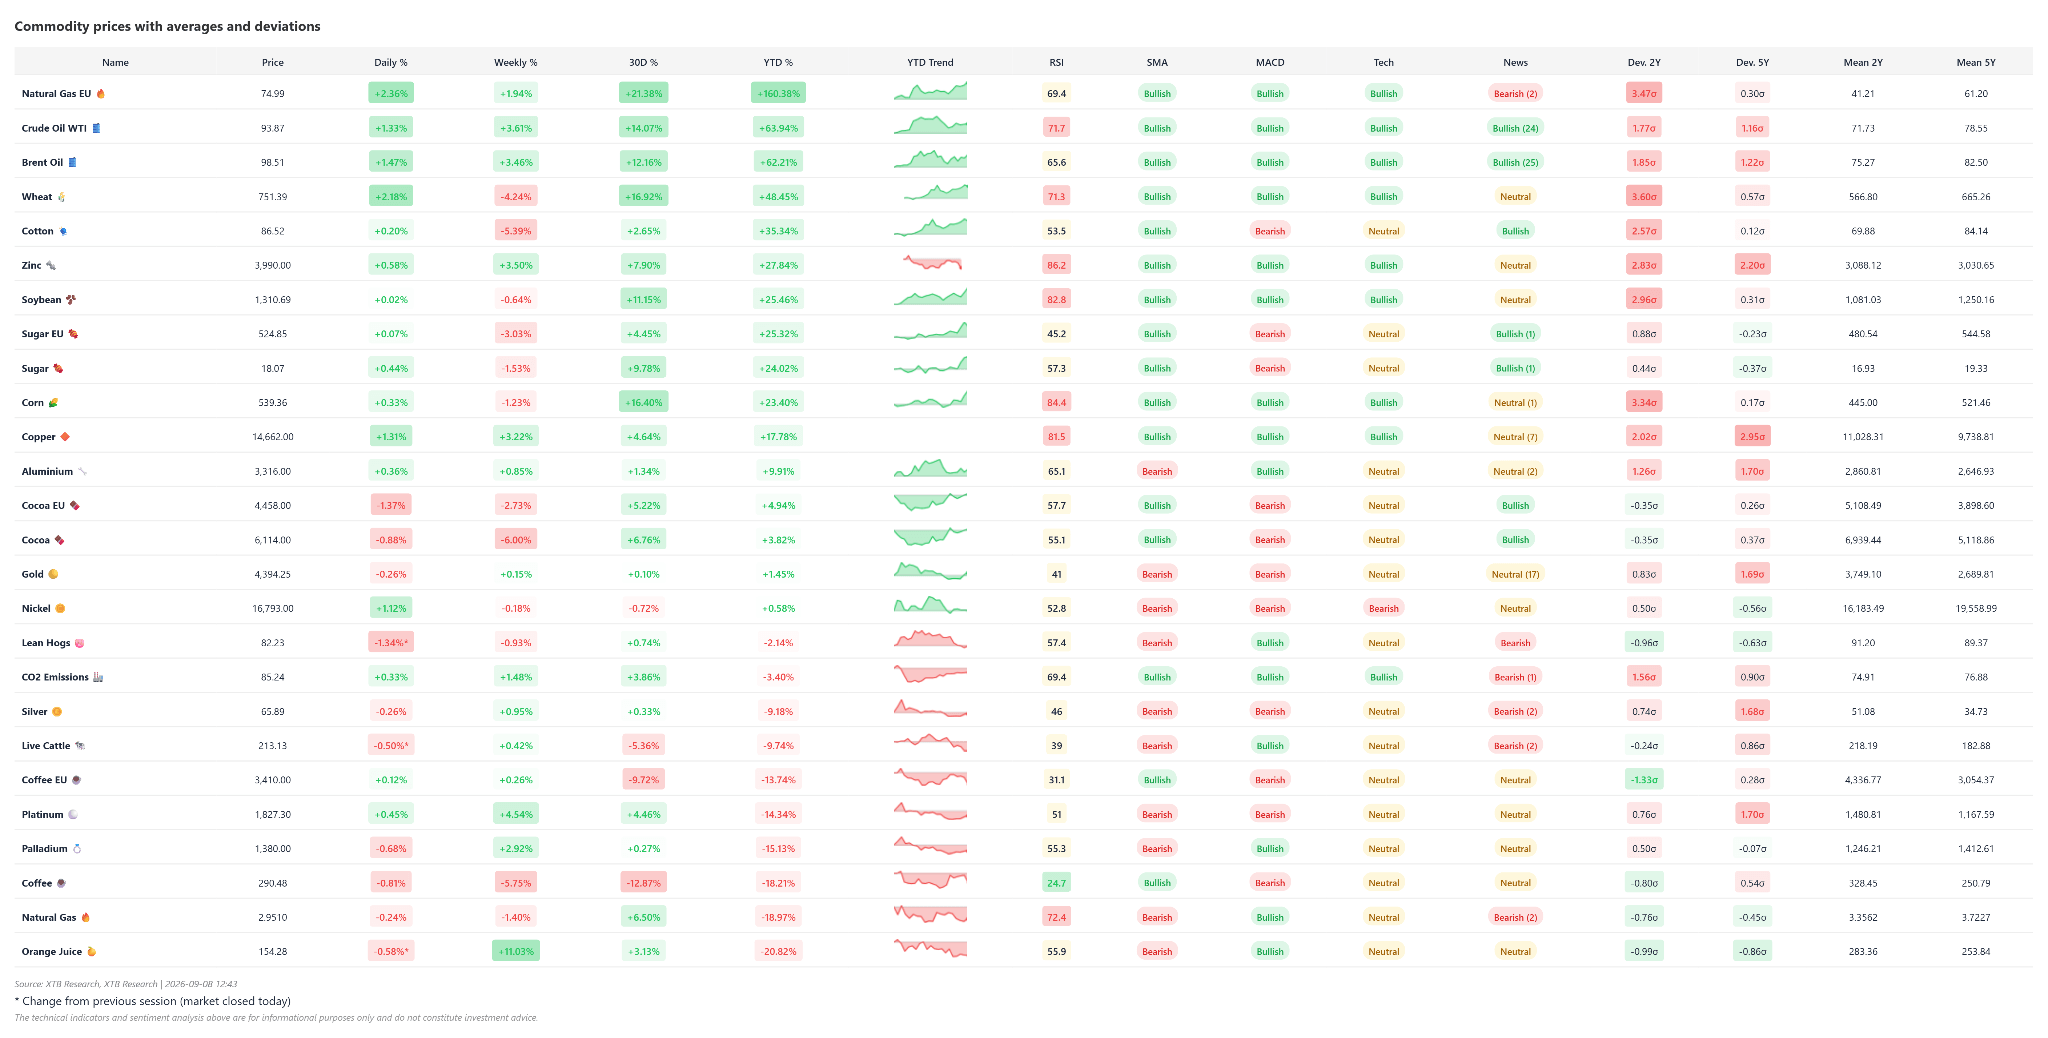
- On Tuesday, September 8, 2026, gains dominate the energy sector in the commodities market, driven by geopolitical tensions and supply concerns. Brent crude is up by 1.61% and approaching $100 per barrel following attacks on Saudi energy infrastructure and a rebound in Chinese import demand.
- Meanwhile, European natural gas is up 2.48% today, supported by low inventory levels in Europe and production disruptions in the Gulf of Mexico. At the other end of the spectrum is the soft commodities sector, where price declines in cocoa and lean hogs are visible for another consecutive day.
- Investors’ attention is primarily drawn to extreme, multi-year price deviations in the metals segment. Copper (+2.95σ from the 5Y mean) and zinc (+2.20σ) lead the industrial rally, aligning with long-term optimism from institutions like BlackRock. Equally strong deviations above historical norms are noted in precious metals, led by gold (+1.69σ), whose valuation remains near $4,400 per ounce in response to unrest in the Middle East.
- In the near term, the key factor for further commodity price dynamics will be the development of the geopolitical situation around Saudi oil facilities. Investors should also closely monitor the upcoming Bank of Japan interest rate decision, which could significantly impact global liquidity and sentiment toward tangible assets.
Wheat
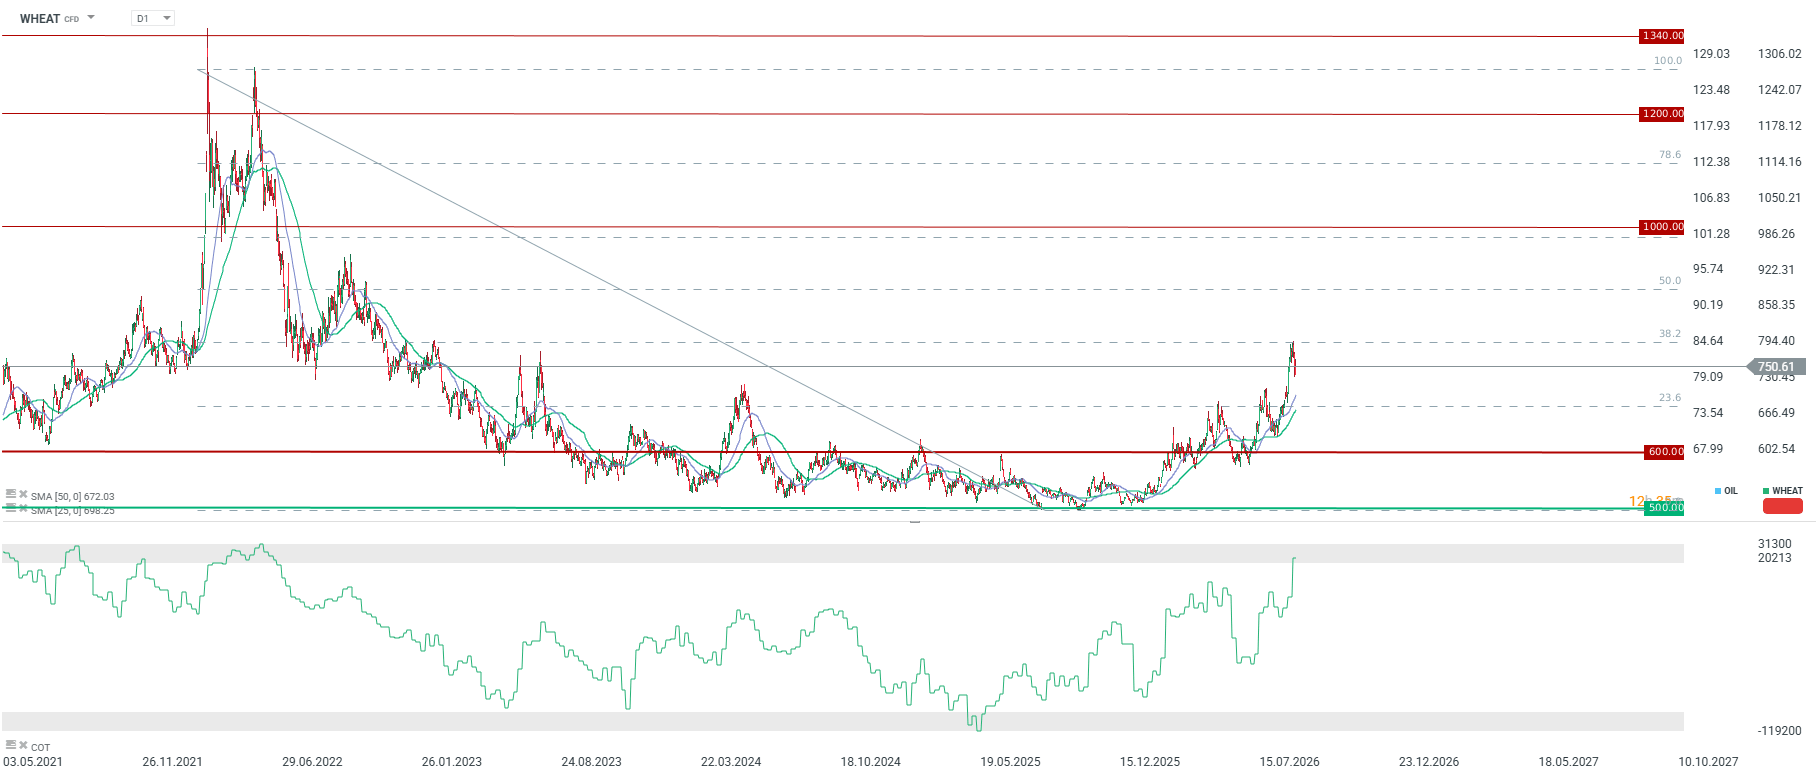
- The current price of wheat is $750, representing an increase of nearly 3% on a daily basis, despite a decline of about 3.5% over the week.
- In longer time horizons, the commodity exhibits strong upward momentum, gaining 18.01% over the month, a full 49.83% year-to-date (YTD), and 45.73% year-over-year. Technical indicators such as SMA and MACD send clear bullish signals, with the price currently sitting 12.82% above its 50-day simple moving average (SMA50).
- However, an RSI level of 72 signals overbought conditions, which could trigger a short-term downside correction in the absence of new catalysts.
- It is worth noting that net positioning in wheat has entered an extreme overbought territory, last observed in 2022.
Fundamental and Market Context
- Late-summer heatwaves are rapidly accelerating crop maturation, forcing agricultural producers to prepare for an early harvest, which could result in a sudden surge in grain supply on the market.
- Rising crude oil prices approaching $100 per barrel due to Middle East tensions are drastically increasing farm fuel and crop transport costs.
- A global diesel shortage, expected to persist through the coming winter, poses serious logistical risks to the distribution and transport of wheat in international markets.
- Currently, the biggest challenge for the wheat market is the disruption of large supply volumes from Russia and Ukraine via Black Sea ports. The lack of prospects for an agreement is driving volatility higher in both wheat and corn.
- The risk of winter natural gas shortages in Europe, particularly in Germany, could curtail nitrogen fertilizer production, drastically raising crop costs for the next growing season.
- The impressive nearly 50% YTD rise in wheat prices reflects concerns over global food security and shrinking inventories among key global exporters.
- Geopolitical tensions in the Middle East, including attacks on Saudi energy facilities and threats around the Strait of Hormuz, indirectly contribute to higher ocean freight rates for grain transport.
- A monthly price increase of 18.01% confirms that market demand significantly exceeds current supply, fueling market momentum and attracting institutional investors to the wheat market.
- Market positioning and overall investor sentiment toward wheat remain decisively optimistic, further supporting demand pressure on commodity exchanges.
Historical Valuation (Z-score)
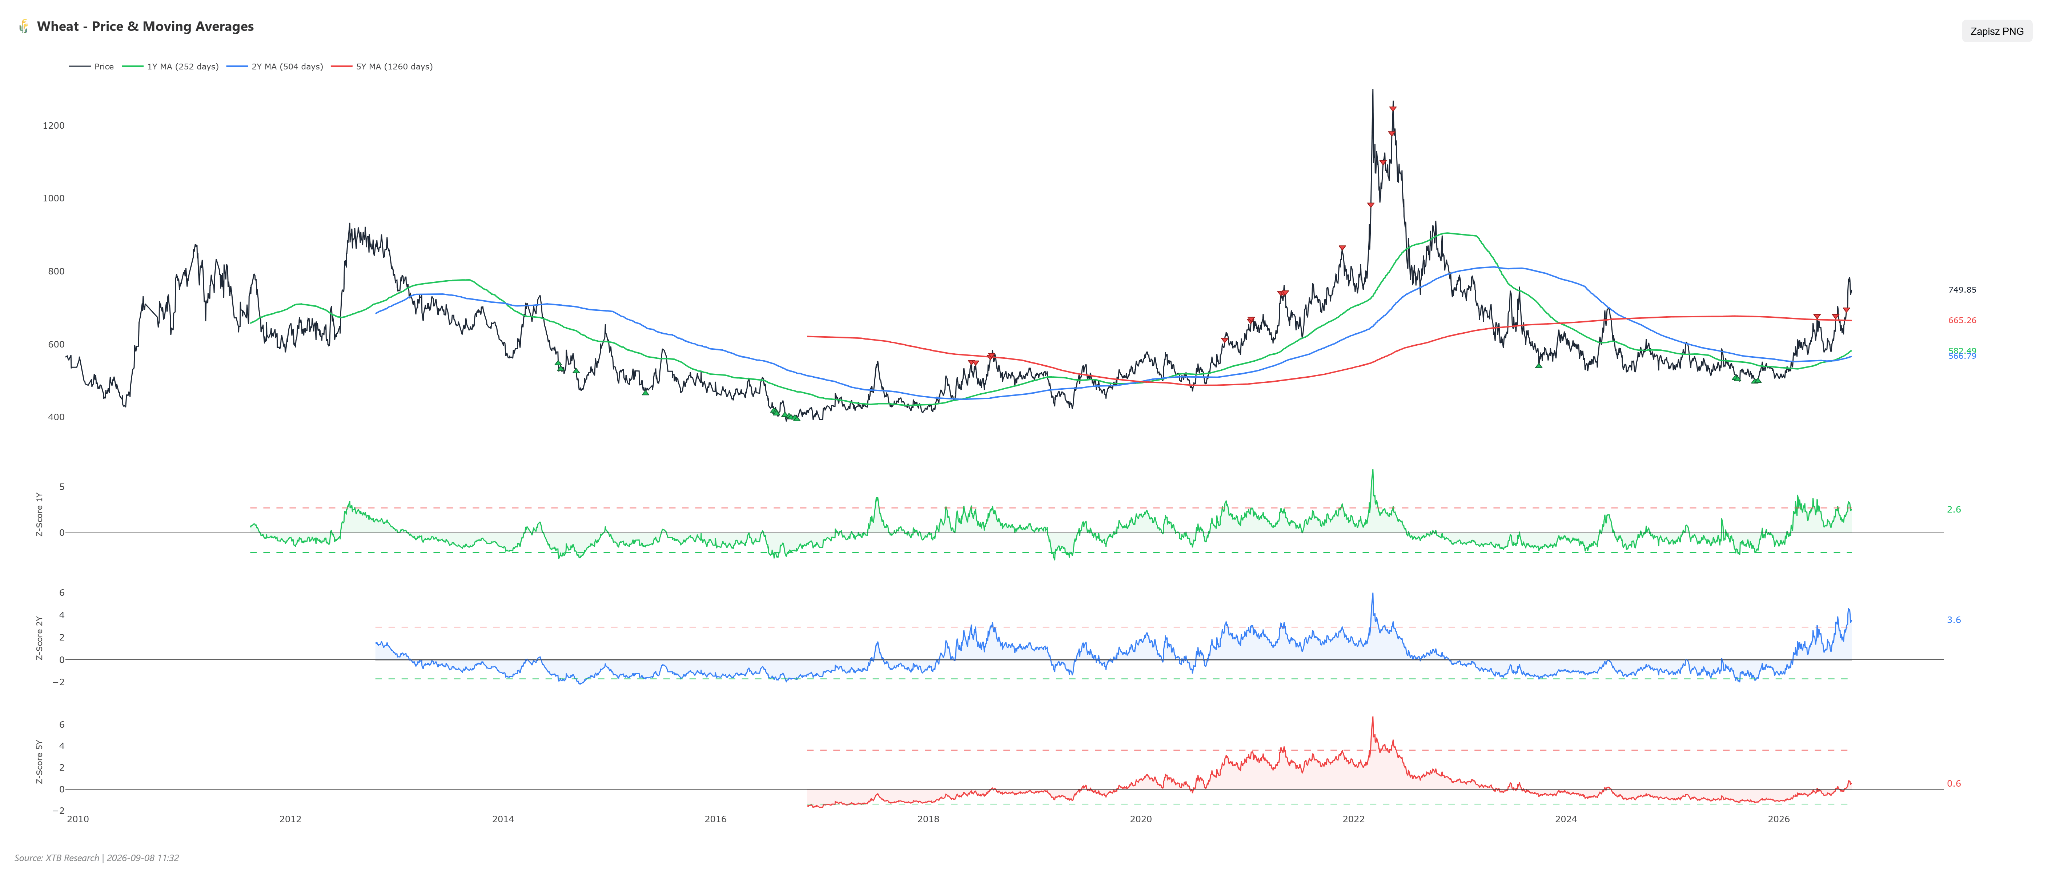
- Historical Z-score valuation metrics for wheat stand at +2.70 for the 1-year horizon and +3.73 for the 2-year horizon, while the 5-year metric currently sits at +0.62.
- Analyzing the trajectory of the 5-year indicator over the past six months reveals a strong upward trend. Six months ago it stood at -0.62, before rebounding slightly to -0.54 three months ago, and continuing higher to -0.23 a month ago, finally reaching its current positive value.
- This evolution shows a dramatic shift from undervaluation to moderate overvaluation on a 5-year scale, significantly raising the risk of a downside correction. Such high deviations, especially in 1-year and 2-year terms, suggest that the market is currently overheated and vulnerable to profit-taking by investors.
Scenarios
- Bullish scenario: For the upward trend to be sustained, factors related to further logistical bottlenecks from diesel shortages and an escalating European energy crisis must coincide, driving a surge in fertilizer prices. Additionally, if the early harvest caused by heatwaves results in poorer grain quality and lower yields than expected, demand pressure will rise. Breaking key local resistance levels while maintaining strong MACD and SMA signals could test the psychological $780.00 barrier, and under a strong impulse scenario, prices could move toward $810.00.
- Bearish scenario: The bearish scenario assumes that heat-accelerated harvesting brings a swift influx of grain to the market, temporarily satisfying demand and triggering seller pressure. Furthermore, profit-taking driven by a strongly overbought RSI and any easing of crude oil market sentiment would lower transport costs. An agreement regarding Black Sea agricultural exports could reduce the significant premium in the grain market. Under these conditions, wheat prices could break local support and fall toward the SMA50 around $672.00, testing $650.00 in a deeper correction.
Gold
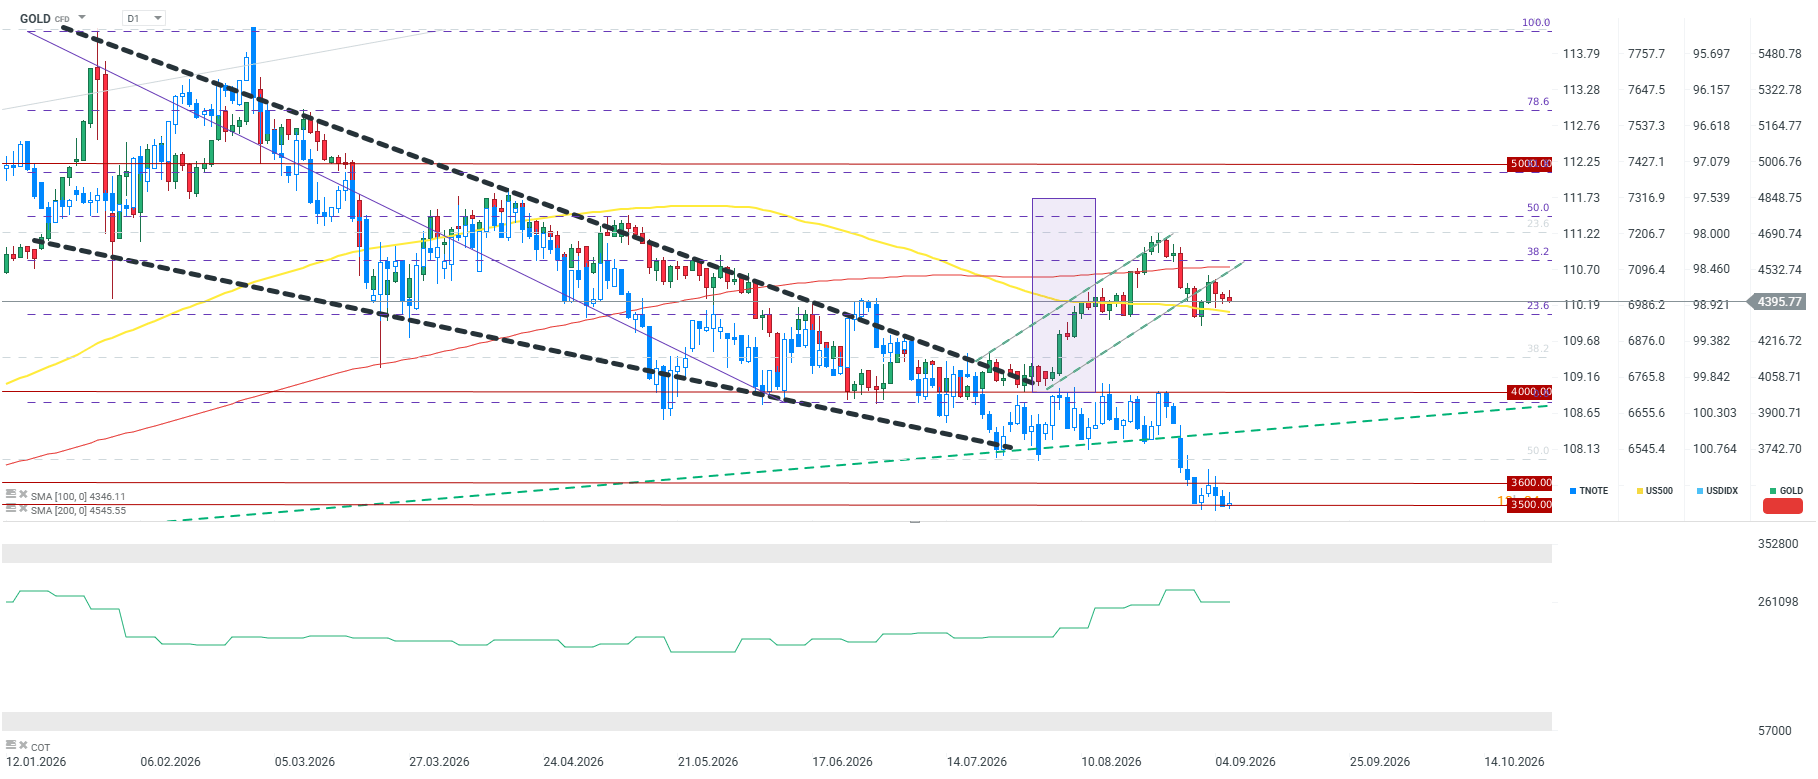
- As of September 8, 2026, the price of gold is trading below $4,400, marking a modest daily decline of about 0.3%, while showing gains of 0.15% weekly, 0.09% monthly, and 1.44% YTD.
- On an annual basis, the precious metal shows a strong gain of 21.18%, though it is currently in a local consolidation phase, as indicated by neutral market sentiment and trading 3.28% above its 50-day moving average (SMA50).
- Technical indicators, such as an RSI of 41 and bearish signals from SMA and MACD, suggest supply dominance in the short term.
- Key short-term resistance remains near recent highs around $4,500, while primary technical support lies near $4,250 and at the SMA50. Short-term support is positioned near $4,337 at the 23.6% Fibonacci retracement of the latest downward wave.
- Gold prices remain in a major divergence from US T-Note bond prices.
Fundamental and Market Context
- Gold prices remain elevated below $4,400, reflecting an impressive 21.18% annual rise that confirms a strong long-term uptrend. On the other hand, relative to its recent short-term peak, gold appears to be losing upward momentum.
- The correlation between gold and Bitcoin has fallen to very low levels by historical standards, indicating a decoupling of these two asset classes and independent price action for the metal.
- Historically, gold prices tend to rally strongly prior to the onset of major bull runs in the cryptocurrency market, a pattern clearly visible in the 2020–2021 and 2024–2025 cycles.
- Rising counterparty risk in the global economy creates highly favorable conditions for gold, which alongside Bitcoin is viewed as a crucial hedge against traditional financial system instability.
- Concerns regarding Federal Reserve interest rates and hawkish US monetary policy put pressure on non-yielding gold, limiting its potential for an immediate breakout from its current consolidation.
- The Fed’s decision takes place next Wednesday, with markets pricing in a 60% probability of a rate hike—a likelihood that rose following solid NFP data. Friday’s CPI inflation report could be the decisive factor for the Fed.
- Escalating Middle East tensions, including strikes between the US and Iran as well as attacks on energy infrastructure, sharply increase global risk aversion—theoretically favoring gold, but simultaneously raising risks of persistent inflation and rate hikes.
- Gold is increasingly positioned by fund managers as a wealth insurance policy, gaining importance amid elevated tech valuations and potential macroeconomic turbulence.
- Long-term physical gold demand prospects remain robust, driven by ongoing central bank reserve diversification amid rising global debt and geopolitical fragmentation.
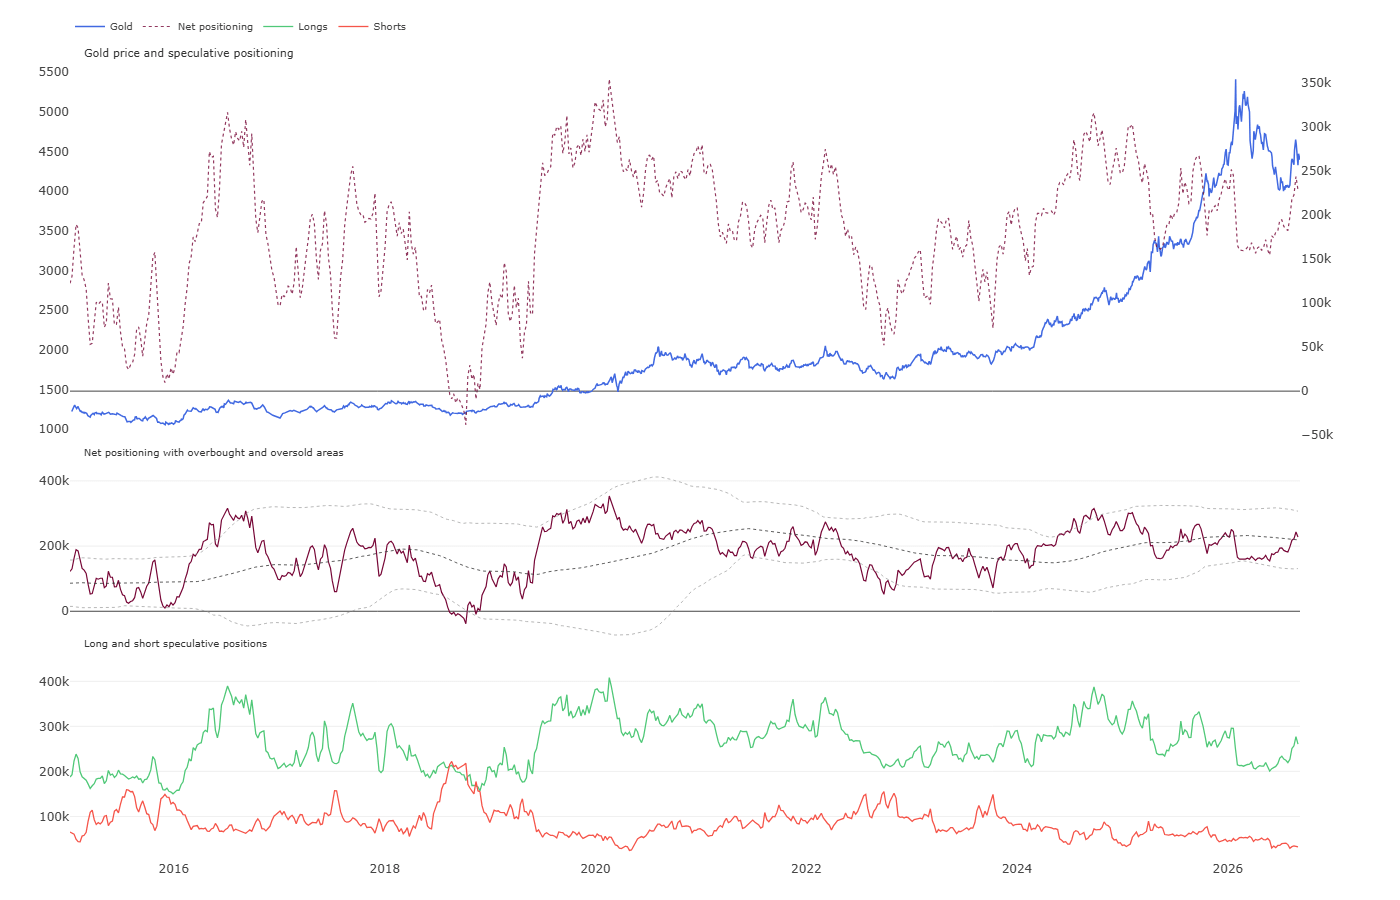
Buyers slightly trimmed long positions last week, which may be linked to rising US yields. Source: CFTC, XTB
Historical Valuation (Z-score)
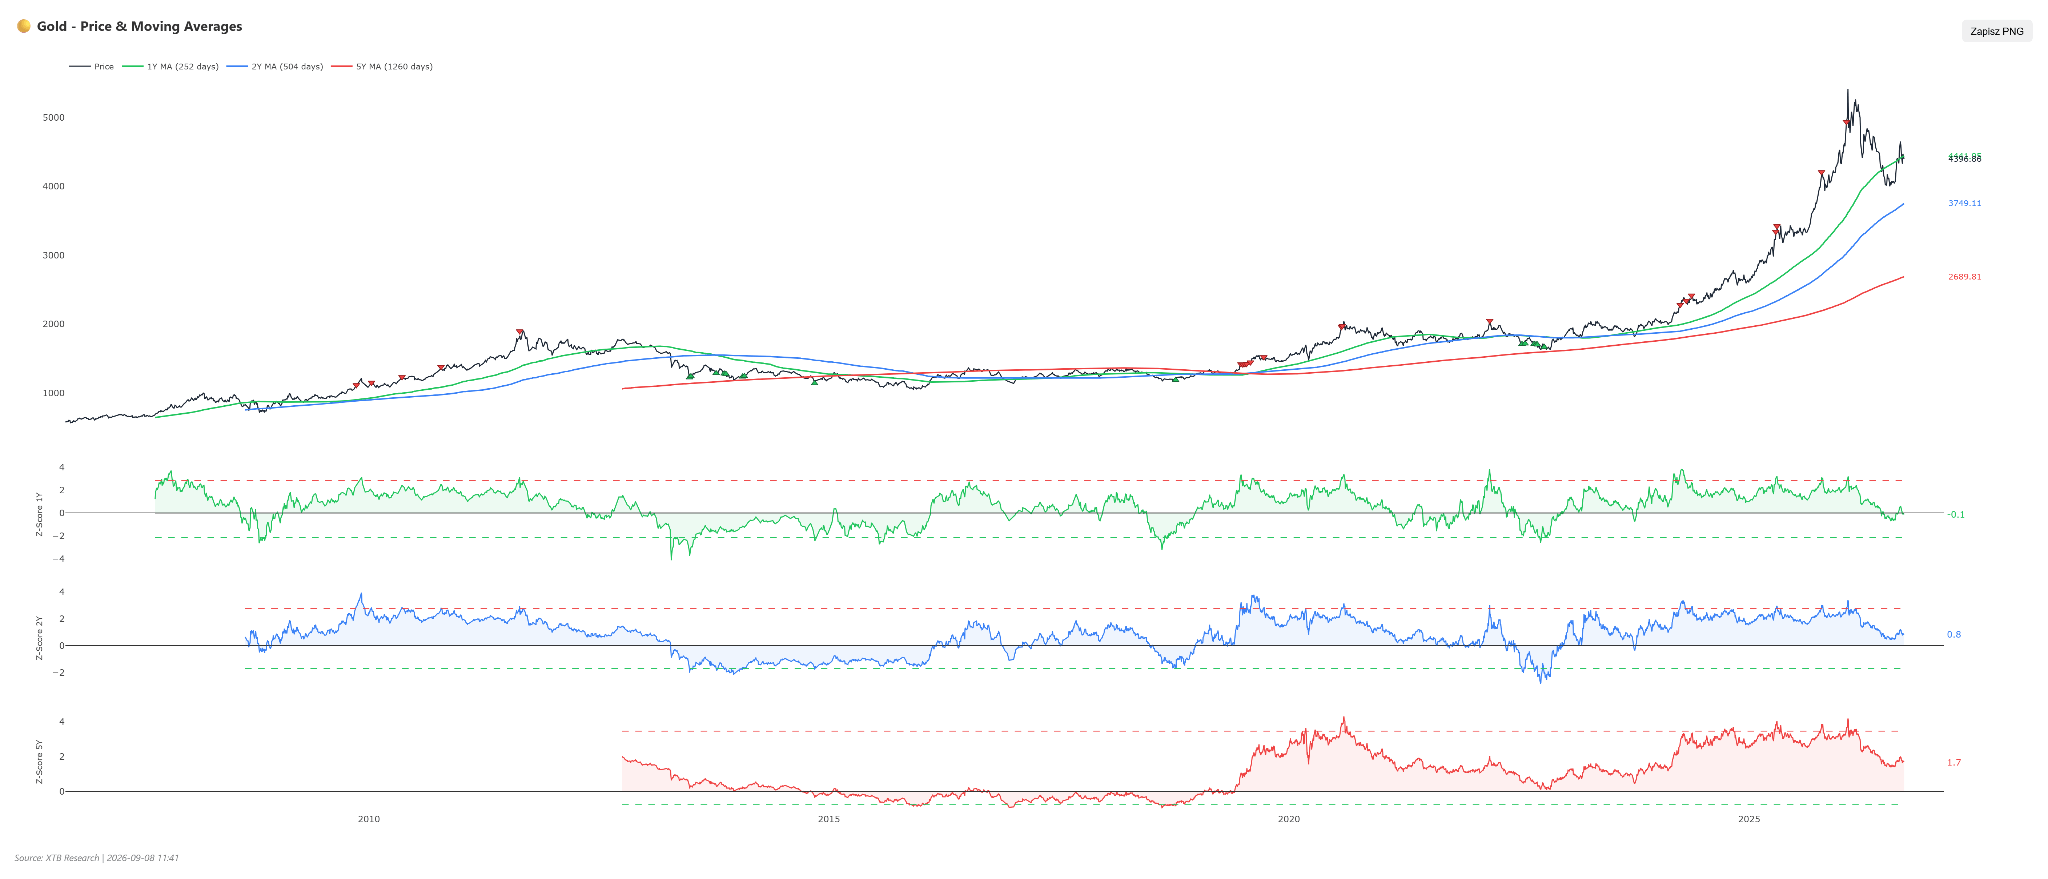
- Z-score analysis for gold reveals a nuanced valuation picture across different timeframes. The short-term 1-year Z-score (Z1Y) currently stands at -0.13, indicating the price is slightly below its 1-year average. On a 2-year horizon, Z2Y reaches +0.83, while the long-term 5-year Z5Y is +1.69.
- Examining the evolution of the 5-year Z-score over the past six months highlights a clear downward trend. Six months ago, this metric stood at +3.28, falling to +1.84 three months ago, +1.72 a month ago, and stabilizing at +1.69 currently.
- This trend reflects a gradual easing of the extreme historical overvaluation seen earlier in the year. The decline in the Z5Y metric reduces the risk of a sharp pullback and suggests gold is undergoing a healthy consolidation, bringing valuations closer to long-term averages.
Scenarios
- Bullish scenario: A surge in systemic financial stability concerns and counterparty risk could drive safe-haven flows into gold. Dovish Fed pivot signals or falling Treasury yields in response to economic slowing would add tailwinds. Technically, a sustained breakout above $4,500 with MACD turning positive would open the door toward historic highs near $4,750–$4,800.
- Bearish scenario: A Fed rate hike driven by persistent inflation concerns would strengthen the dollar and boost yields, reducing gold’s appeal. Technically, breaking SMA50 support with RSI dipping below 40 would signal a deeper selloff, potentially pushing gold below $4,300 toward structural support at $4,150.
WTI Crude Oil
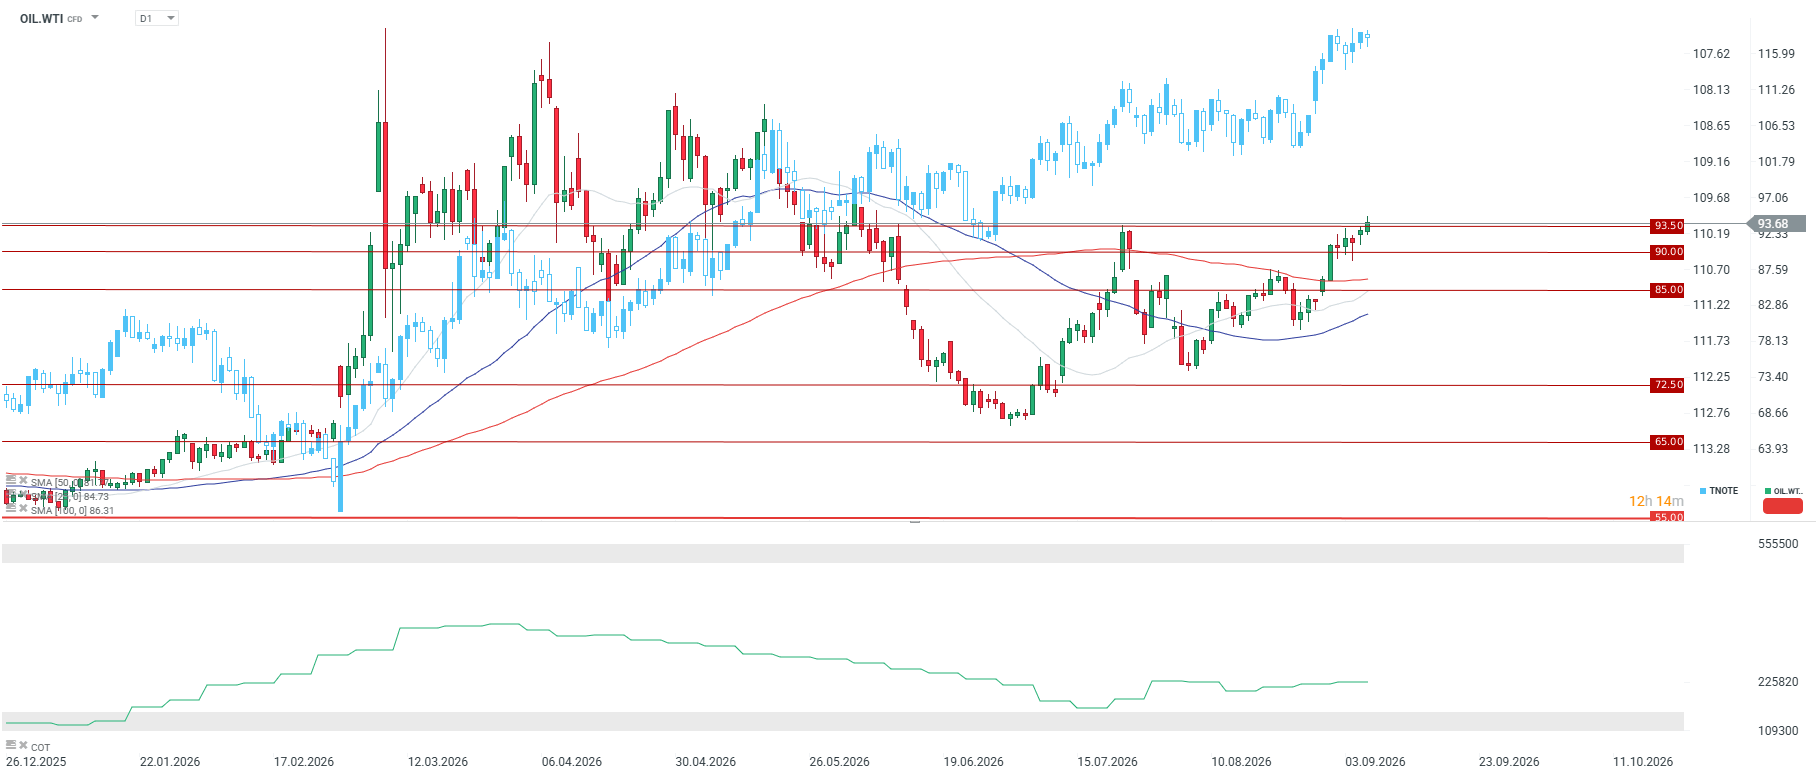
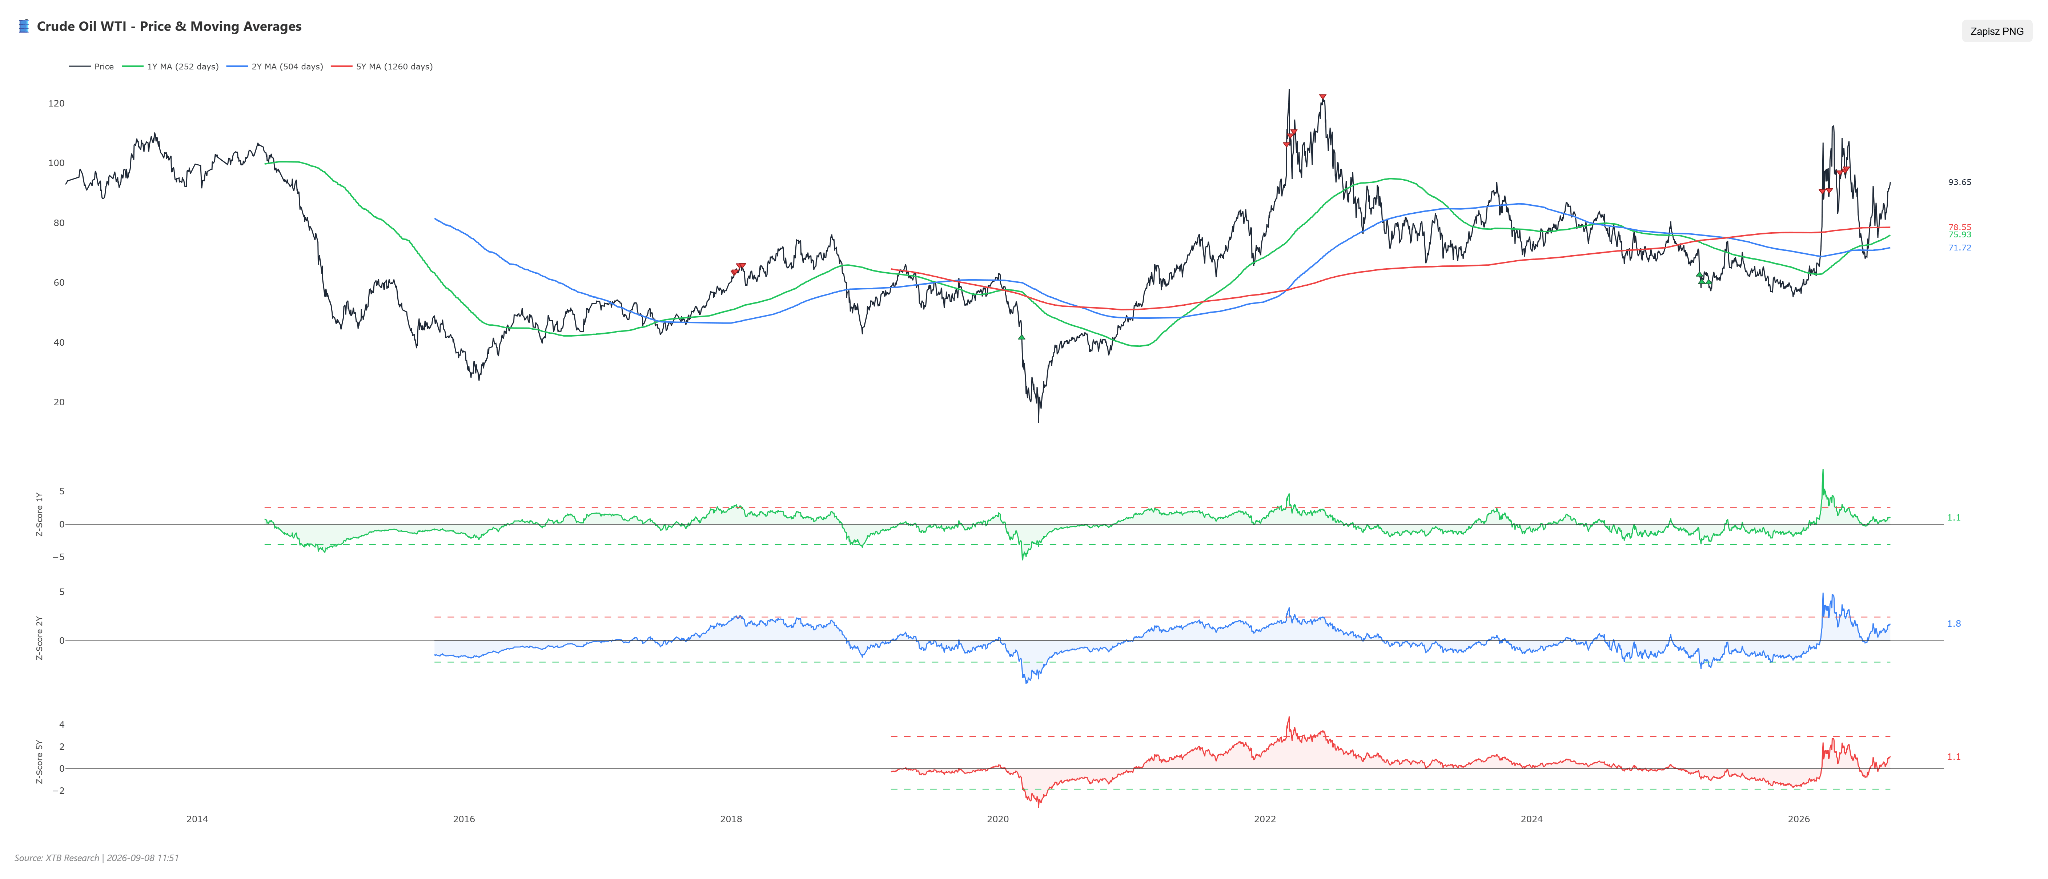
- WTI crude oil (OIL.WTI) trades just below $94 on September 8, 2026, marking a solid daily gain of 1.3%, ~4% weekly, and under 15% monthly, backed by an impressive ~64% YTD gain and +50% YoY.
- Technical indicators point to a strong uptrend, with both moving averages (SMA) and MACD generating bullish signals, while prices sit 15.40% above the 50-day moving average.
- An RSI reading of 72 signals overbought technical conditions, which alongside bullish market sentiment could foreshadow tests of $95.00 resistance and the psychological $100.00 level, while key support rests near the recently breached $92.00 level.
Fundamental and Market Context
- The recent surge in oil prices is a direct market reaction to escalated military conflict in the Middle East following exchanges between the US and Iran.
- WTI futures surged past the key $94.00 per barrel mark to reach their highest levels since mid-June, reflecting panic buying among physical buyers and speculators.
- The futures curve currently shows steepening backwardation.
- Direct threats to Persian Gulf oil supply stability emerged from Iranian-backed Houthi forces in Yemen, who threatened further strikes on Saudi targets after attacking energy infrastructure.
- Supply disruption fears are compounded by macroeconomic uncertainty surrounding upcoming Federal Reserve rate decisions, amplifying WTI price volatility.
- A strong bullish impulse for WTI also stems from Europe, where Brent crude nearly touched the psychological $100 benchmark following Saudi oil field attacks.
- Demand-side pressure is boosted by pre-winter fuel deficit concerns, which amid constrained global refining capacity significantly raises crack spreads and drives crude buying.
- OPEC+’s recent decision to maintain output quotas met expectations, though producers remain unable to ramp up output to target capacity levels.
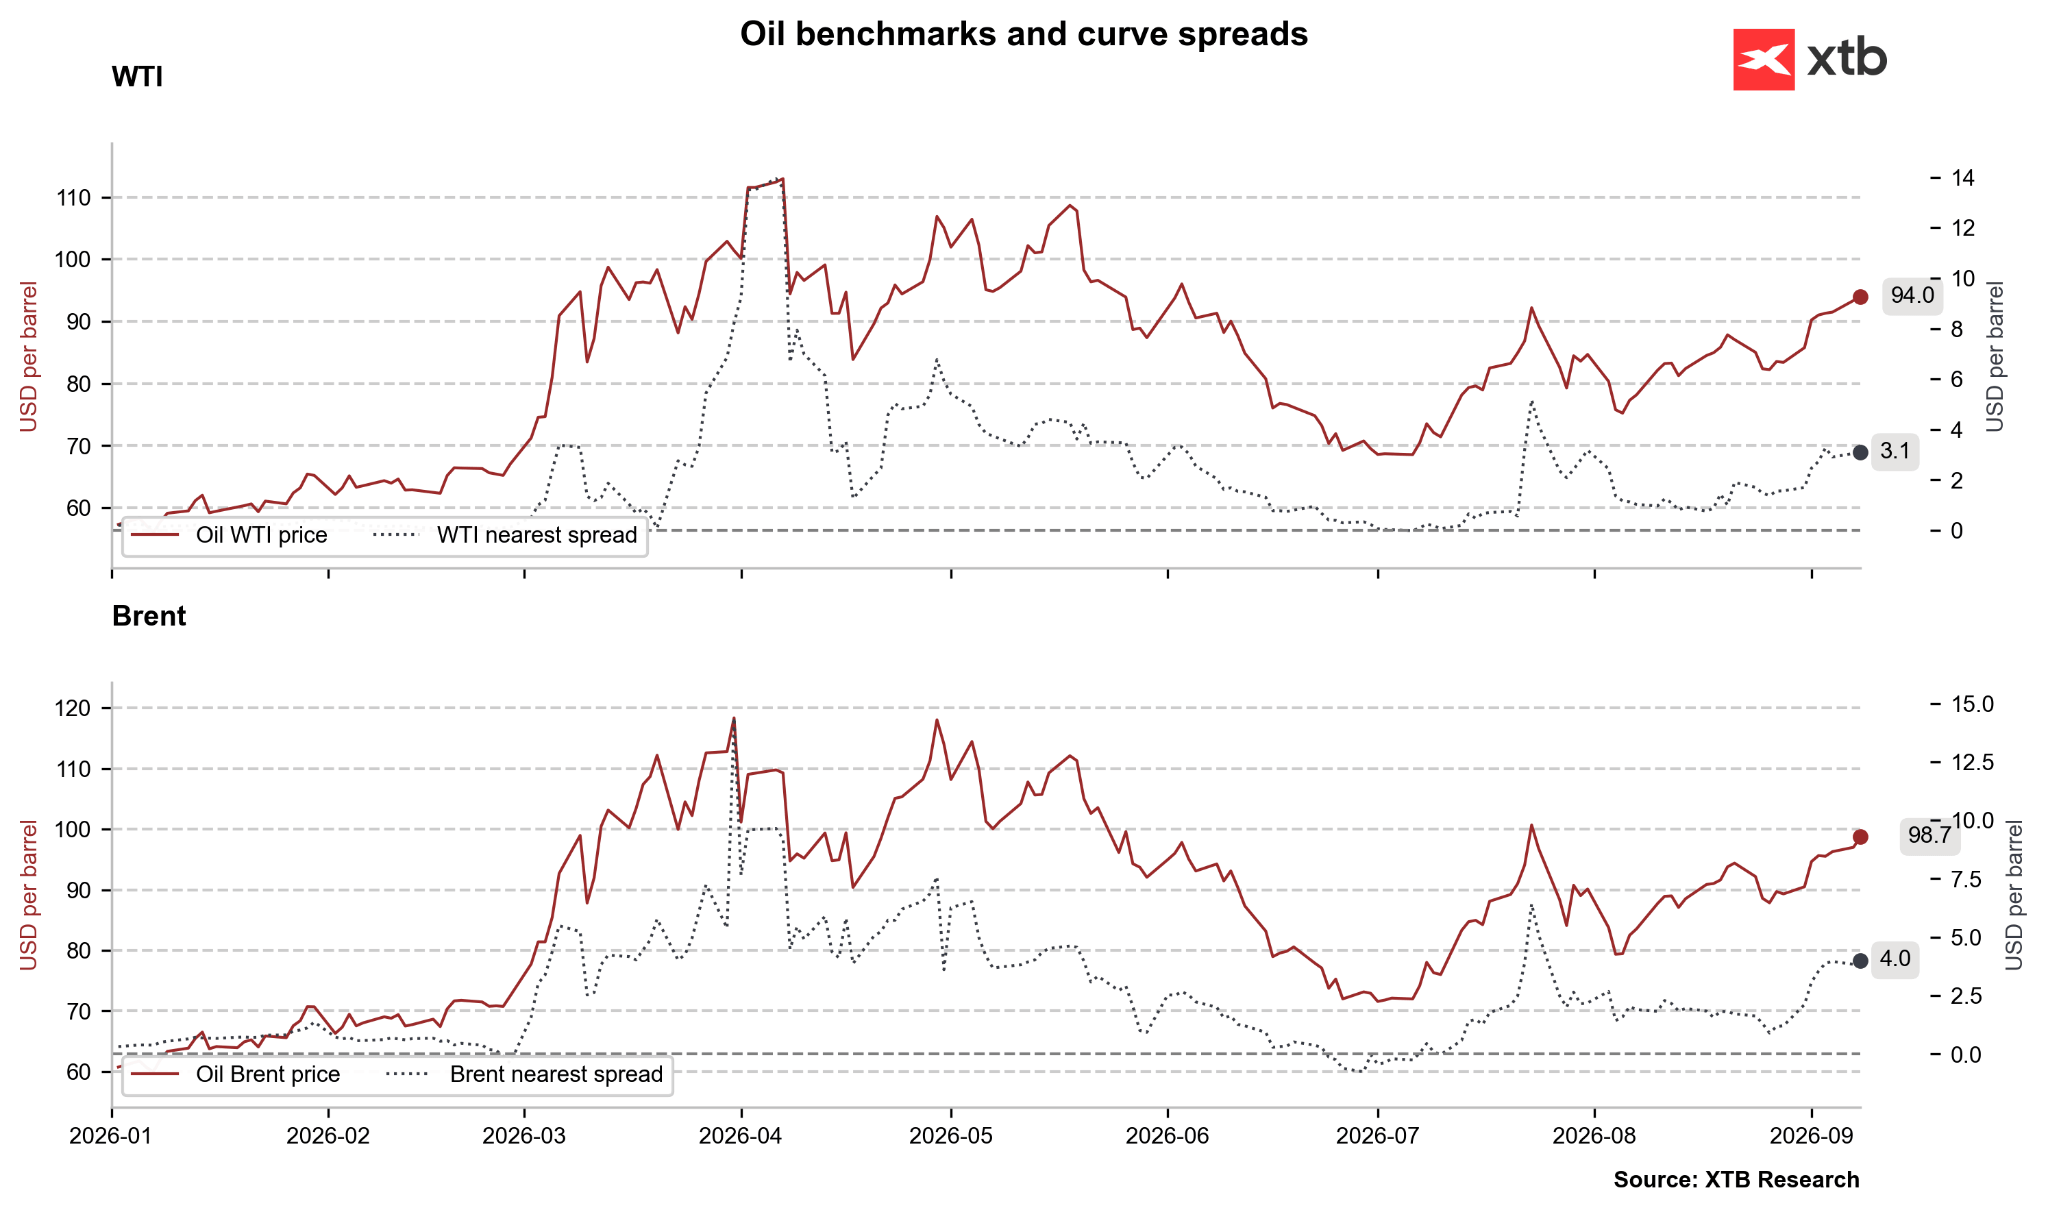
Calendar spreads remain elevated but show signs of stabilizing, which on one hand could limit near-term upside, but on the other suggests prices may remain anchored at elevated levels longer. Source: Bloomberg Finance LP, XTB
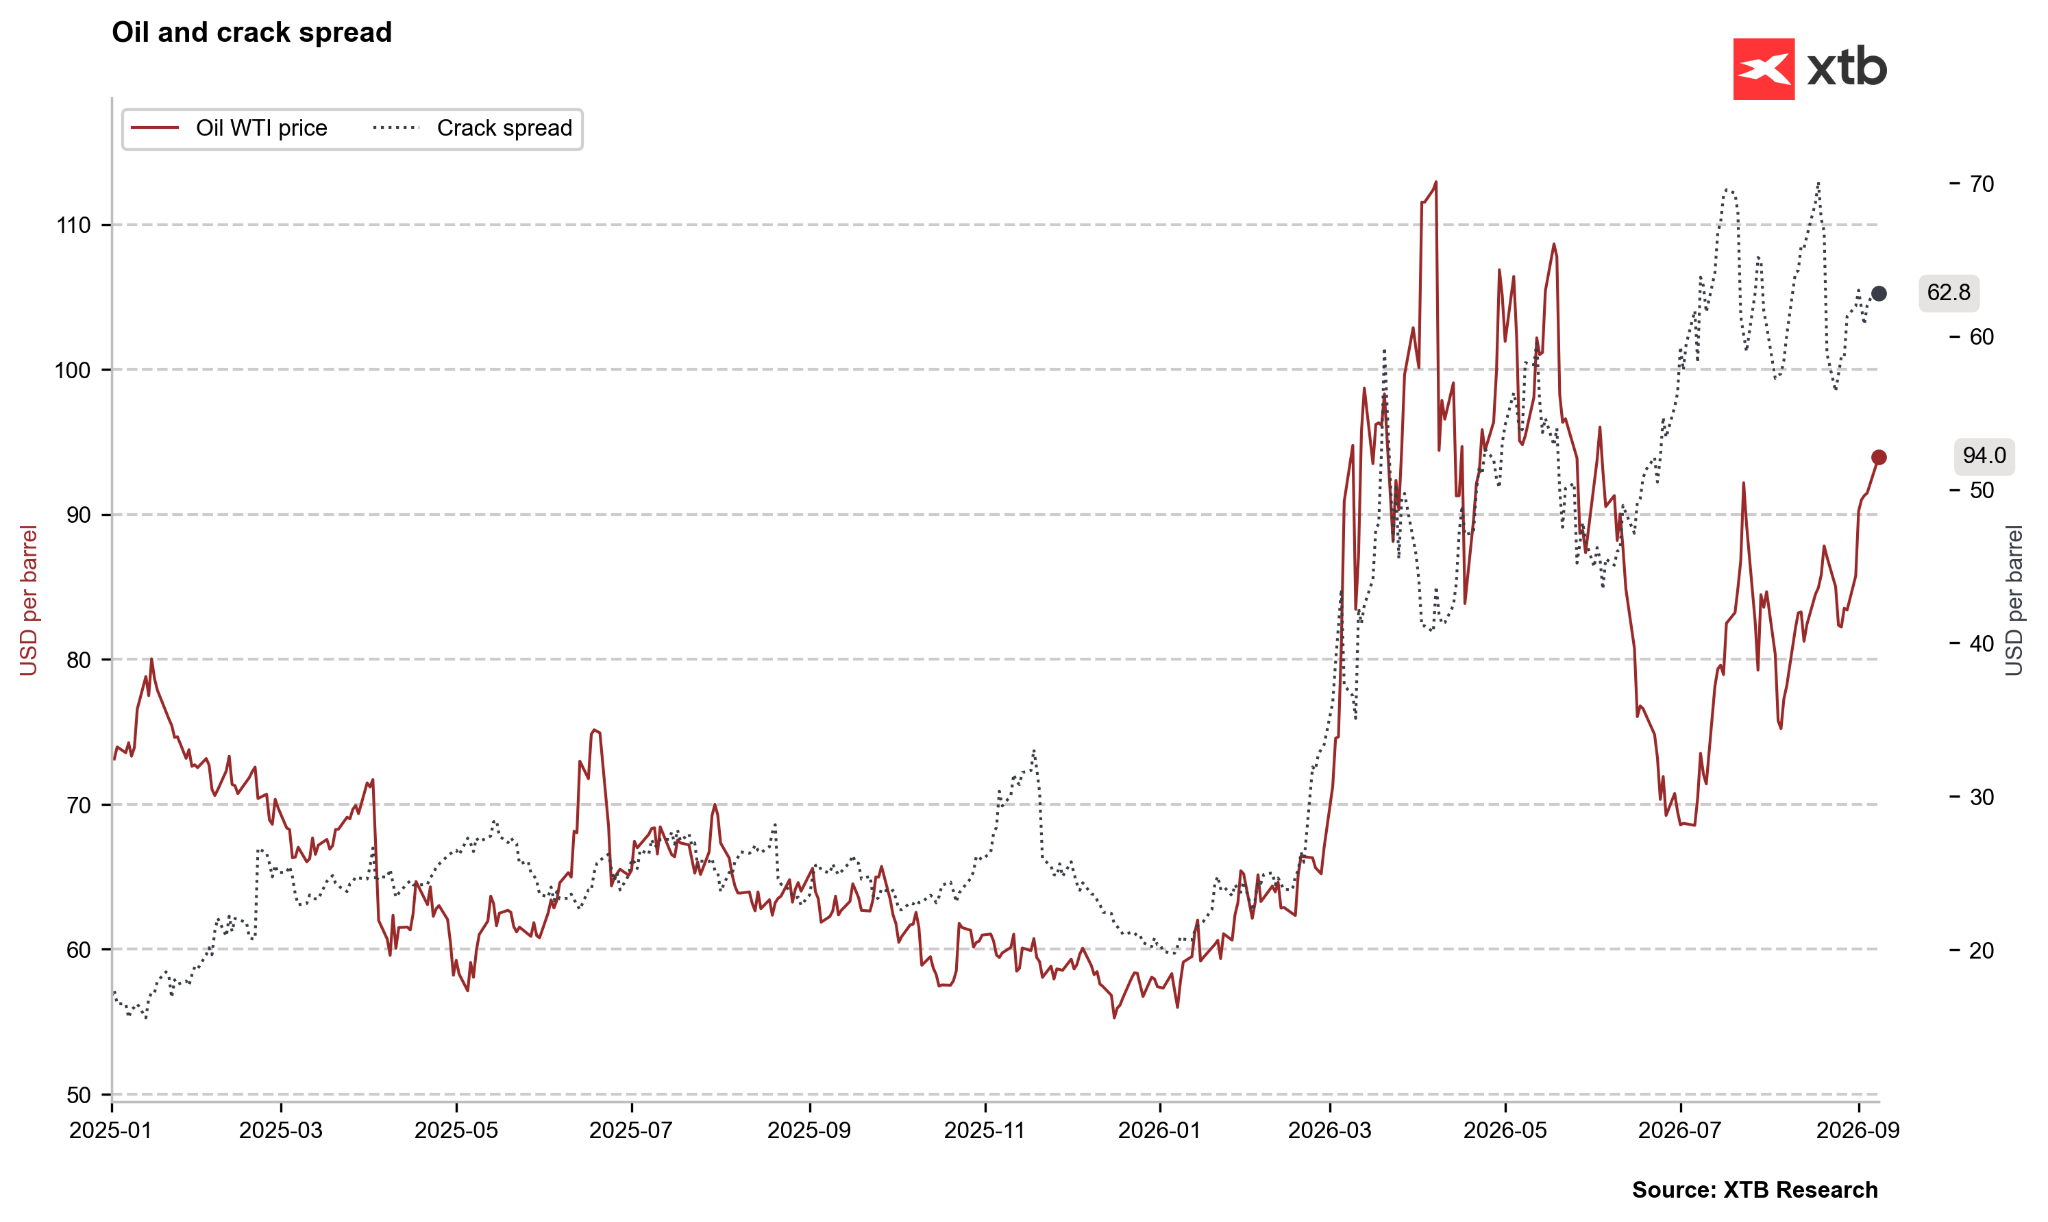
Noteworthy is that recent gains are concentrated in crude oil itself, while crack spreads are not advancing rapidly. This may indicate easing urgency from refiners to procure crude at current high prices. Source: Bloomberg Finance LP, XTB
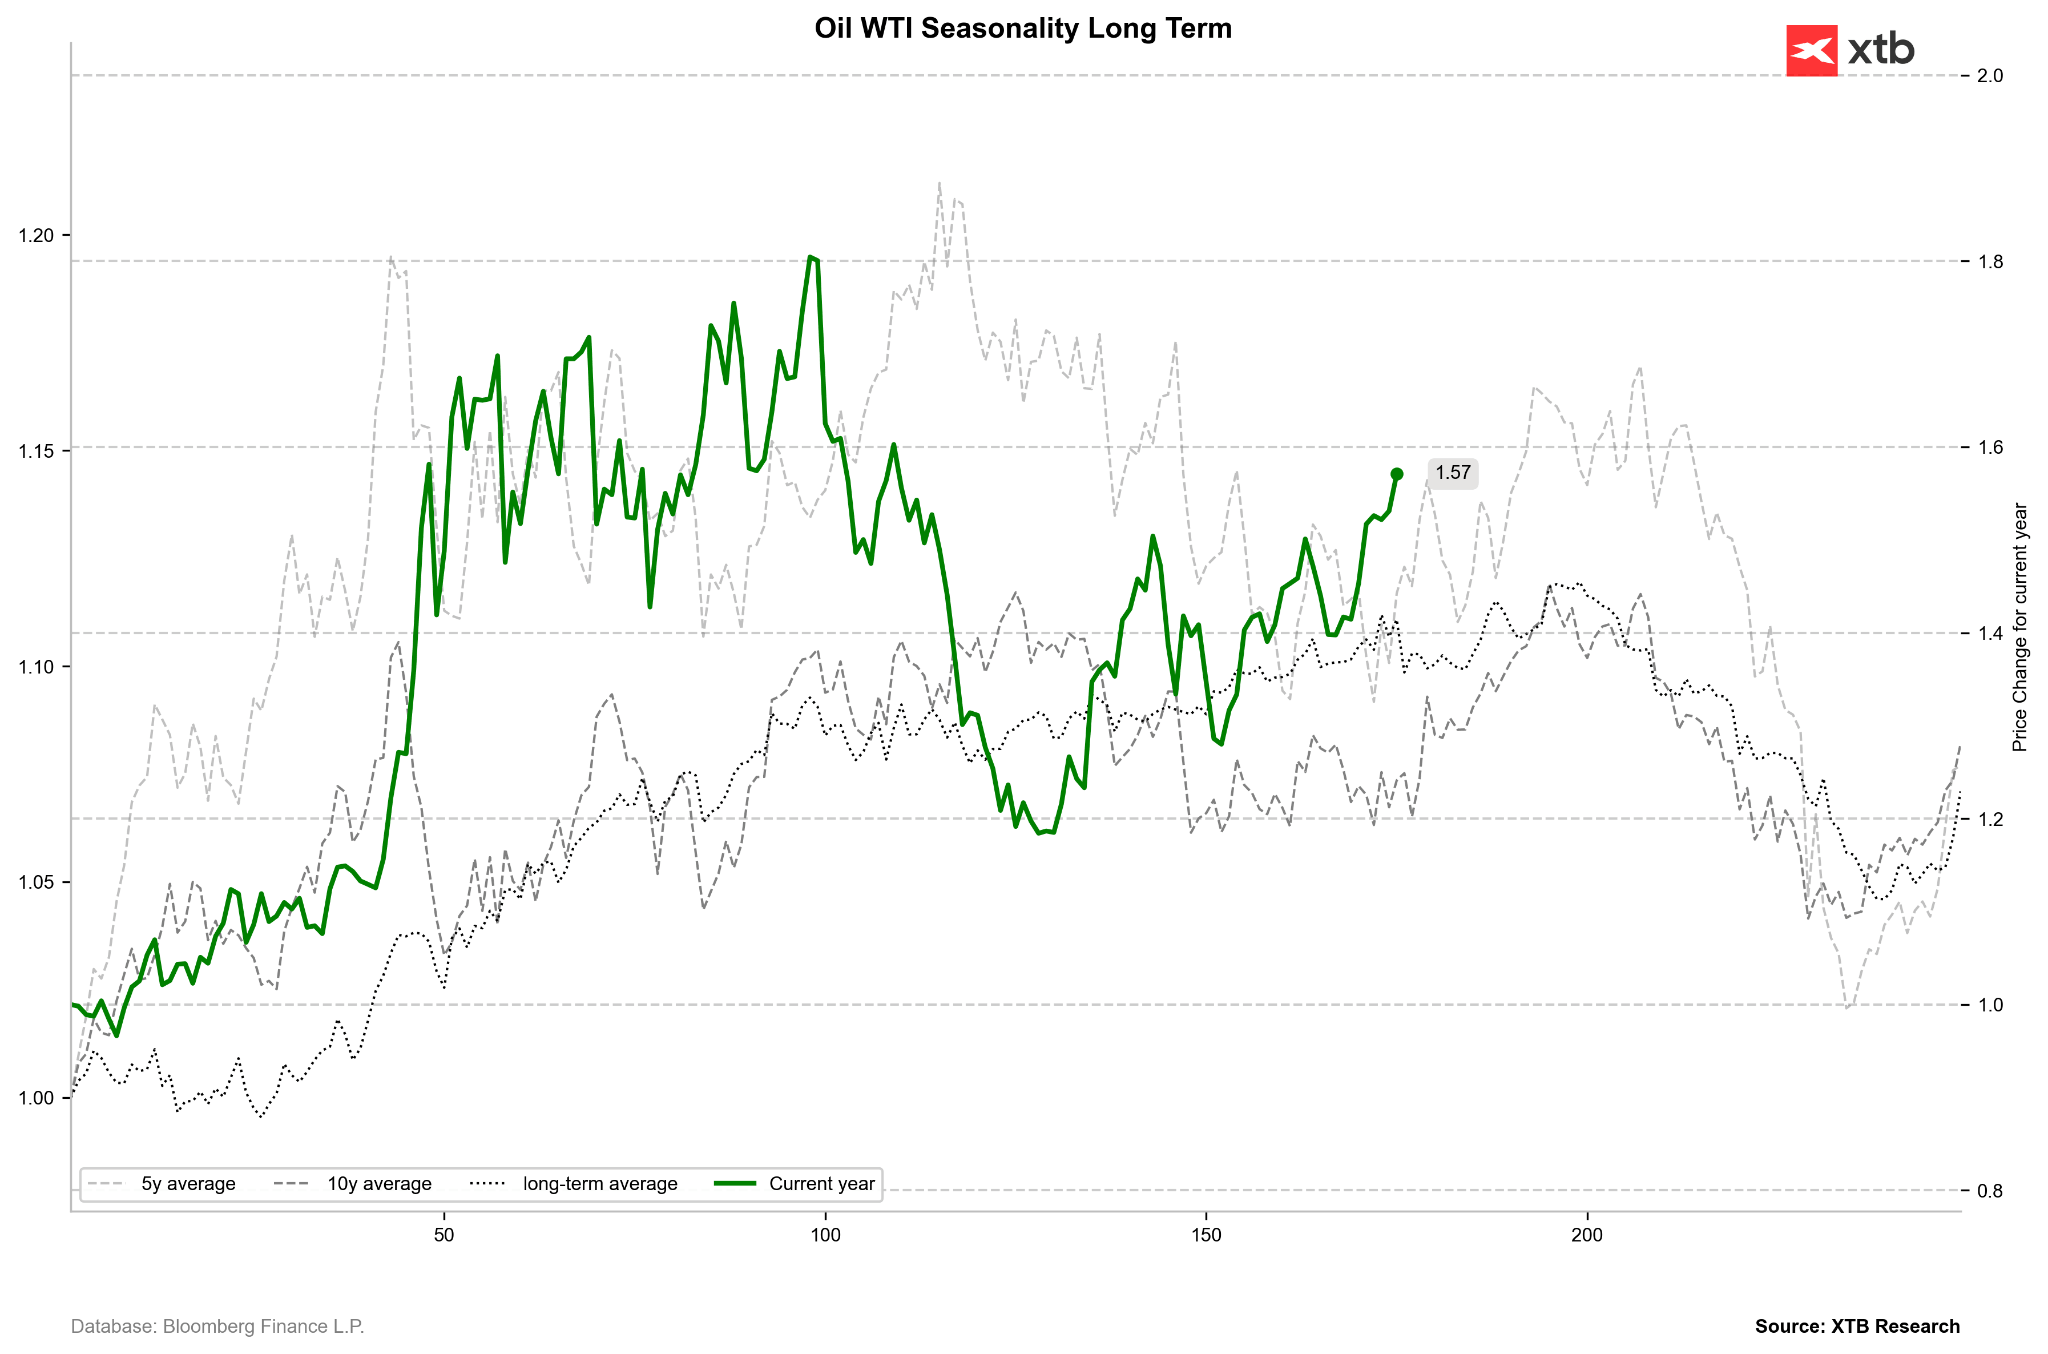
Crude oil is in a seasonal bullish window that typically peaks around session 200, near late October. Source: Bloomberg Finance LP, XTB
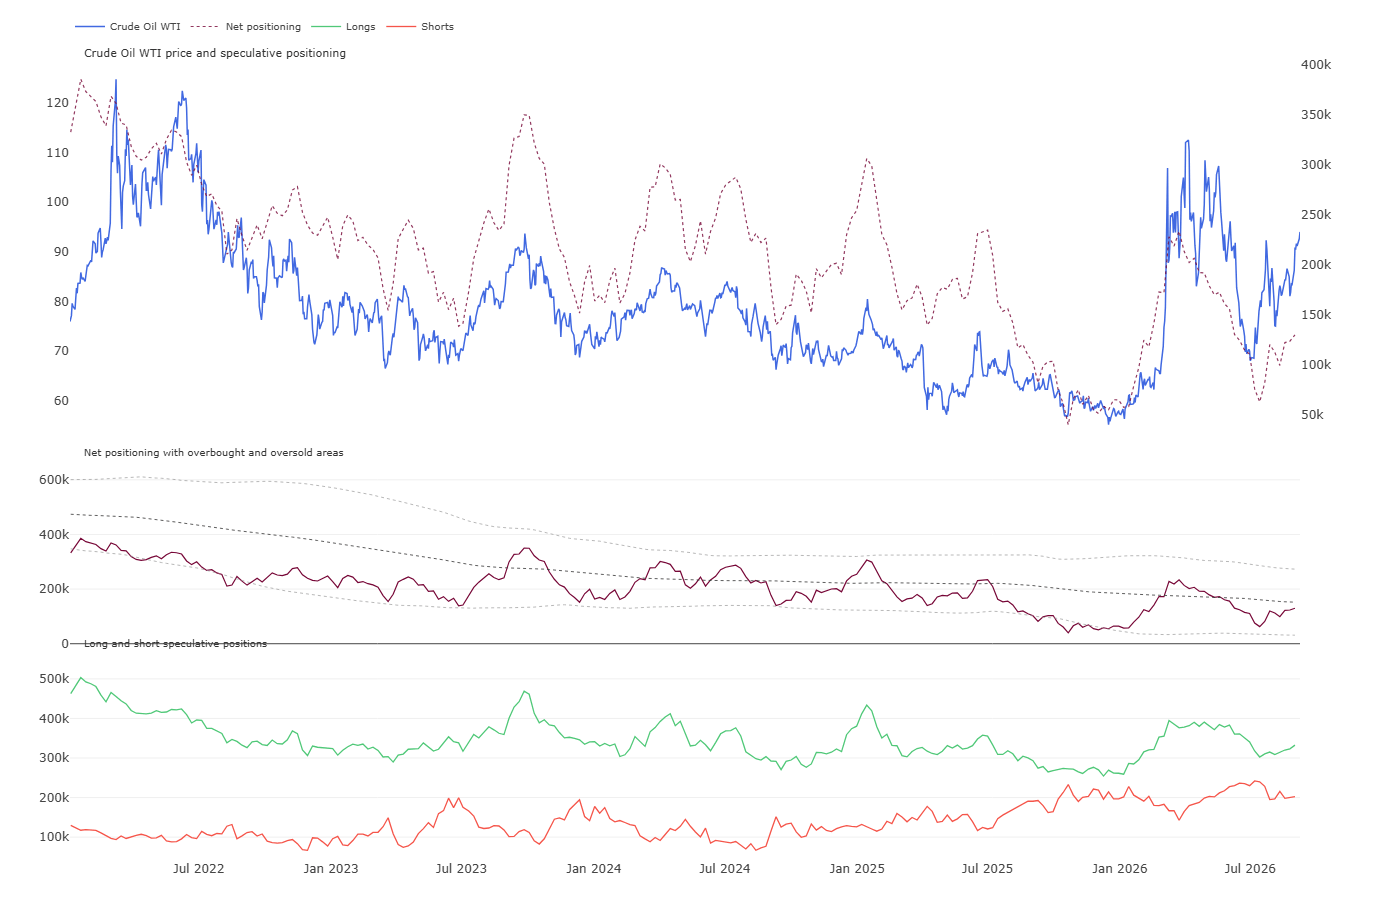
Net positioning rebounded to average levels, though long positions remain relatively low given the massive price rally. Source: CFTC, XTB
Historical Valuation (Z-score)
- Historical Z-score valuation metrics for WTI crude oil sit at elevated levels, standing at +1.15 for the 1-year horizon (Z1Y), +1.81 for 2 years (Z2Y), and +1.19 for 5 years (Z5Y).
- Tracking the 5-year Z-score over the last six months shows marked volatility. Six months ago it stood at +0.87, rising slightly to +0.98 three months ago, before sharply falling into negative territory at -0.11 a month ago, only to rebound aggressively to its current +1.19 level.
- This trajectory highlights a rapid shift from relative undervaluation to significant overvaluation relative to historical norms. It signals elevated downside correction risk should geopolitical premiums fade, as current prices rely heavily on risk pricing rather than demand fundamentals alone.
Scenarios
- Bullish scenario: Further Middle East escalation through attacks on Saudi oil infrastructure or a Hormuz block, supported by bullish MACD/SMA technicals, would sustain upward pressure. Under these conditions, WTI could breach $95.00 resistance toward $100.00, with extended potential toward $103.50.
- Bearish scenario: Diplomatic de-escalation between the US, Iran, and Saudi Arabia would rapidly deflate geopolitical risk premiums. Paired with profit-taking on an overbought market (RSI > 72) and hawkish Fed concerns, WTI could retreat below $92.00 support toward its SMA50 near $81.80.
Natgas.EU
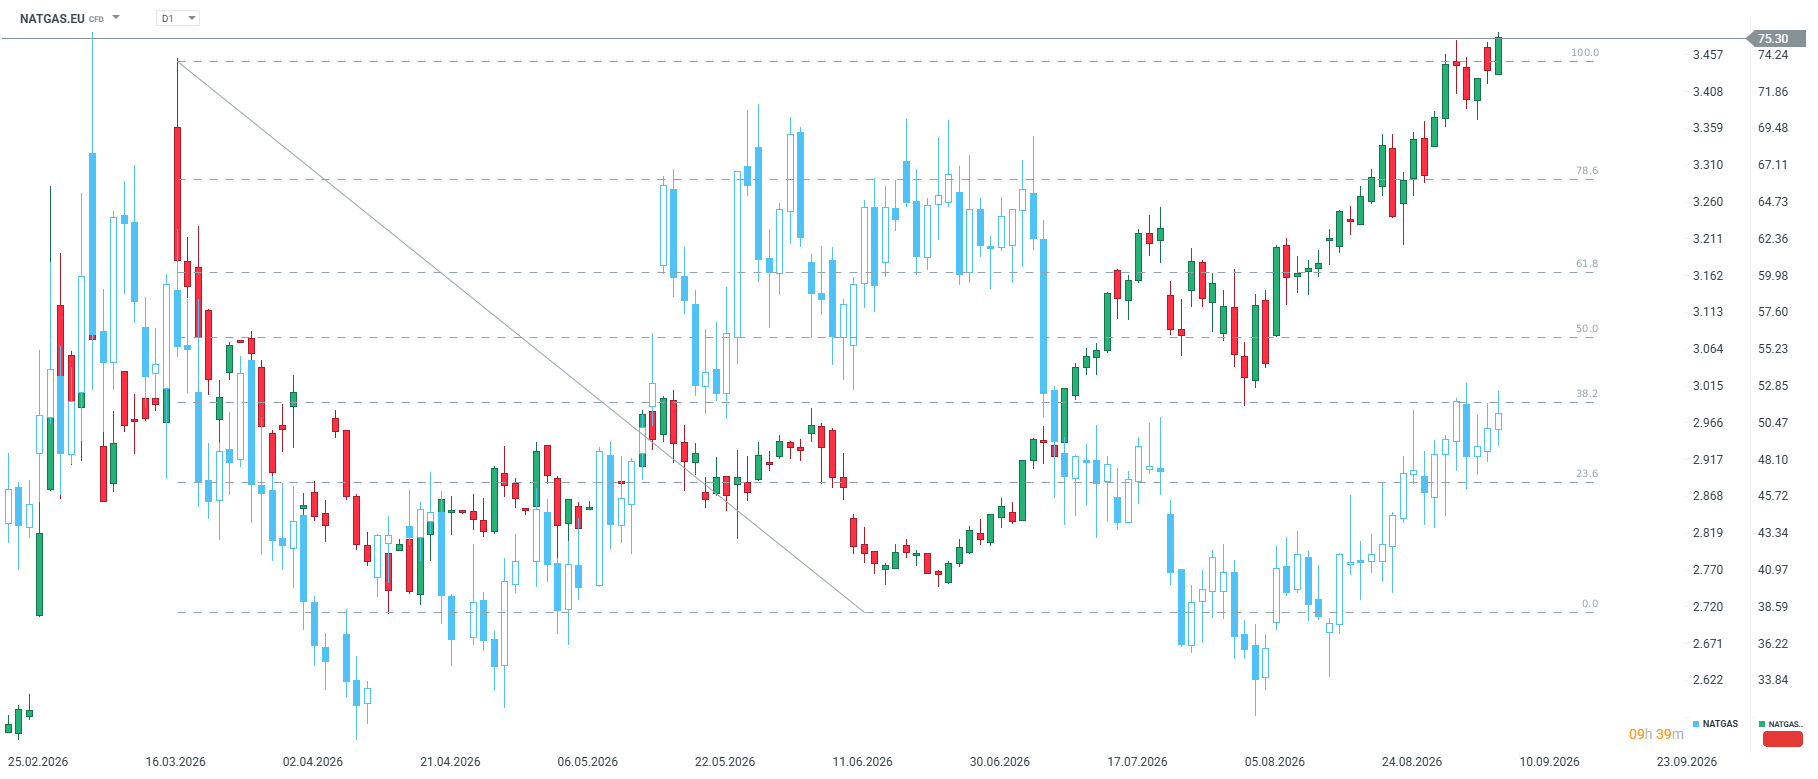
- European natural gas (NATGAS.EU) quotes show strong bullish momentum as of Sept 8, 2026, reaching 75.42—up 2.95% daily and 2.53% weekly. Medium- to long-term gains are substantial: up 22.08% monthly, 161.88% YTD, and 130.08% YoY.
- Technical indicators confirm buyer dominance: RSI has reached overbought levels at 70, while SMA and MACD signals remain strongly bullish, with price sitting 26.10% above its 50-day moving average.
- Nearest key technical resistance sits in the 78.00–80.00 region, while key support is marked by the psychological 70.00 level and the SMA50.
Fundamental and Market Context
- Benchmark month-ahead TTF natural gas contracts rose 2.9% on Monday to €73.31 per MWh, up from €71.20 last Friday.
- European natural gas prices show significantly stronger bullish reactions to recent geopolitical developments compared to other energy commodities.
- LNG outflows from key production regions have been constrained, directly reducing supply to the European market.
- Tight LNG supply leaves European gas markets highly vulnerable to supply shocks ahead of the 2026–2027 heating season.
- Persian Gulf geopolitical tensions and shipping restrictions raise security of supply concerns for gas deliveries to Europe ahead of winter.
- Transit through the critical Strait of Hormuz remains restricted, with vessel traffic at low levels, complicating flexible balancing of European gas demand.
- Investors are closely watching potential Tehran-Oman talks regarding Hormuz management, as any shipping improvements could ease price pressures.
- Seasonality is becoming a key factor as approaching winter forces European buyers to step up purchases to secure storage volumes.
Historical Valuation (Z-score)
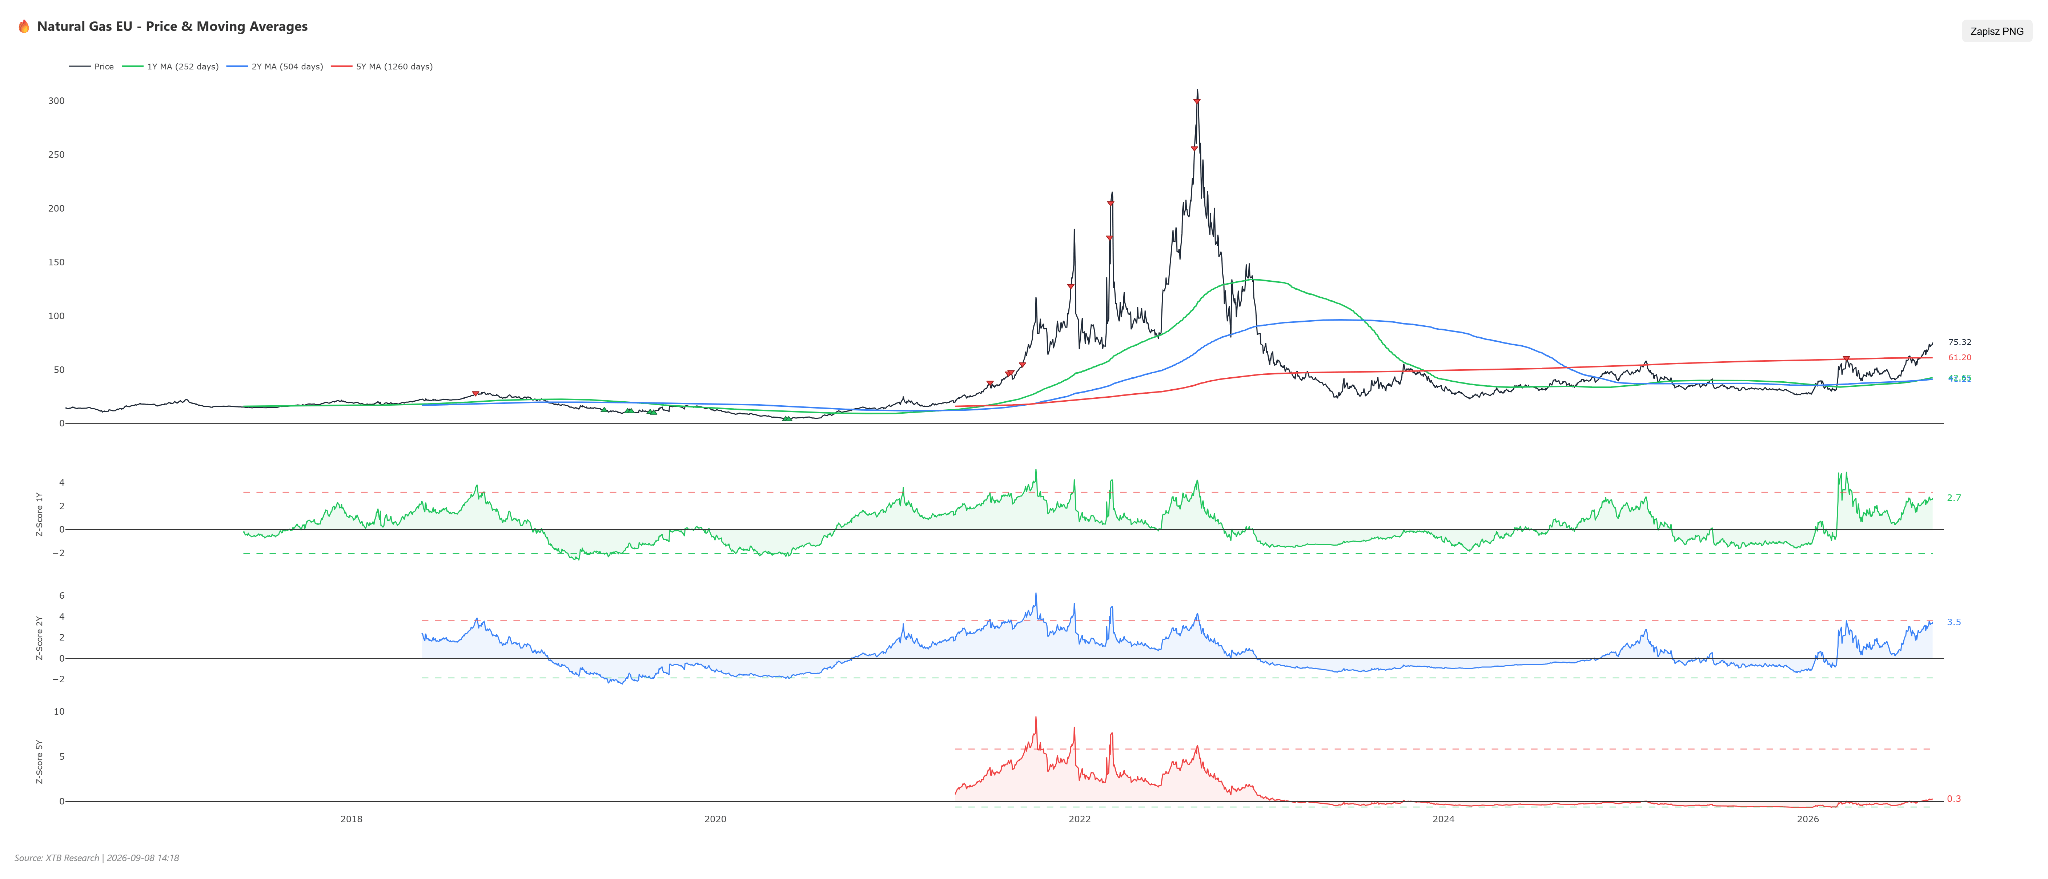
- Z-score historical valuation for European gas points to growing futures market pressure. The 1-year Z-score stands at +2.70, while the 2-year Z-score reaches +3.51, reflecting substantial upward price deviation from historical averages.
- Analyzing the 5-year Z-score shows clear upward momentum over six months: standing at -0.30 six months ago, -0.26 three months ago, -0.15 one month ago, and rising to positive +0.31 currently.
- This transition indicates European natural gas has moved from relative undervaluation to trading above its 5-year average.
- Risk-wise, this suggests a tightening market where upside without corrections may be limited due to high historical deviation, raising profit-taking risk if risk factors ease.
Scenarios
- Bullish scenario: Escalating Middle East tensions paralyzing Hormuz LNG transit could force European buyers to compete aggressively for spot cargoes. Early winter cold snaps accelerating inventory drawdown would amplify this. Technically, RSI holding overbought alongside a breakout above 78.00 could drive prices toward 85.00, or up to 92.00 per MWh in severe deficit conditions.
- Bearish scenario: De-escalation in the Gulf, including an Iran-Oman Hormuz agreement, would restore LNG export flows. A mild, windy autumn in Europe would further reduce heating demand. A breakdown below 70.00 support would signal a correction toward SMA50 (~59.80), with potential to reach 55.00 under sustained calm.