S&P 500 — US Large Cap Index
 FTSE 100 — UK Blue Chips
 Euro Stoxx 50 — Eurozone Leaders
 DAX 40 — German Equities
 CAC 40 — French Market Index
 Nikkei 225 — Japan Benchmark
 Hang Seng — Hong Kong Index
 Shanghai Composite — China Mainland
 ASX 200 — Australian Market
 TSX Composite — Canada Index
 Nifty 50 — India Large Cap
 STI Index — Singapore Market
 KOSPI — South Korea Index
 Bovespa — Brazil Equities
 JSE Top 40 — South Africa Index
 IPC Index — Mexico Market

Looking at Inflation: Will September’s Figures Bring the Fed Closer to Another Rate Hike? Today at 2:30 p.m., we’ll see the September CPI report from the U.S., one of the last key releases ahead of the Fed’s October 27–28 meeting. The consensus forecast calls for a marked acceleration in the core inflation measure to 0.6% MoM (from 0.4% in August) and to around 3.6–3.7% y/y , largely driven by fuel prices, which, according to the EIA, rose by more than 7% in September. However, the core measure (excluding food and energy)—which is more important to the Fed—is expected to slow to 0.2% MoM from 0.3% previously, with the annual rate around 2.5% .
It is precisely this divergence—the hot headline figure versus the cooling core measure—that will be the focus of today’s market reaction. For the Fed, the underlying trend is what matters most. If it does indeed hold steady at 0.2%, this will ease the pressure on the October meeting. The market currently prices in only about a 22% chance of a rate hike this month and will shift its focus to December, which remains the baseline scenario for the next 25-basis-point move. As a reminder, in September the Fed raised rates for the first time in three years, to the 3.75–4.00% range, signaling further tightening. A reading above expectations—especially if the energy shock began to feed through to a broader basket of prices—would quickly reignite hawkish bets and support the dollar.
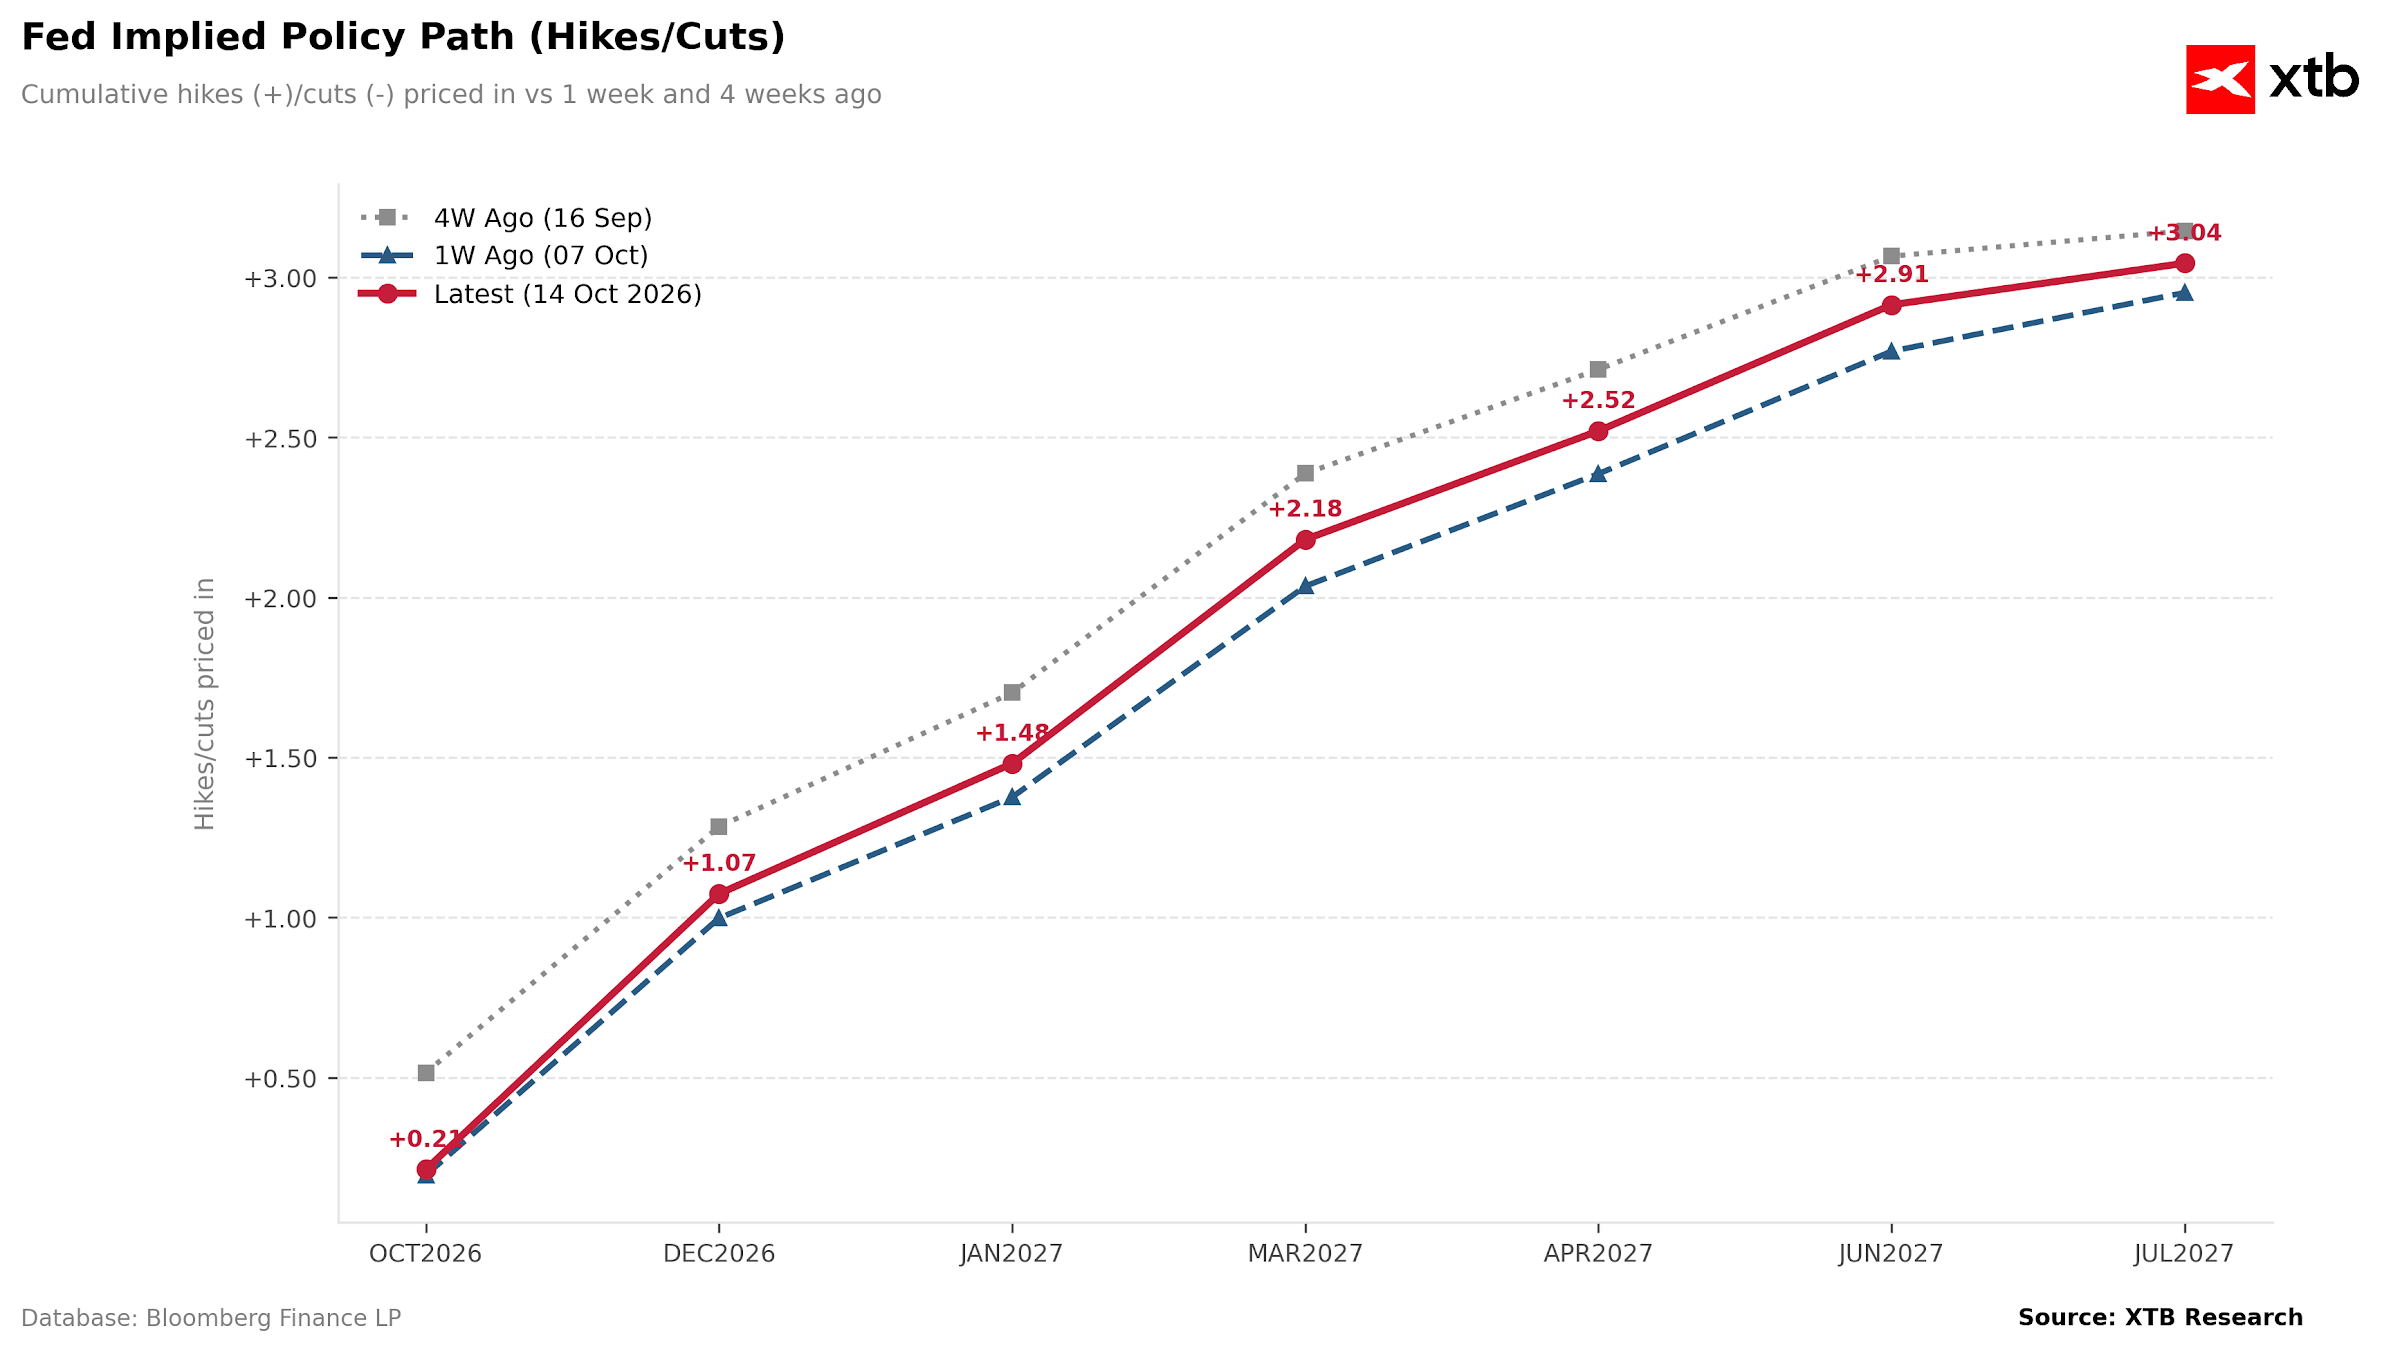
Chart 1 — The Fed’s policy path as priced in by the market.
The chart shows the cumulative number of rate hikes priced in for upcoming meetings — today (red line), a week ago (blue), and four weeks ago (gray). The market has consistently priced in tightening: from about +0.2 rate hikes for October, through +1.07 for December, up to over +3.0 by July 2027. Importantly, the most recent path (red) lies above last week’s path but below last month’s reading—the market has slightly tempered its hawkish expectations following weaker payrolls and cooler PCE data, but the overall trend remains firmly “upward.” Source: XTB
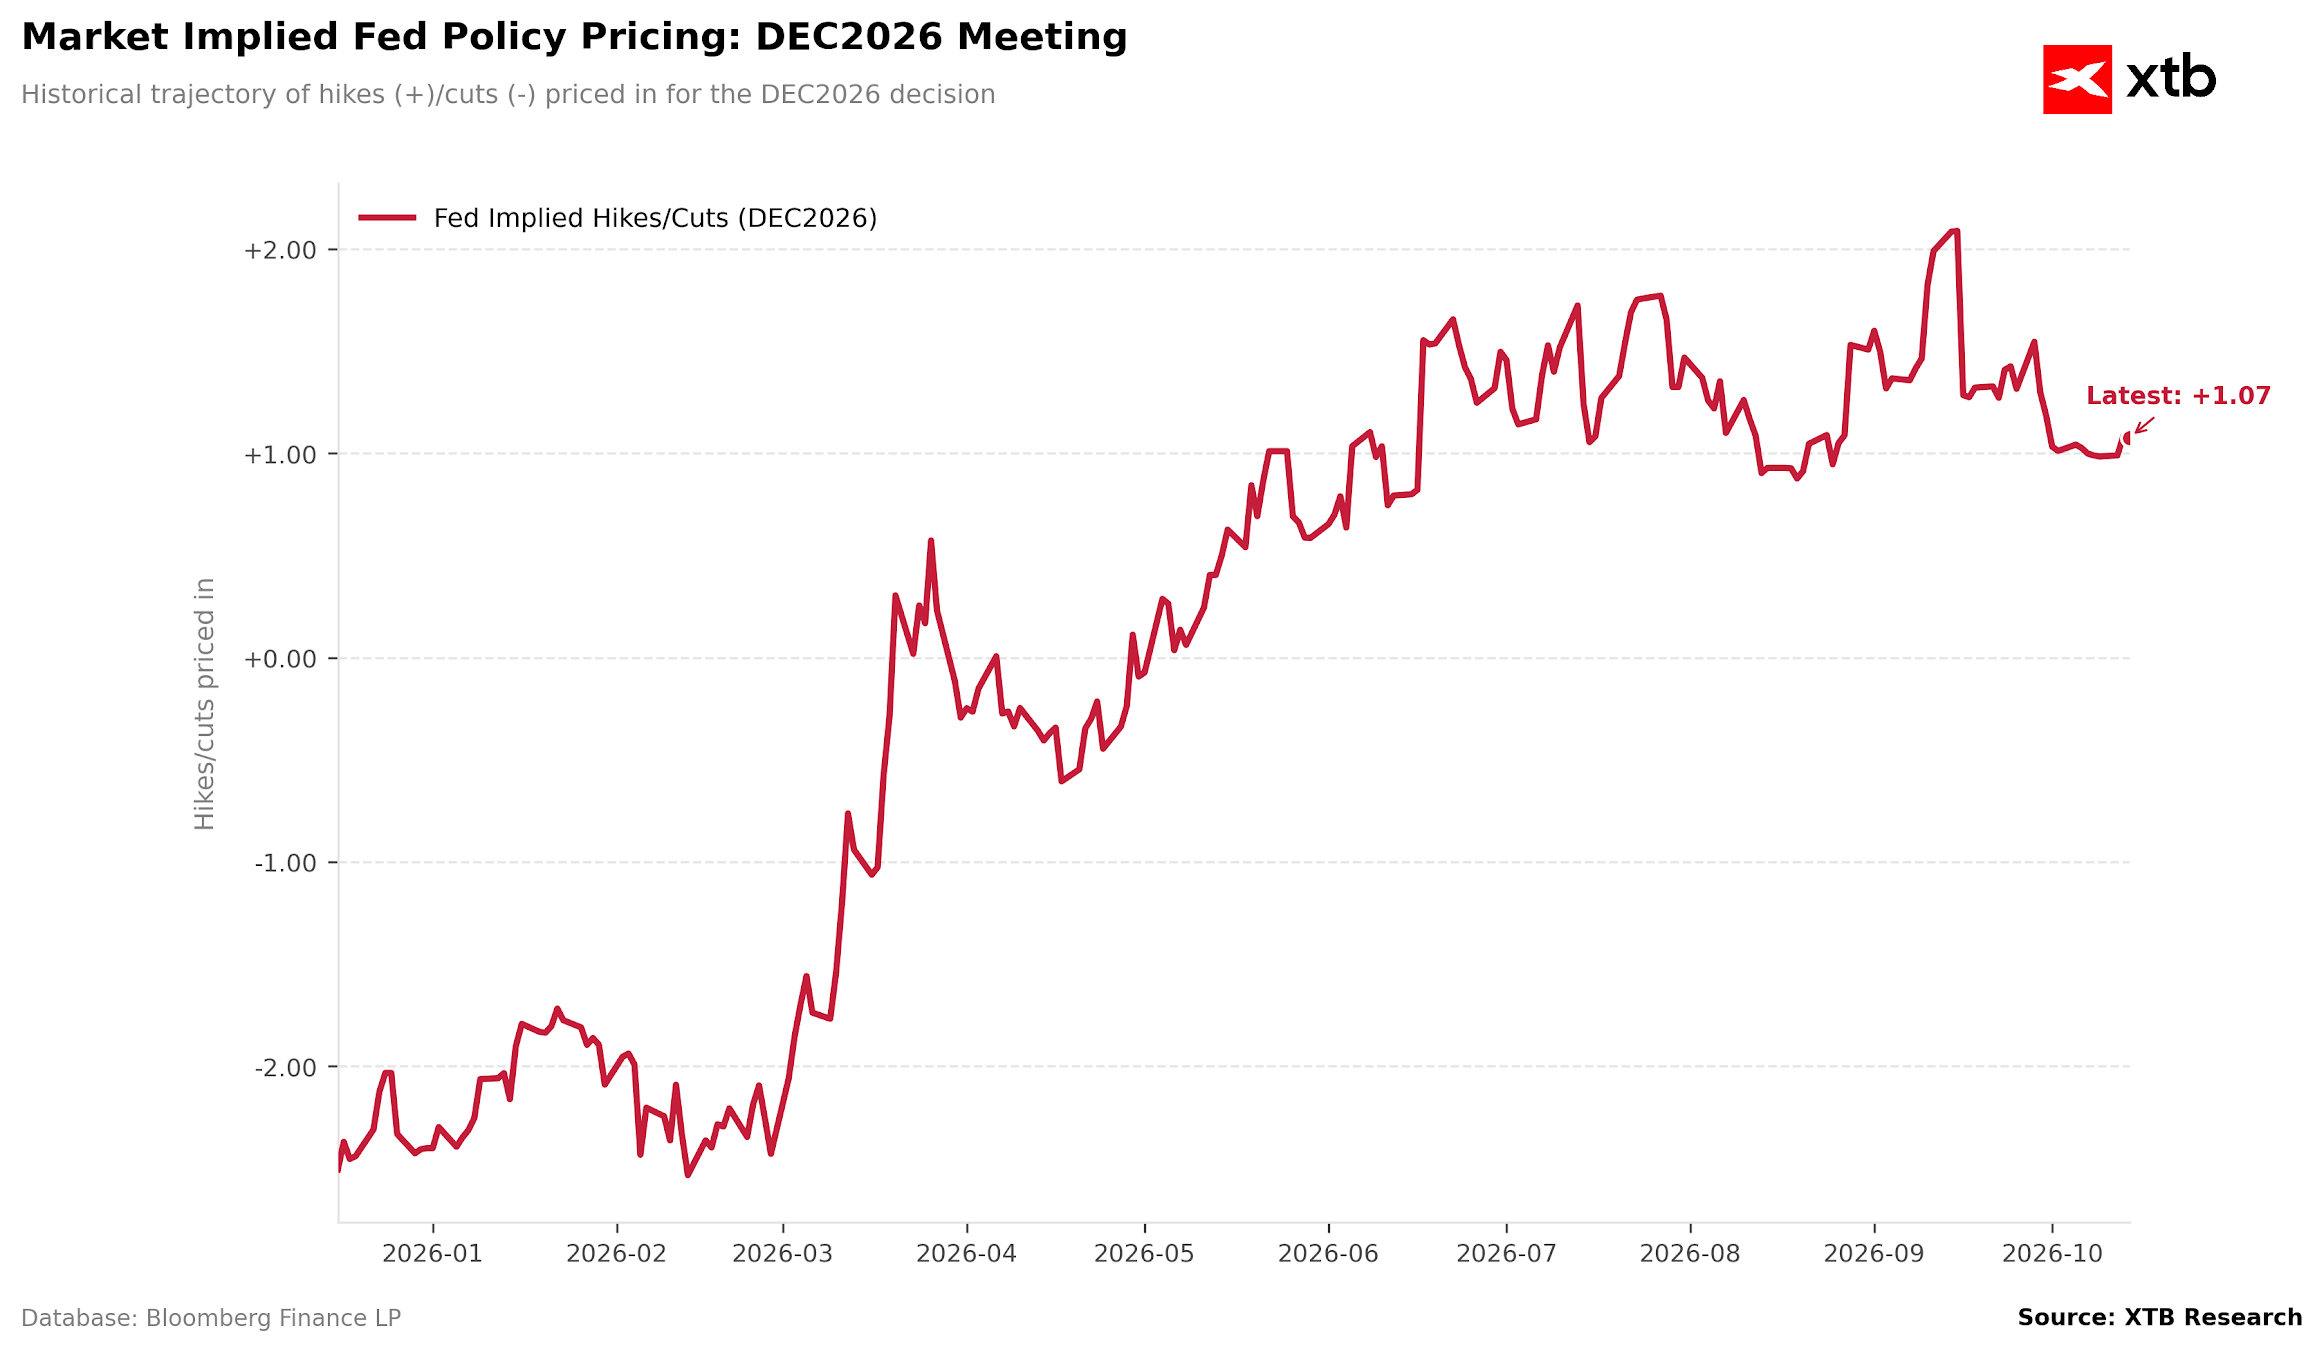
Chart 2 — Pricing History for the December Meeting.
The second chart illustrates how the pricing of the December 2026 decision has changed over the course of the year. As recently as early 2026, the market was pricing in rate cuts (around -2.5), but starting in March, the narrative shifted sharply toward rate hikes, and a spike in inflation following disruptions in oil supplies pushed the market’s pricing into the +1.0 / +2.0. The current reading of +1.07 marks a pullback from September’s highs—the market is hawkish, but not to the extreme, leaving room for movement in either direction following today’s data. Source: XTB
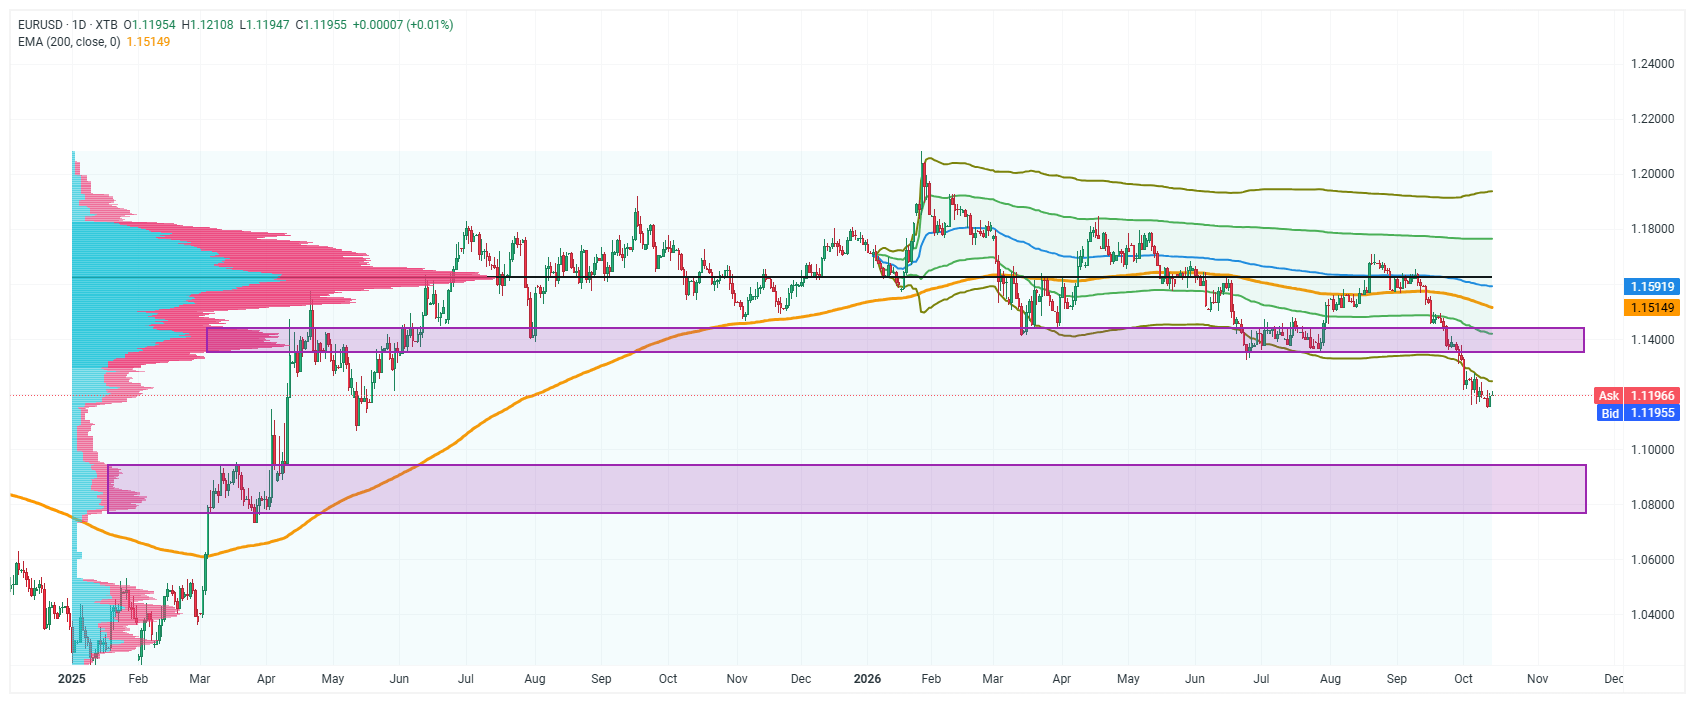
Technical Analysis of EUR/USD.
On the daily chart, the pair is trading around 1.1195 , well below the 200-session exponential moving average (EMA200) at 1.1515 , which underscores the strength of the supply side in the medium term. The price has just fallen below the lower boundary of the broad consolidation zone marked by the purple rectangle (approx. 1.1400–1.1440), which previously served as support and may now begin to act as resistance. The volume profile shows that the largest concentration of trading volume is higher up, in the 1.15–1.16 range, which further hinders a bullish rebound. The nearest significant support is around 1.1150–1.1200, and in the event of a further sell-off, the path opens up to the next demand zone visible much lower, at 1.0800–1.0950. A hot CPI reading, which would strengthen the dollar and fuel hawkish expectations regarding the Fed, could deepen the decline and push the exchange rate toward lower support levels; conversely, a milder core reading would give the euro a chance for a corrective rebound toward 1.1400 and a retest of the recently lost zone from below. Source: XTB