S&P 500 — US Large Cap Index
 FTSE 100 — UK Blue Chips
 Euro Stoxx 50 — Eurozone Leaders
 DAX 40 — German Equities
 CAC 40 — French Market Index
 Nikkei 225 — Japan Benchmark
 Hang Seng — Hong Kong Index
 Shanghai Composite — China Mainland
 ASX 200 — Australian Market
 TSX Composite — Canada Index
 Nifty 50 — India Large Cap
 STI Index — Singapore Market
 KOSPI — South Korea Index
 Bovespa — Brazil Equities
 JSE Top 40 — South Africa Index
 IPC Index — Mexico Market

Facts
- Dow Jones Industrial Average (DJIA) futures are attempting to recover losses after a correction that ended near the 200-day exponential moving average (EMA200, red line on the daily chart).
- On October 13, after rising to 52,600 points, the US30 index pulled back by around 800 points and failed to break out of the descending price channel.
- The Dow Jones Industrial Average closed the October 13 session 0.35% lower and is up 6.8% year-to-date, compared with gains of 13.8% for the S&P 500 and 20.1% for the Nasdaq 100.
- As of October 14, the DJIA trades at higher valuation multiples than the S&P 500 based on price-to-sales, price-to-book, EV/EBIT and EV/EBITDA, while its P/E TTM is almost identical at 25.2 versus 25.5 for the S&P 500.
- Slightly less than half of DJIA constituents are trading above their 50-session moving average, while around 37% are trading below their 200-session moving average.
Recommendation
Short position on US30 at market price
- Stop Loss: 52,700
- Take Profit: 50,950
View
Although the Dow Jones Industrial Average, which includes a relatively large number of “old economy” companies and comparatively limited exposure to the technology sector, could theoretically act as a stabilizer against technology-sector concentration risk, the index has so far remained a clear laggard. Limited earnings and revenue growth among DJIA constituents may translate into weaker capital inflows and lower investor interest at a time when US Treasury yields remain high and have been rising for several weeks. Unlike the technology sector, where strong investor participation is partly supported by expectations of future business expansion, companies in the DJIA tend to be more mature and predictable, leaving them with less of a growth-driven buffer against persistently high bond yields. Yesterday’s sharp sell-off pushed US30 back into its descending price channel and took place on elevated downside volume, further complicating the index’s technical setup. Next week, several additional DJIA constituents are due to report earnings, including Dow Inc., Honeywell, American Express and Verizon — all of which have generally performed relatively weakly over recent months and quarters. We recommend taking a short position on DJIA with a target of 50,950 points , located near an important price-action zone, the 200-day exponential moving average on the daily timeframe and a level that may also be relevant from an options-dealer positioning perspective, namely the negative gamma peak . On the other hand, we recommend placing a stop-loss order at 52,700 points , a level defined by important recent price reactions; a move above it could suggest a return of the upward trend.
US30 chart (H1, D1 intervals)
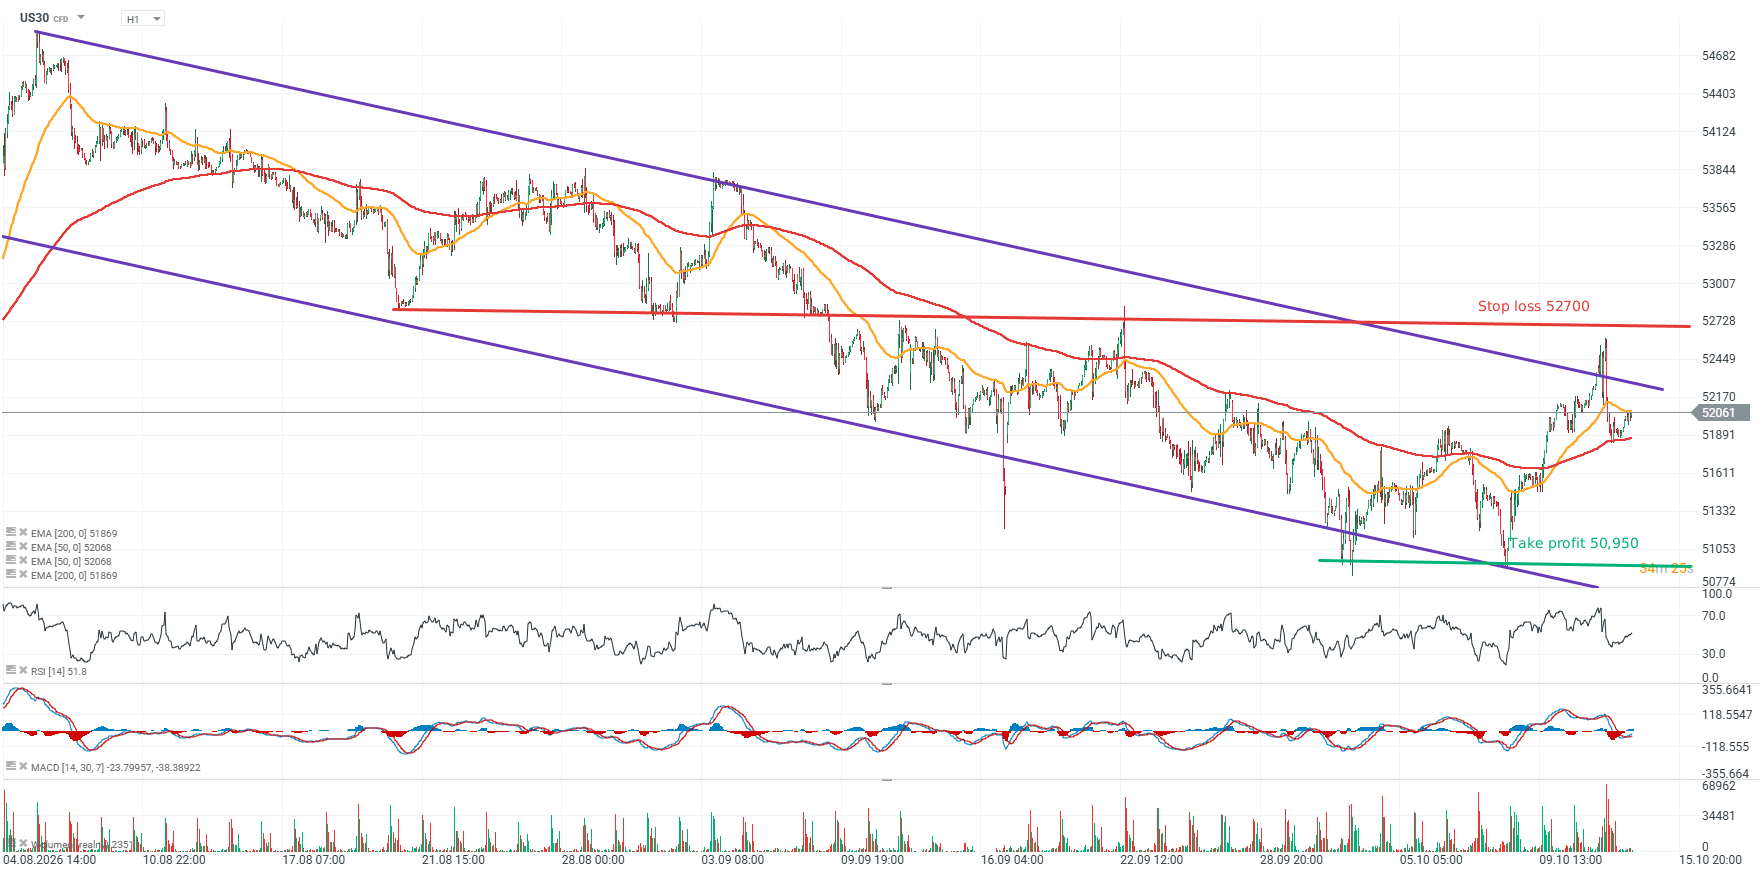
Source: XTB
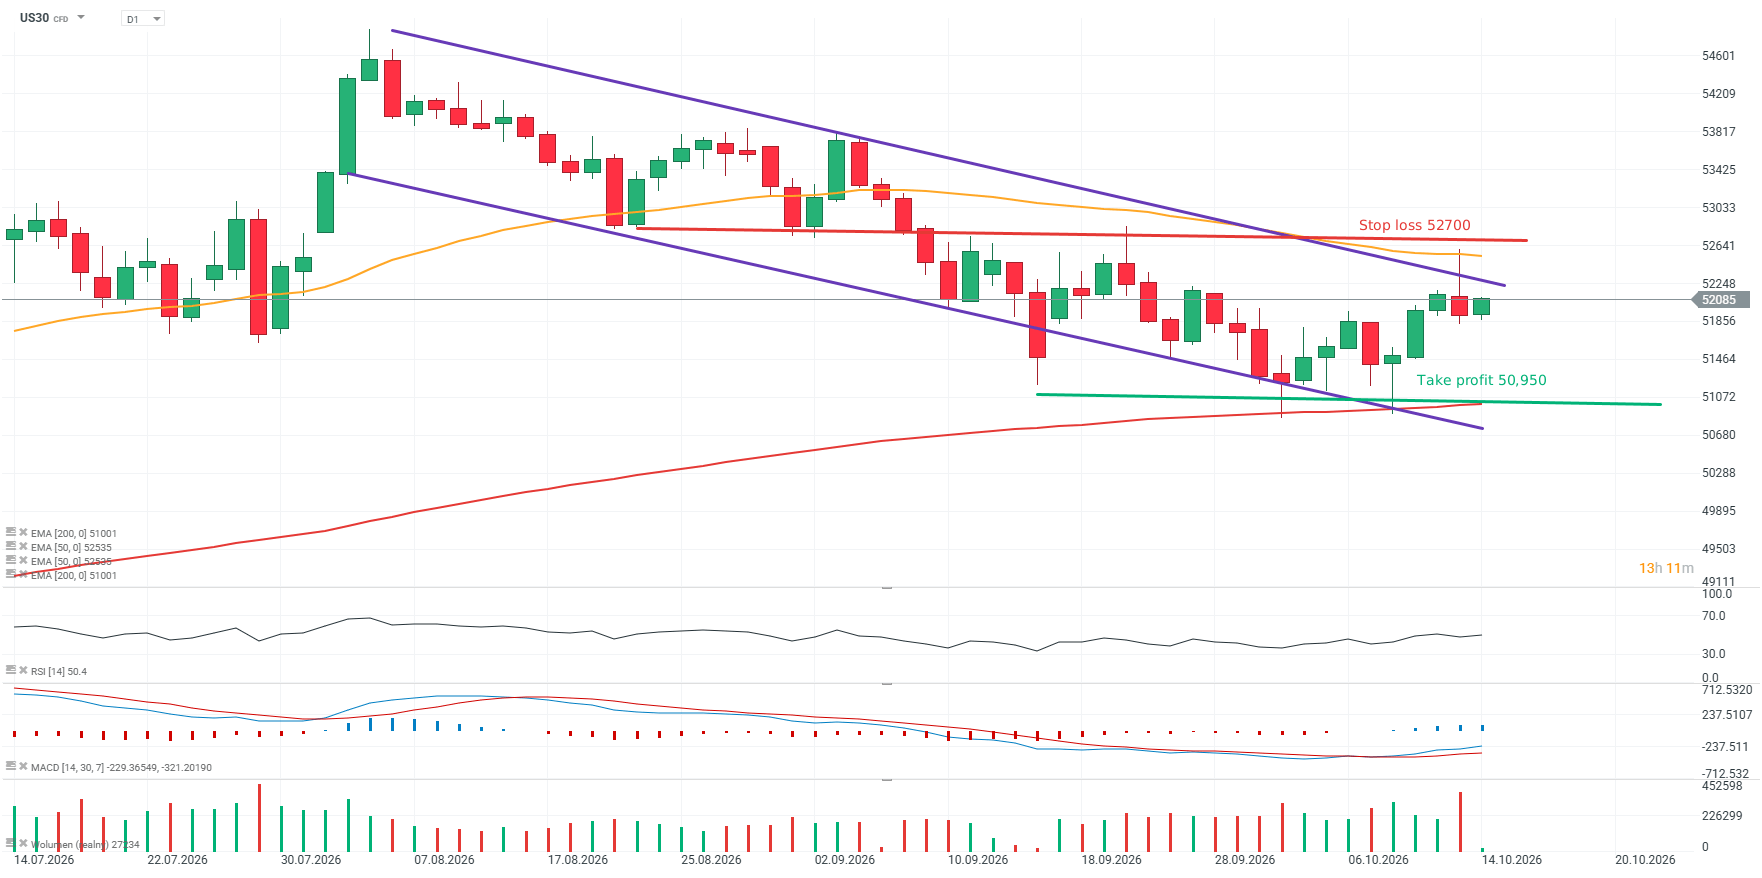
Source: XTB