S&P 500 — US Large Cap Index
 FTSE 100 — UK Blue Chips
 Euro Stoxx 50 — Eurozone Leaders
 DAX 40 — German Equities
 CAC 40 — French Market Index
 Nikkei 225 — Japan Benchmark
 Hang Seng — Hong Kong Index
 Shanghai Composite — China Mainland
 ASX 200 — Australian Market
 TSX Composite — Canada Index
 Nifty 50 — India Large Cap
 STI Index — Singapore Market
 KOSPI — South Korea Index
 Bovespa — Brazil Equities
 JSE Top 40 — South Africa Index
 IPC Index — Mexico Market
- Sterling drops 0.17% as investors flee risk assets amid looming US tariffs and global trade war fears.
- Goldman raises US recession odds to 35% as confidence deteriorates; Q1 set to be the worst since 1980s.
- Stronger-than-expected Chicago PMI lifts USD while lack of UK data leaves GBP vulnerable to risk aversion.
The Pound Sterling (GBP) loses ground versus the US Dollar (USD) as US Liberation Day approaches on Wednesday, when President Donald Trump is expected to announce additional tariffs to the ones already enacted since March 2. At the time of writing, GBP/USD trades at 1.2911, down 0.17%.
GBP/USD falls to 1.2911 as risk sentiment sours, DXY climbs and US recession odds spike on confidence shock
The escalation of the trade war has led investors to ditch riskier assets. Wall Street registers substantial losses on Monday, a reflection of a dismal market mood as US equities are set to finish their worst quarter compared to the rest of the world since the 1980s, revealed Bloomberg.
In the meantime, Goldman Sachs revealed that the chances of a recession in the US increased from 20% to 35% due to a “deterioration in household and business confidence” and comments from Washington hinting they will tolerate a deeper economic slowdown in order to achieve their goals.
Data-wise, the United Kingdom (UK) economic docket is absent, while the Chicago PMI data for March rose by 47.6 points from 45.5 and exceeded forecasts of 45.4. Notably, it is the largest level since November 2023, yet it remains in contractionary territory for the sixteenth consecutive month.
Some of the subcomponents improved, like Production, New Orders, Employment, and Order Backlogs. Supplier Deliveries, Inventories, and Prices Paid dipped, according to the poll.
GBP/USD extended its mild fall as the US Dollar Index (DXY), which tracks the performance of a basket of six currencies, including the Pound versus the Greenback, rose 0.23% to 104.24.
Ahead this week, the UK economic docket will feature Housing Prices and Flash PMIs. In the US, the ISM Manufacturing and Services PMI, along with Nonfarm Payrolls, would dictate the path of the GBP/USD pair.
GBP/USD Price Forecast: Technical outlook
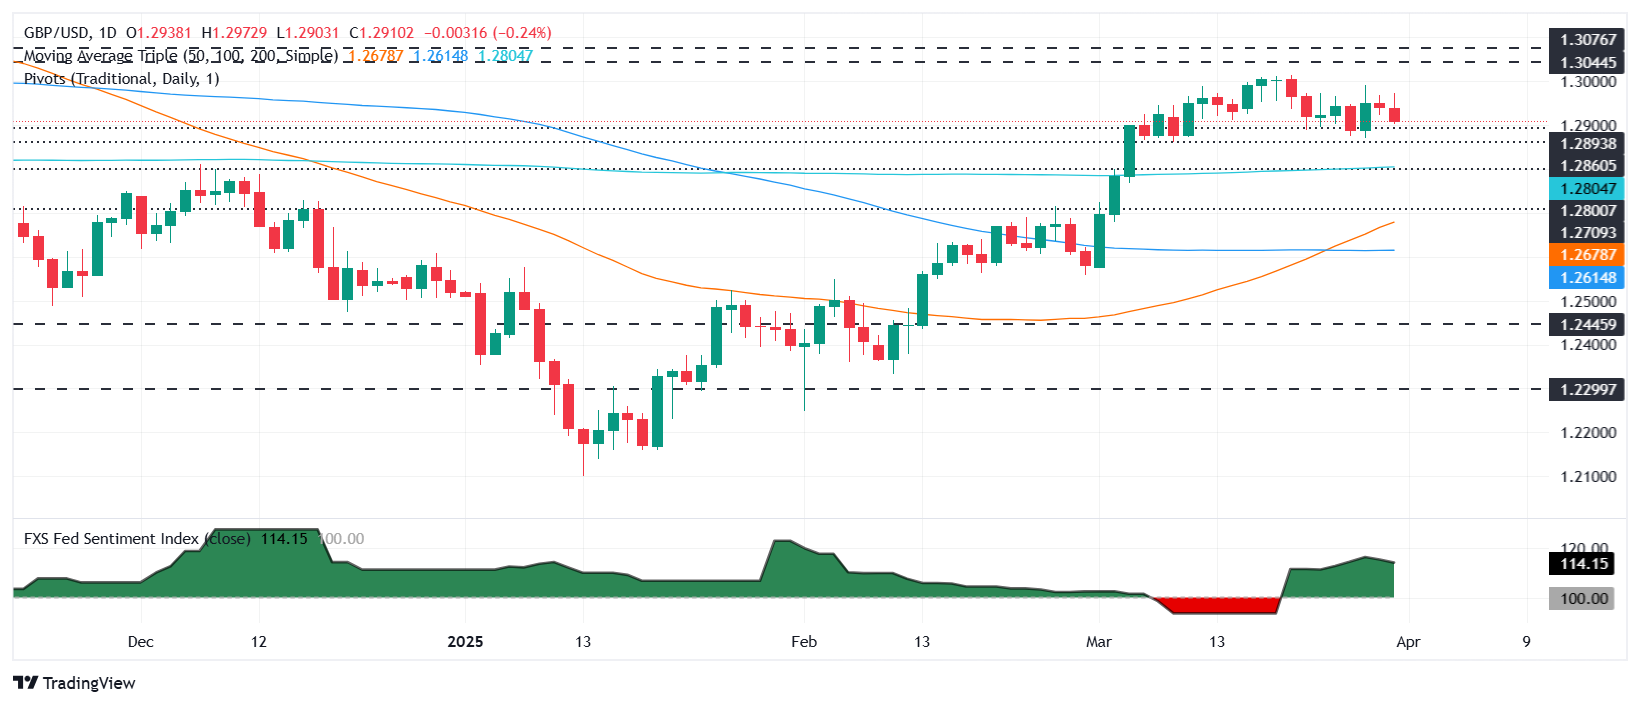
GBP/USD consolidates above 1.2900 with bears capping the advance within the 1.29 – 1.2990 levels for the latest five days, which could pave the way for testing the 200-day Simple Moving Average (SMA) at 1.2803 if sellers clear 1.2900. On the other hand, if buyers regain 1.2950, they could test the 1.3000 mark. Once surpassed, the next stop will be the November 2024 peak at 1.3047.
British Pound PRICE Today
The table below shows the percentage change of British Pound (GBP) against listed major currencies today. British Pound was the strongest against the New Zealand Dollar.
| USD | EUR | GBP | JPY | CAD | AUD | NZD | CHF | |
|---|---|---|---|---|---|---|---|---|
| USD | 0.29% | 0.23% | -0.13% | 0.56% | 0.87% | 0.91% | 0.55% | |
| EUR | -0.29% | 0.04% | -0.39% | 0.32% | 0.66% | 0.66% | 0.31% | |
| GBP | -0.23% | -0.04% | -0.46% | 0.32% | 0.62% | 0.65% | 0.31% | |
| JPY | 0.13% | 0.39% | 0.46% | 0.70% | 1.04% | 1.07% | 0.59% | |
| CAD | -0.56% | -0.32% | -0.32% | -0.70% | 0.34% | 0.35% | -0.01% | |
| AUD | -0.87% | -0.66% | -0.62% | -1.04% | -0.34% | 0.02% | -0.34% | |
| NZD | -0.91% | -0.66% | -0.65% | -1.07% | -0.35% | -0.02% | -0.37% | |
| CHF | -0.55% | -0.31% | -0.31% | -0.59% | 0.01% | 0.34% | 0.37% |
The heat map shows percentage changes of major currencies against each other. The base currency is picked from the left column, while the quote currency is picked from the top row. For example, if you pick the British Pound from the left column and move along the horizontal line to the US Dollar, the percentage change displayed in the box will represent GBP (base)/USD (quote).