S&P 500 — US Large Cap Index
 FTSE 100 — UK Blue Chips
 Euro Stoxx 50 — Eurozone Leaders
 DAX 40 — German Equities
 CAC 40 — French Market Index
 Nikkei 225 — Japan Benchmark
 Hang Seng — Hong Kong Index
 Shanghai Composite — China Mainland
 ASX 200 — Australian Market
 TSX Composite — Canada Index
 Nifty 50 — India Large Cap
 STI Index — Singapore Market
 KOSPI — South Korea Index
 Bovespa — Brazil Equities
 JSE Top 40 — South Africa Index
 IPC Index — Mexico Market
- XRP steadies at $1.19 on Thursday after facing rejection at the upper boundary of the falling channel pattern.
- XLM extends its gains, trading above $0.238 after rallying 25% so far this week.
- Derivatives data signals a mild bearish bias for XRP, while XLM’s improving futures positioning suggests a bullish outlook.
Ripple (XRP) steadies at $1.19 at the time of writing on Thursday, below the upper boundary of its falling channel after facing rejection. Meanwhile, Stellar (XLM) extends its gains, rallying over 25% so far this week. Derivatives metrics suggest a cautious outlook for XRP, while XLM’s improving futures positioning suggests a bullish outlook.
Derivatives data caps XRP while fueling XLM rally
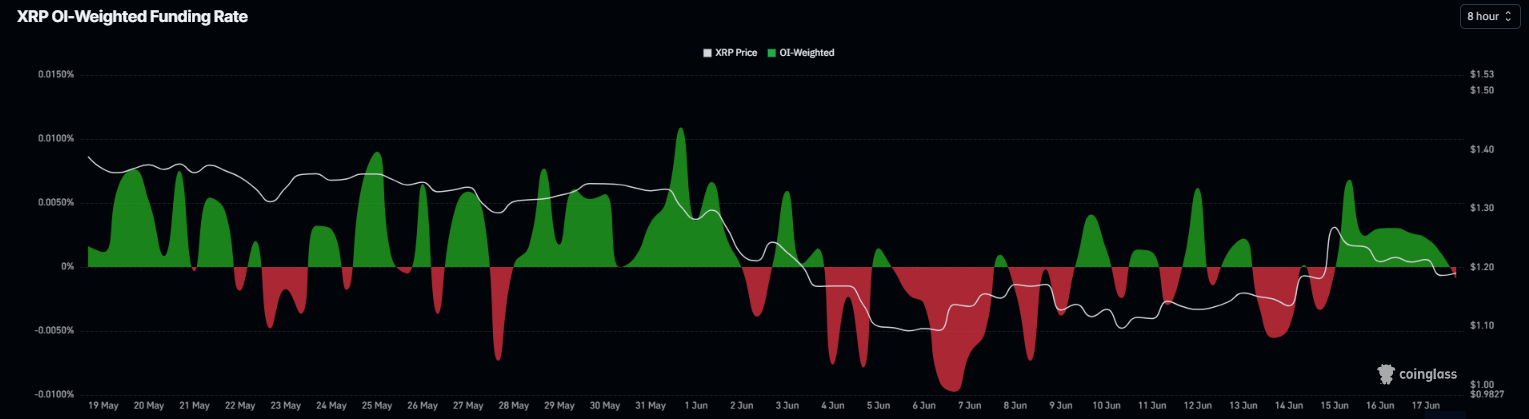
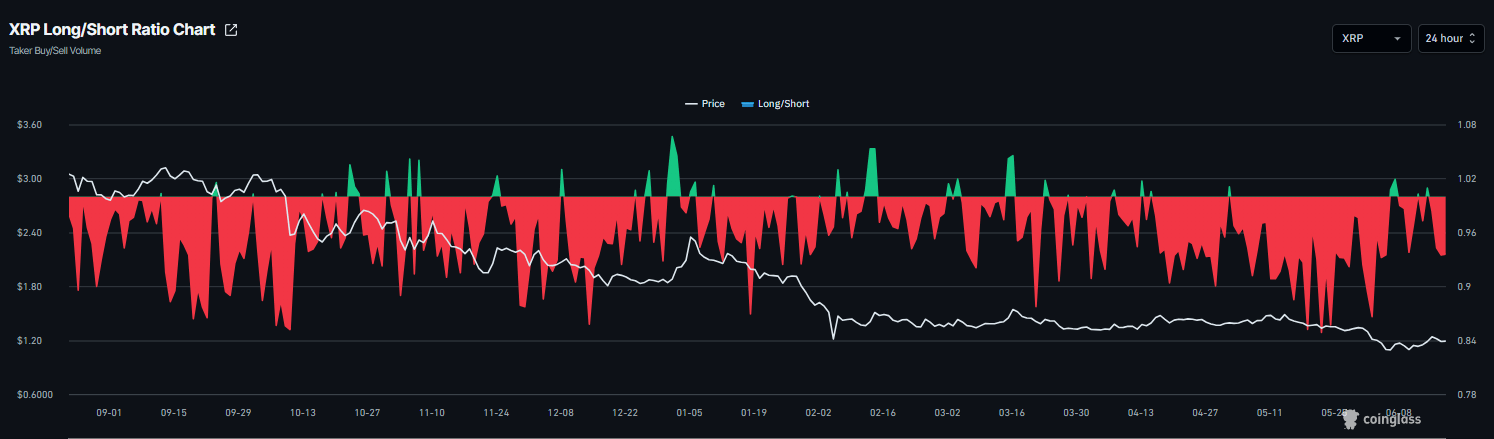
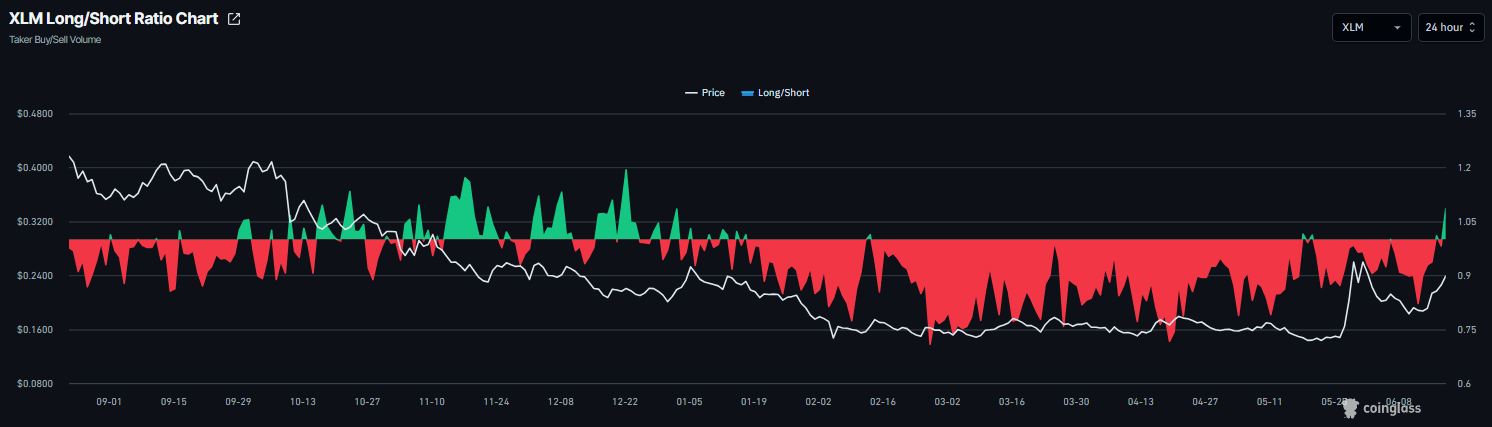
XRP’s derivatives data signals a mild bearish tilt. CoinGlass’ OI-Weighted Funding Rate data for XRP flips to a negative rate, reading -0.0090% on Thursday, indicating shorts are paying longs and suggesting a bearish bias. In addition, the long-to-short ratio reads negative on the same day, further capping XRP.
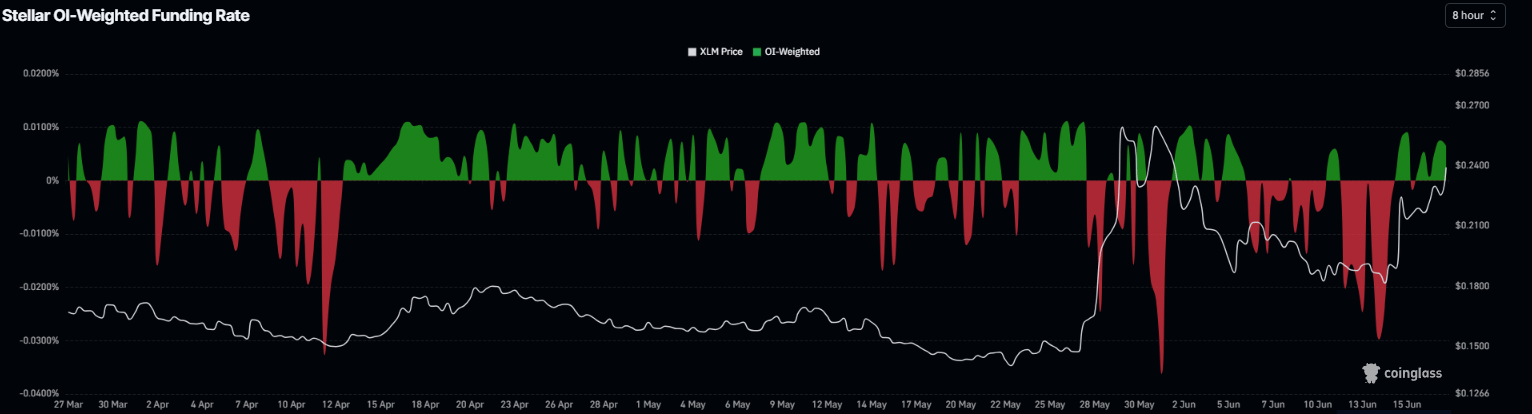
Meanwhile, Stellar’s derivatives metrics support a bullish bias. The funding rates turned positive on Tuesday, reading 0.0065% on Thursday, suggesting a bullish bias. In addition, the long-to-short ratio flipped into positive territory on Thursday, further fueling the bullish outlook.
Some signs of optimism
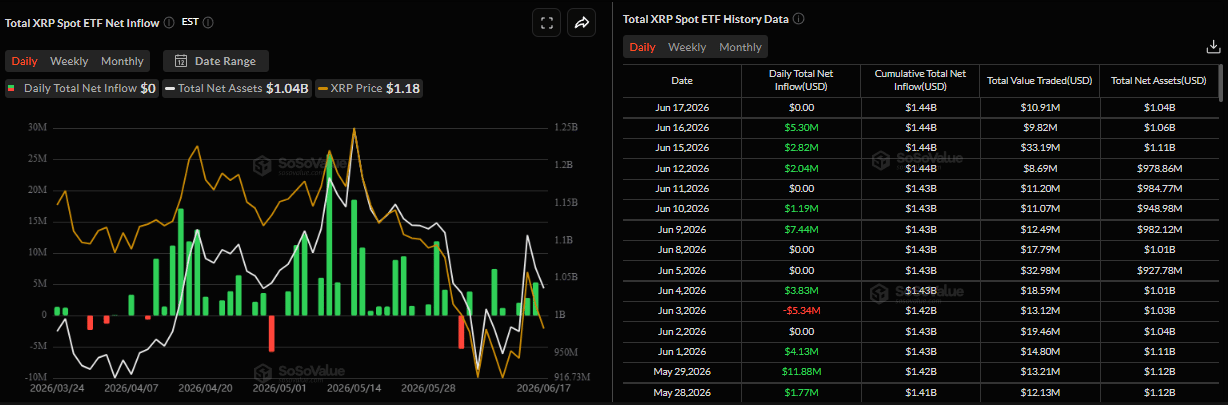
SoSoValue data shows some signs of optimism. Spot Exchange Traded Funds (ETFs) recorded an inflow of $5.30 million on Tuesday after $2.82 million on Monday, marking the third consecutive day of inflow since last week. If this inflow trend continues and intensifies, XRP could see a recovery ahead.
Stellar announced on Tuesday that its users can access tokenized US Treasuries and exposure to AAA-rated Collateralized Loan Obligations (CLOs) through Sushi, expanding the range of real-world asset (RWA) investment opportunities.
Earlier on Monday, Zebec Network launched its enterprise payroll solution on the Stellar blockchain.
“Employees and contractors can receive funds instantly into digital wallets, spend through Zebec’s Mastercard-powered cards, or convert digital dollars into local currency, all on Stellar,” Stellar said on its X post.
These ongoing developments, network expansion and growing institutional adoption have strengthened Stellar’s utility, supporting bullish sentiment and contributing to XLM’s gains this week.
XRP technical outlook: XRP could extend rally if it breaks above resistance zone
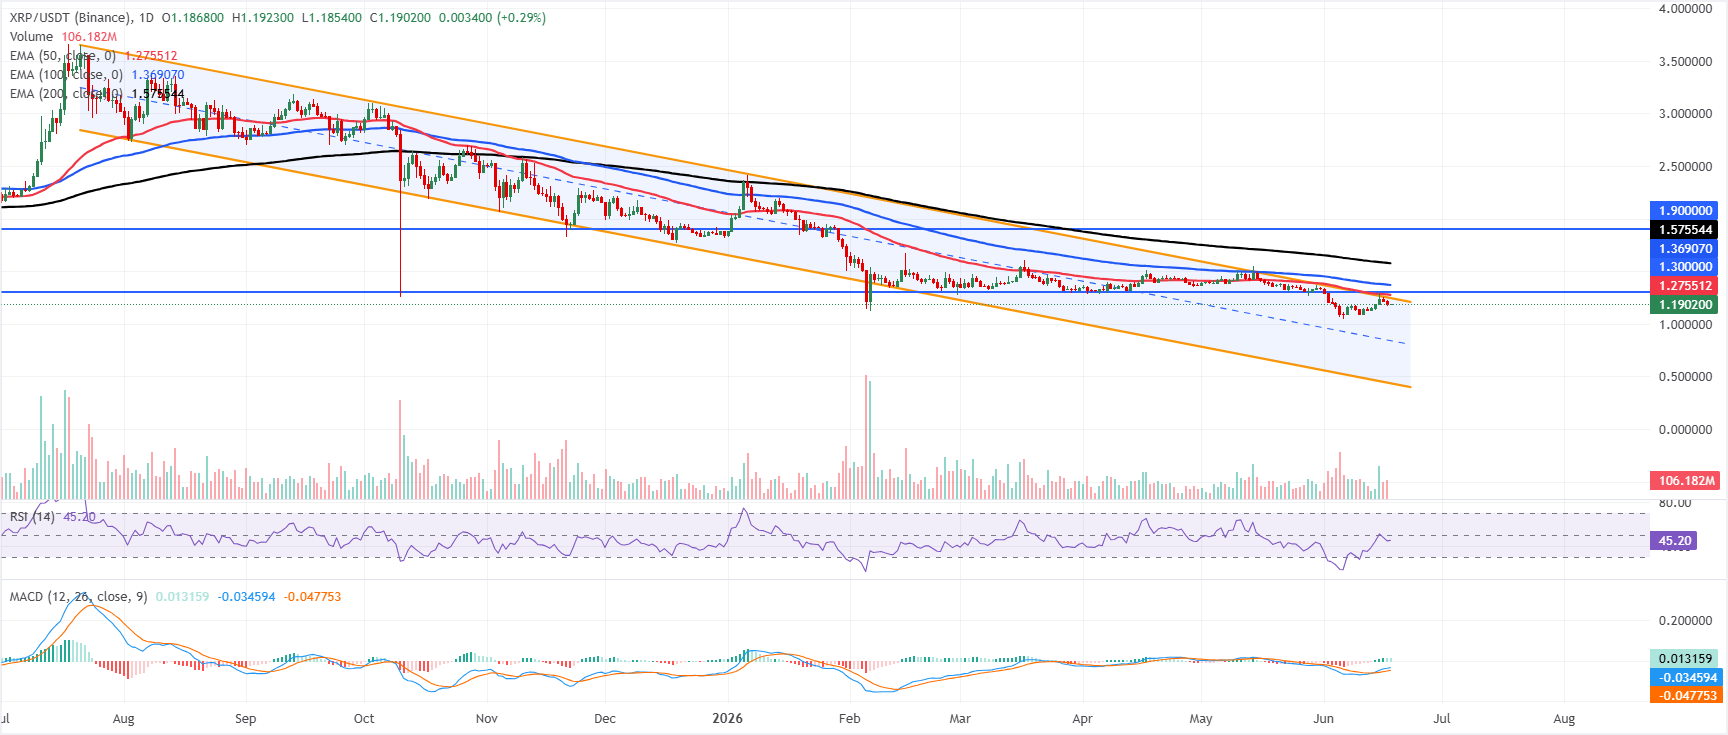
XRP trades at $1.190 on Thursday, maintaining a bearish near-term tone as price holds below the 50-day, 100-day, and 200-day Exponential Moving Averages (EMAs) at roughly $1.280, $1.370, and $1.580, respectively. The recovery from recent lows is underpinned by improving momentum, with the Relative Strength Index (RSI) hovering near 45 and Moving Average Convergence Divergence (MACD) lines advancing in positive territory. Still, these signals only hint at a corrective bounce within a broader downside structure.
On the topside, initial resistance aligns with the downward-trending parallel channel boundary around $1.240, ahead of the horizontal barrier at $1.300 and the 50-day EMA near $1.280, which together form a dense supply zone. Further up, the 100-day EMA around $1.370 and the 200-day EMA near $1.580 cap the broader recovery, while a higher horizontal hurdle sits at $1.900. With no clear nearby support defined below the spot, failure to clear the $1.240–$1.300 band would keep XRP vulnerable to renewed selling pressure.
XLM technical outlook: Bulls in control
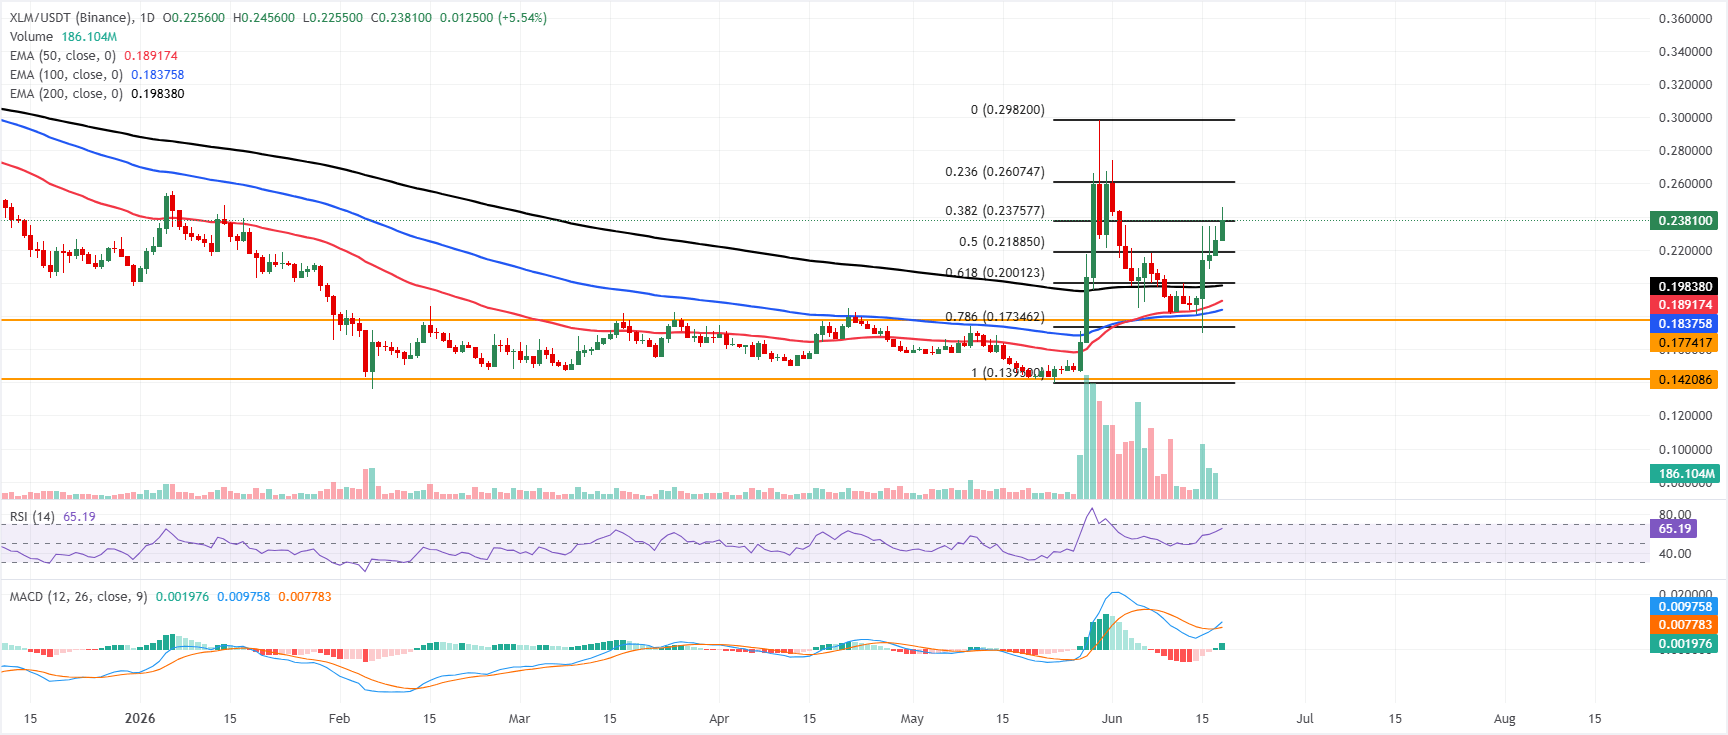
XLM price trades at $0.238 on Thursday, maintaining a bullish near-term bias as it holds above the 50-day, 100-day, and 200-day EMAs, clustered between roughly $0.180 and $0.200. The pair is consolidating just above the 38.2% Fibonacci retracement at $0.237, which serves as an immediate pivot. At the same time, RSI near 65 and a positive MACD histogram suggest persistent, though slightly extended, upside momentum.
On the downside, initial support is aligned at the 38.2% retracement around $0.237, followed by the 50% retracement level at $0.218 and the 61.8% retracement near $0.200, reinforced by the 200-day EMA at $0.198 and the shorter EMAs down toward $0.189–$0.183. If buyers defend this layered demand zone, focus turns to resistance at the 23.6% Fibonacci retracement around $0.260, with a subsequent barrier at the prior swing high anchored near $0.298.