S&P 500 — US Large Cap Index
 FTSE 100 — UK Blue Chips
 Euro Stoxx 50 — Eurozone Leaders
 DAX 40 — German Equities
 CAC 40 — French Market Index
 Nikkei 225 — Japan Benchmark
 Hang Seng — Hong Kong Index
 Shanghai Composite — China Mainland
 ASX 200 — Australian Market
 TSX Composite — Canada Index
 Nifty 50 — India Large Cap
 STI Index — Singapore Market
 KOSPI — South Korea Index
 Bovespa — Brazil Equities
 JSE Top 40 — South Africa Index
 IPC Index — Mexico Market

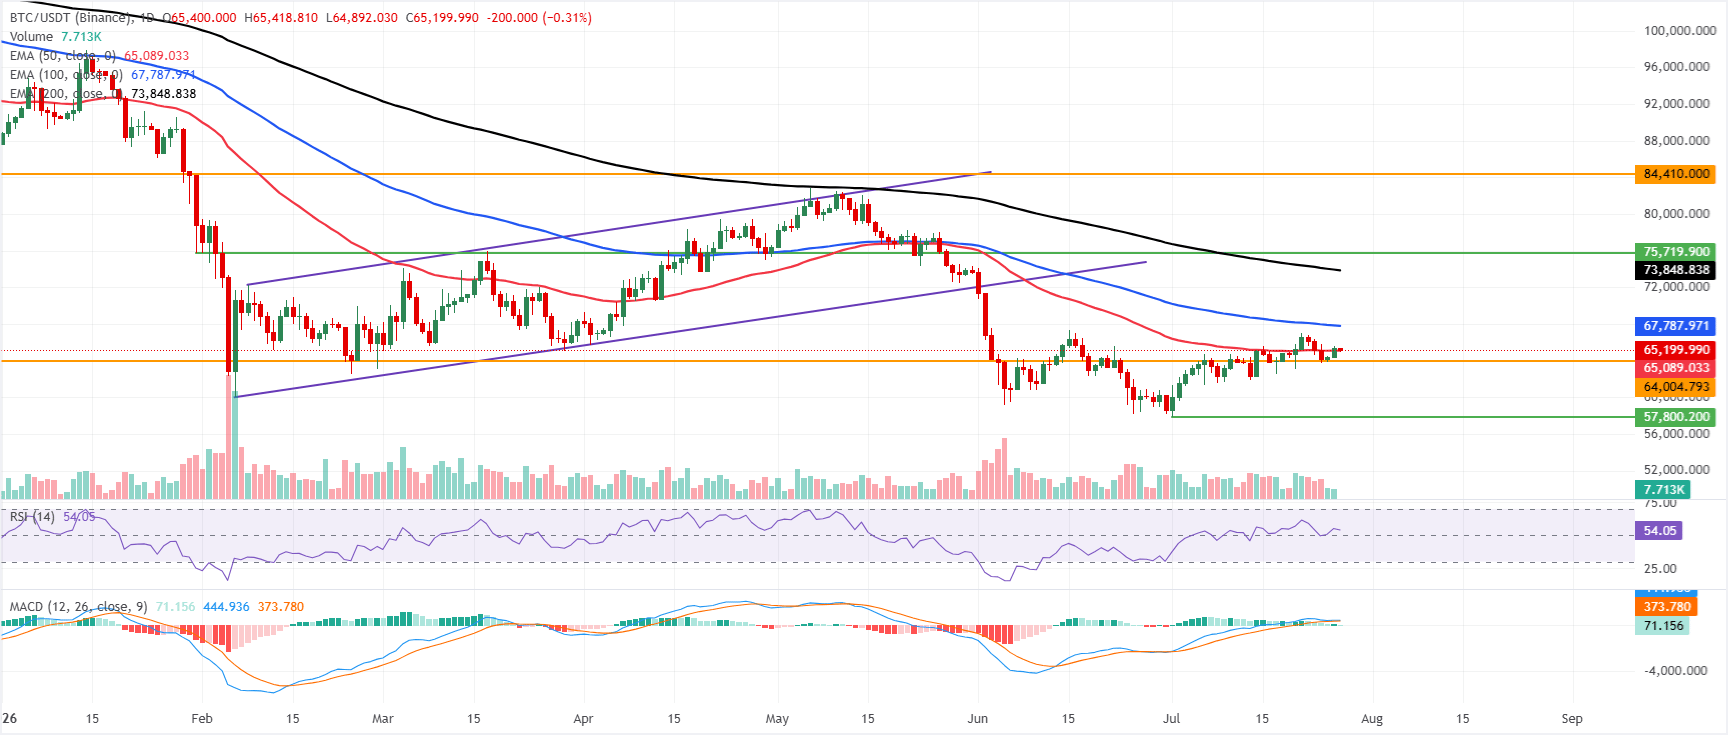
- Bitcoin trades above the 50-day EMA at $65,089 on Monday, printing four consecutive weeks of gains.
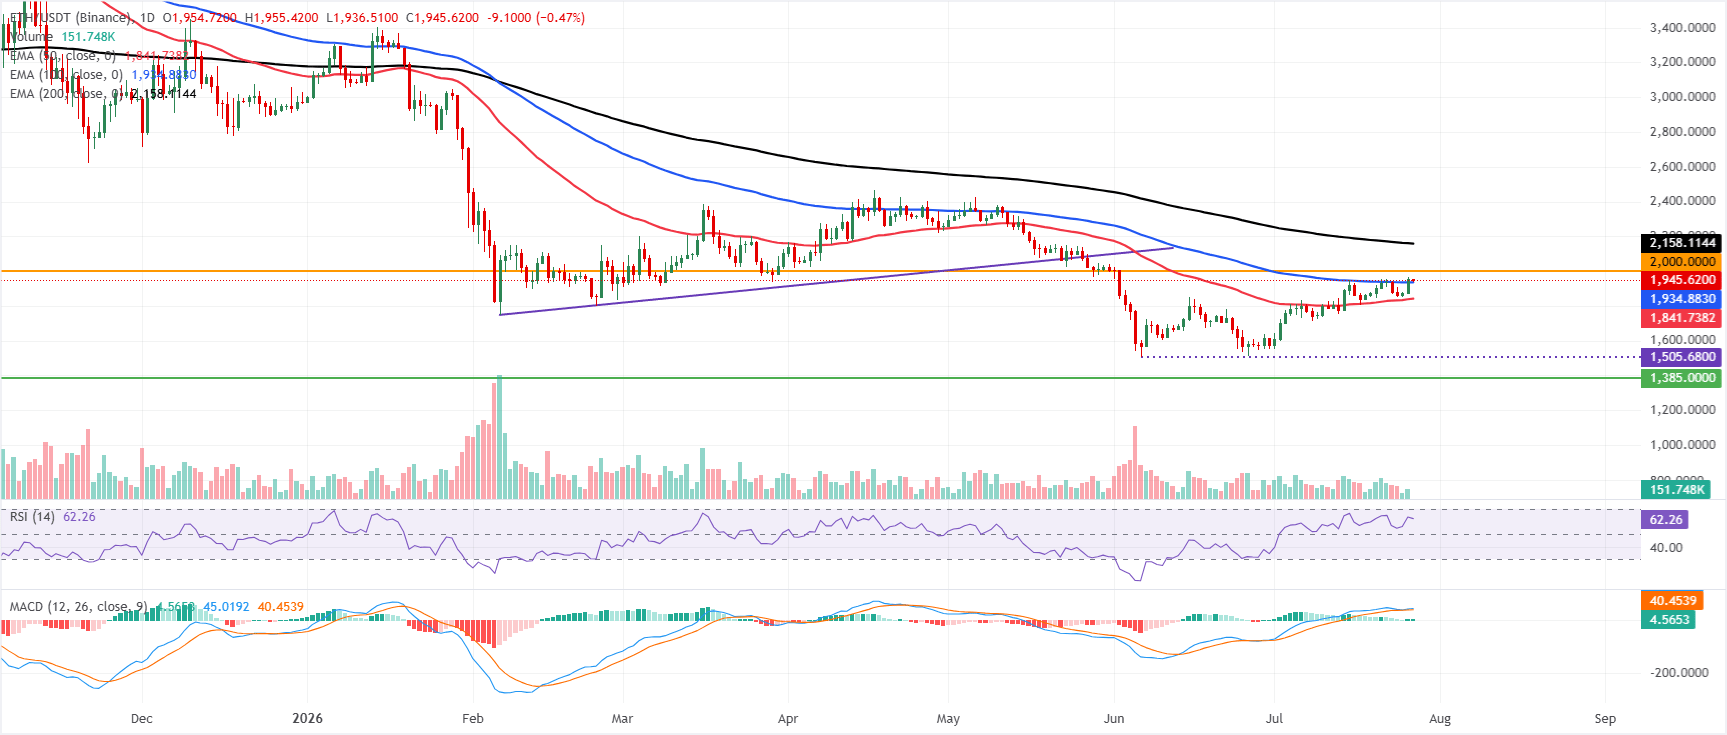
- Ethereum closes above the 100-day EMA at $1,934, signaling a bullish move ahead.
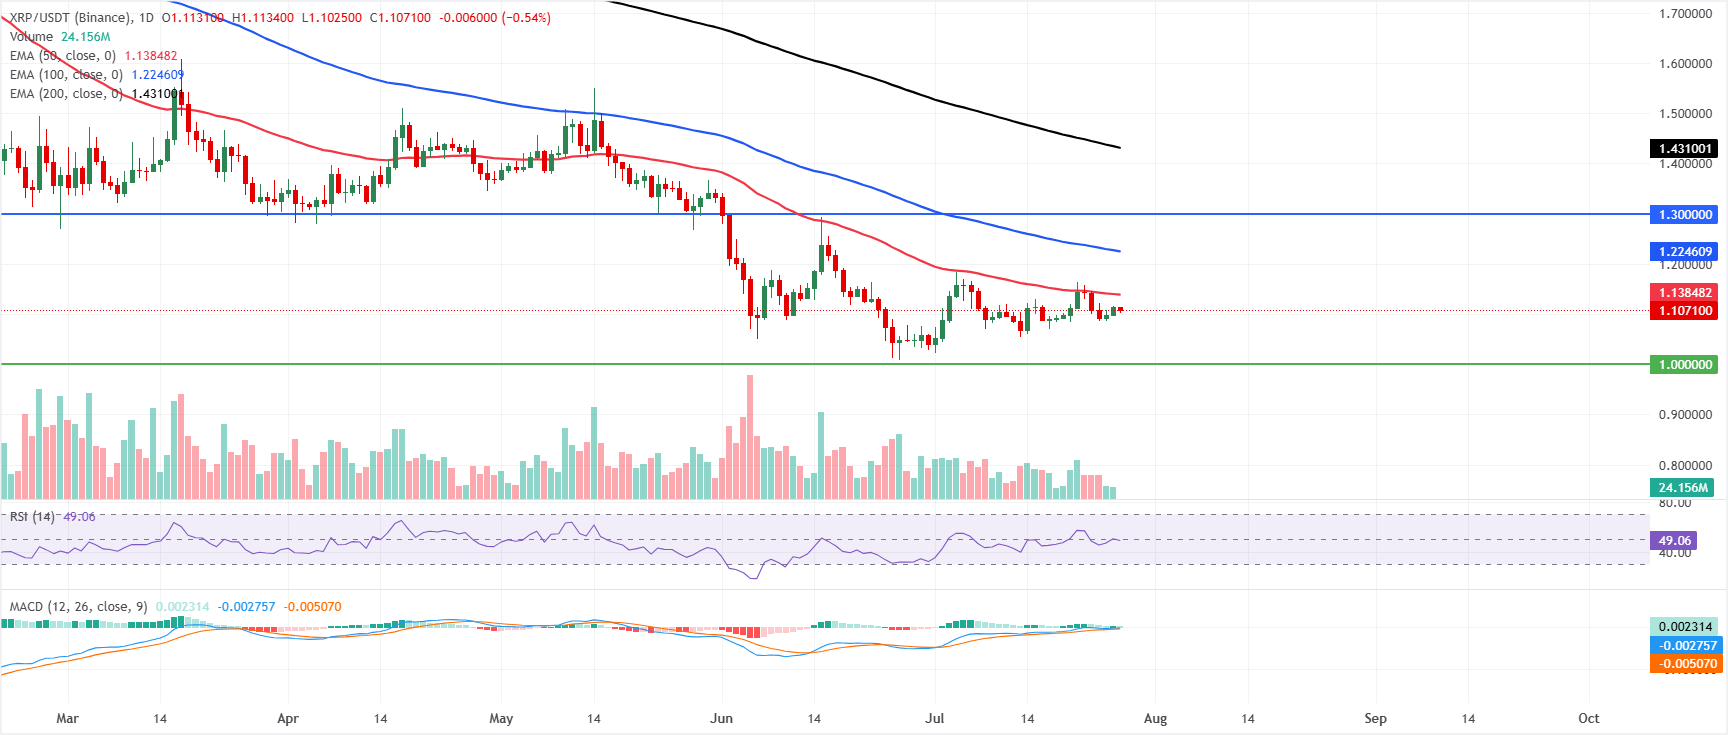
- XRP steadies at $1.10, with momentum indicating mild bullish signs.
Bitcoin (BTC), Ethereum (ETH) and Ripple (XRP) begin the week on a firm footing after surging over 1%, 4% and 1%, respectively, in the previous week. BTC holds above key technical resistance after recording its fourth consecutive weekly gain. ETH has strengthened its bullish outlook by closing above its 100-day Exponential Moving Average (EMA), while XRP stabilizes around $1.10, with momentum indicators suggesting a mild upside bias.
Bitcoin could extend gains as it closes above the 50-day EMA
Bitcoin price trades at $65,199 on Monday, holding a neutral-to-bullish bias as price sits above the 50-day EMA at $65,089 but remains capped by the 100-day EMA at $67,787 and the distant 200-day EMA near $73,848. The reclaim of the short-term EMA hints at an attempt to stabilize after recent volatility, while the Relative Strength Index (RSI) around 54 signals moderate, rather than aggressive, buying pressure as the Moving Average Convergence Divergence (MACD) cools with a still-positive but fading reading, suggesting upside attempts may face headwinds into overhead averages.
On the topside, initial resistance emerges at the 100-day EMA near $67,787, with a subsequent barrier at the 200-day EMA around $73,848 and a major horizontal cap up at $84,410.
On the downside, immediate support is provided by the 50-day EMA at $65,088, ahead of a more important horizontal floor at $64,004; a sustained break back below this band would weaken the current constructive tone and expose a deeper corrective phase.
Ethereum closes above 100-day EMA
Ethereum price trades at $1,945 on Monday after surging over 4% in the previous week. ETH is keeping a bullish near‑term bias as price holds above the 50‑day and 100‑day EMAs at roughly $1,841 and $1,934, respectively. This configuration suggests the recent advance is supported by the medium‑term trend, while the RSI near 62 points to firm but not extreme upside momentum. The MACD indicator remains in positive territory, reinforcing the constructive tone as long as the pair stays above its reclaimed short‑ and medium‑term EMAs.
On the topside, initial resistance emerges at the psychological $2,000 mark, with the 200‑day EMA higher up near $2,158 forming a more significant barrier that would need to be cleared to unlock a stronger bullish extension.
On the downside, immediate support is provided by the 100‑day EMA around $1,934, followed by the 50‑day EMA near $1,841; a break below the latter would suggest a deeper corrective phase toward the broader horizontal floor at $1,385.
XRP steadies below key EMAs
XRP price trades at $1.10 on Monday, maintaining a bearish near-term bias as price holds below the 50-day, 100-day and 200-day EMAs clustered overhead from roughly $1.14 to $1.43.
The structure suggests rallies are being capped by these descending EMAs, even as the RSI hovers near the neutral 50 line at 49 and the MACD remains marginally positive, hinting at only modest recovery attempts within a broader corrective phase.
On the topside, initial resistance is aligned at the 50-day EMA near $1.13, followed by the 100-day EMA at $1.22 and the horizontal barrier at $1.30; above these, the 200-day EMA at $1.43 and the prior horizontal cap at the $1.90 mark are stronger medium-term supply zones.
On the downside, the first notable support sits at the psychological and chart level of $1.00, where buyers may attempt to defend the latest pullback if selling pressure resumes.