- Bitcoin remains under pressure on Friday after losing over 4% so far this week.
- Ethereum holds the $1,700 support, a close below suggests further correction.
- XRP faces rejection from the upper boundary of the parallel downward channel, raising the risk of a deeper fall.
Bitcoin (BTC), Ethereum (ETH), and Ripple (XRP) are trading under pressure on Friday as risk-off continues to weigh on the broader cryptocurrency market. BTC has fallen more than 4% so far this week, and ETH is extending losses, trading around $1,700. Meanwhile, XRP faces rejection at the upper boundary of its parallel downward channel, hinting at further correction.
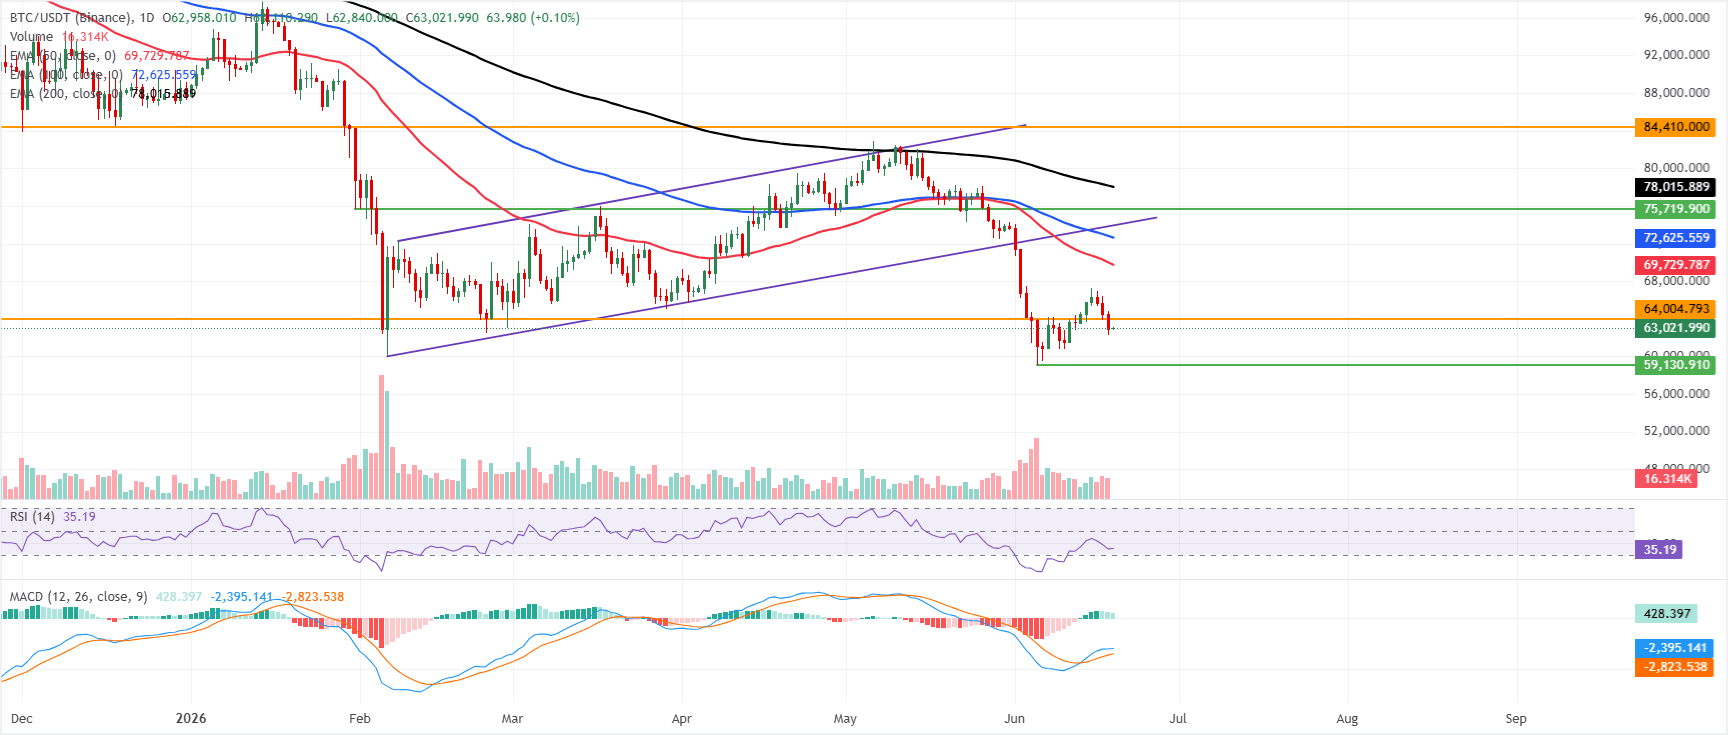
Bitcoin resumes correction
Bitcoin price trades at $63,021 on Friday after losing over 4% so far this week. BTC is extending a corrective phase below all key Exponential Moving Averages (EMAs), which cluster well above the current trading level, reinforcing a bearish near-term bias.
The loss of the former rising support line, now a broken trend floor-turned-resistance around $73,925, underscores a market that remains capped despite the recent rebound. The Relative Strength Index (RSI) on the daily chart is hovering in the mid-30s, hinting at persistent but not yet extreme downside pressure. Meanwhile, the Moving Average Convergence Divergence (MACD) holds above the zero line with a positive reading, suggesting that bearish momentum is moderating rather than accelerating.
On the topside, initial resistance emerges near $64,005, where a horizontal barrier sits just above the current price and guards a stronger recovery toward the 50-day EMA around $69,730. Above that, the 100-day EMA at roughly $72,626 and the broken rising trend line near $73,925 form a dense mid-term cap, ahead of the 200-day EMA close to $78,016 and the major horizontal ceiling at $84,410, which together mark the upper boundary of the broader corrective range; with no nearby structural supports identified below spot in this dataset, any renewed selling would leave Bitcoin vulnerable to discovering fresh demand at lower uncharted levels.
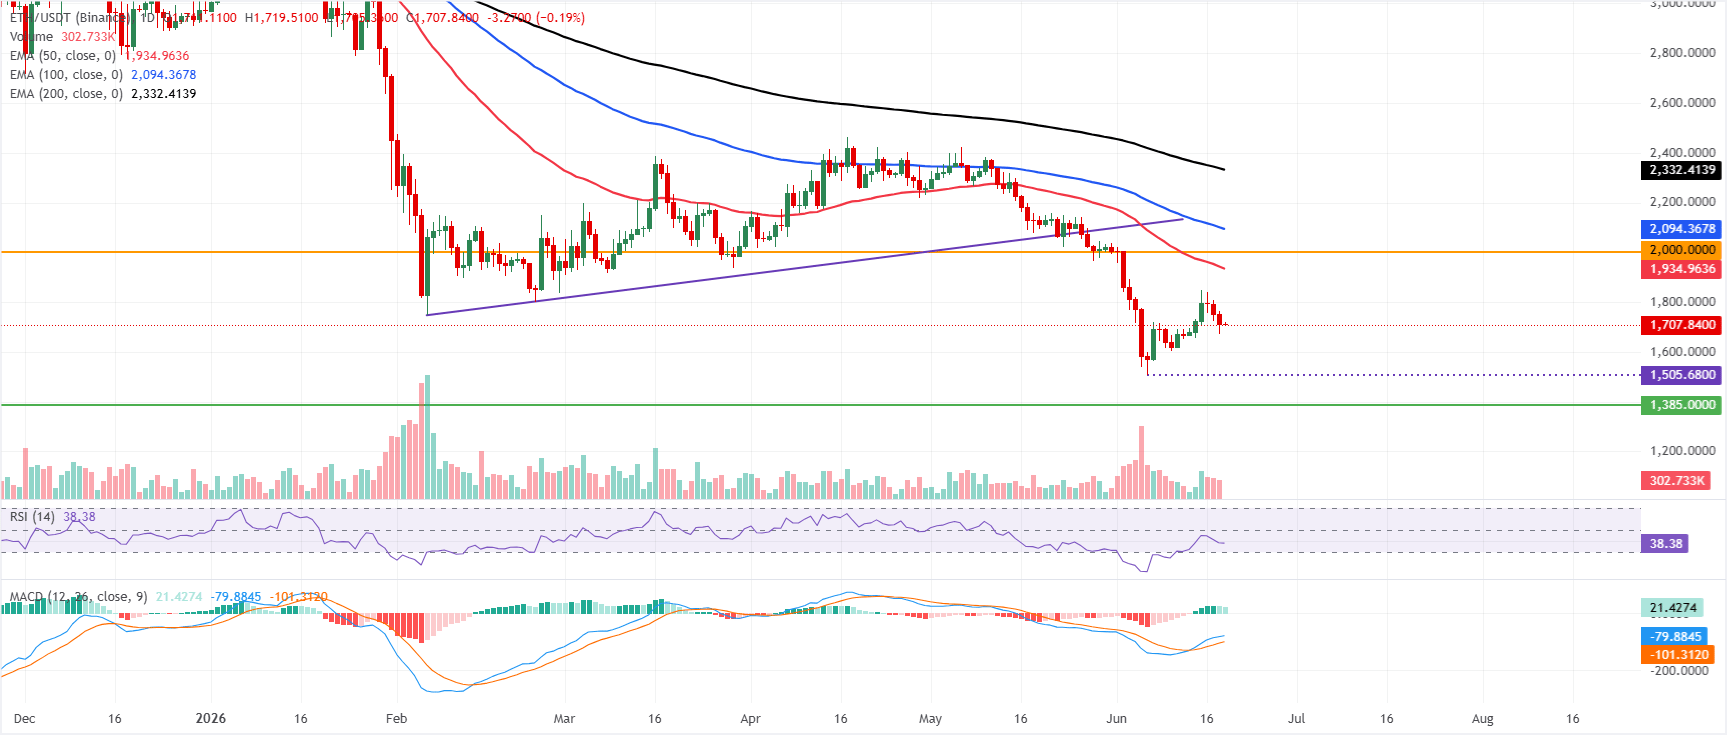
Ethereum extends losses
Ethereum price trades at $1,707 on Friday, maintaining a bearish near-term bias as it remains well below the 50-day, 100-day, and 200-day EMAs, clustered between roughly $1,934 and $2,332. The MACD histogram remains positive, hinting at some residual recovery interest. However, the RSI around 38 stays below the neutral 50 line, suggesting upside attempts are still working against a broader capped structure.
On the topside, initial resistance is seen at the horizontal barrier near $2,000, with the 50-day EMA at $1,934 reinforcing the supply zone above current levels; further gains would then face the 100-day EMA at $2,094 and the 200-day EMA at $2,332.
On the downside, the key structural floor emerges at the prior horizontal support around $1,385, where buyers would be expected to show more decisive interest if the current decline extends.
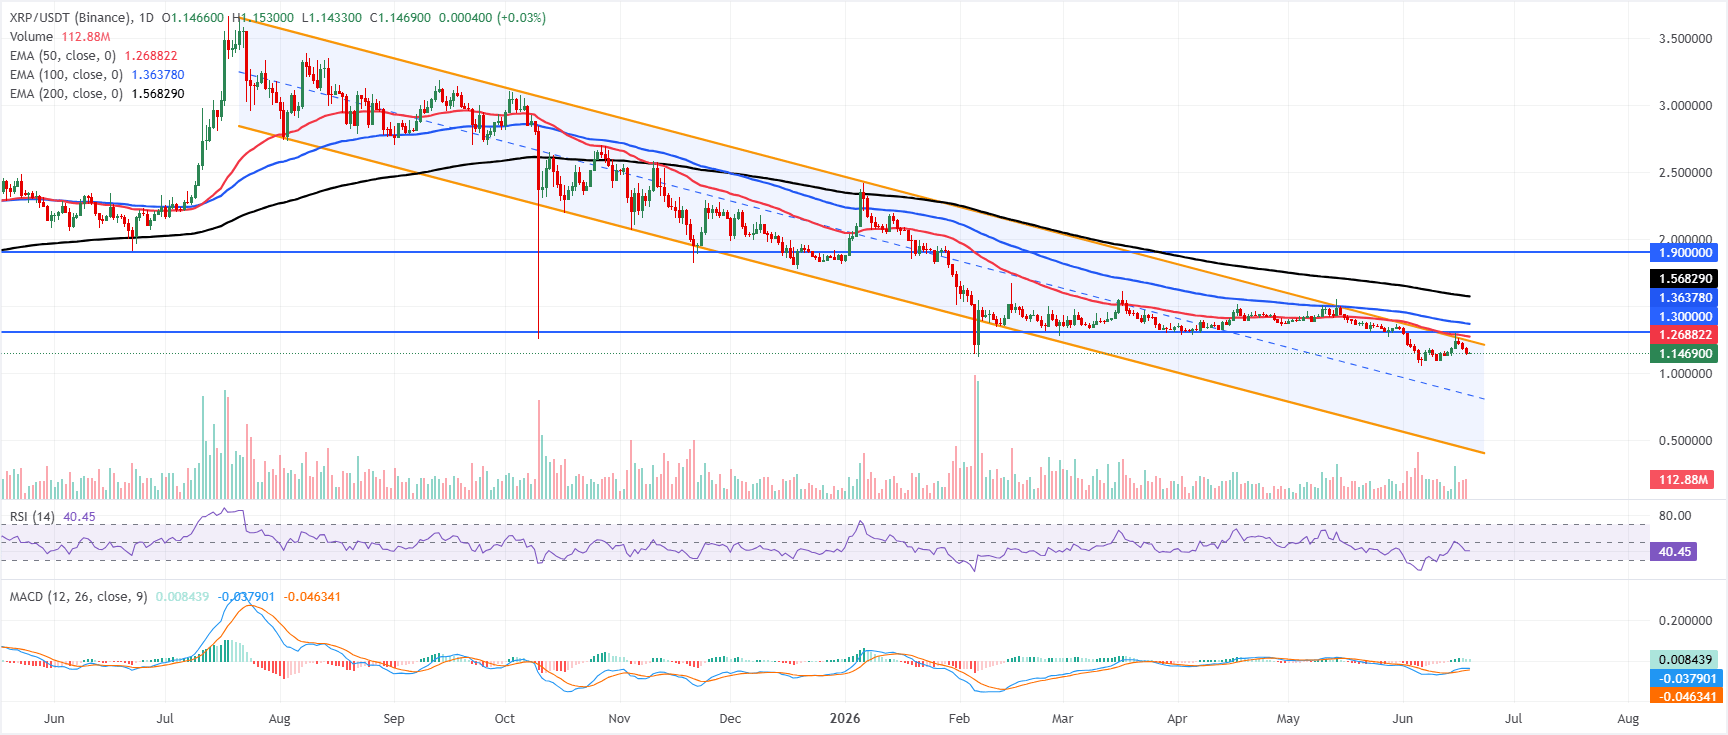
XRP faces rejection from the upper channel boundary
XRP price trades at $1.146 on Friday after being rejected at the upper boundary of the channel pattern earlier this week. In addition, XRP maintains a bearish near-term bias as price remains well below the 50-, 100-, and 200-day EMAs.
Momentum is mixed, with the RSI hovering around 40, hinting at lingering downside pressure, even as the MACD has turned marginally positive, suggesting only a tentative attempt to stabilize rather than a clear bullish reversal.
On the topside, initial resistance is seen at the channel boundary near $1.236, ahead of the 50-day EMA at $1.268, which aligns with a prior congestion area and could act as a first meaningful hurdle if buyers attempt a recovery. Further up, the horizontal barrier at $1.300 precedes the 100-day EMA at $1.363, while the 200-day EMA around $1.568 and the distant $1.900 resistance define the upper band of the broader corrective structure; as long as XRP trades beneath this stacked resistance zone, rallies are likely to be viewed as corrective within an overall bearish framework, with short-term support left to be defined by fresh price action below current levels.