S&P 500 — US Large Cap Index
 FTSE 100 — UK Blue Chips
 Euro Stoxx 50 — Eurozone Leaders
 DAX 40 — German Equities
 CAC 40 — French Market Index
 Nikkei 225 — Japan Benchmark
 Hang Seng — Hong Kong Index
 Shanghai Composite — China Mainland
 ASX 200 — Australian Market
 TSX Composite — Canada Index
 Nifty 50 — India Large Cap
 STI Index — Singapore Market
 KOSPI — South Korea Index
 Bovespa — Brazil Equities
 JSE Top 40 — South Africa Index
 IPC Index — Mexico Market
Geopolitical Noise vs. Hard Data: What is Really Happening in the Oil Market?


The recent correction in oil prices, which at one point reached as much as 8% this week, is driven by a short-term cooling of emotions regarding the Middle East, rather than a lasting solution to the current crisis, which was supposed to be resolved after just a few weeks. The market is reacting to incoming headlines regarding a potential de-escalation of the situation, but ultimately no meaningful change is occurring. In the meantime, however, life goes on and solutions are being implemented that aim not only to continue further trade in the oil market but also to counteract the occurrence of similar situations in the future. Although fundamentals such as demand and supply are key for oil in the long term, in the short term, prices are primarily driven by the aforementioned media headlines. What, then, was significant in the recent price drop?
- Diplomatic opening in Tehran: A meeting between Oman’s Foreign Minister Badr al-Busaidi and his Iranian counterpart Abbas Araghchi raised hopes for the development of a temporary shipping corridor in the Strait of Hormuz (later negative information flowed from Iran regarding the lack of prospects for talks and the turning back of an Indian tanker).
- Milder “Economic D-Day”: The sanctions package announced by US Treasury Secretary Scott Bessent was interpreted by traders as an element of negotiating pressure rather than an ultimate blockade. On the other hand, Iran has huge problems with any oil exports, and Donald Trump talks about further isolating Iran.
- Increase in US crude inventories: The API report showed an increase in US oil inventories of 4.2 million barrels compared to an expected increase of 1.8 million, easing pressure on local markets (this report was negated by a later DOE report, which showed a modest increase in oil inventories and a sharp drop in petroleum product inventories).
- Quiet outflow of oil from the Gulf: Despite the war rhetoric, more and more crude is physically leaving the Persian Gulf via alternative and escorted routes. Despite the official double blockade, within 24 hours at least 7 ships passed through the Strait of Hormuz with transponders on, while probably several times more covered this passage in a hidden way.
Powerful Producer Hedging and the Risk of a Demand Gap in 2027
While the spot market lives on media headlines, a key fundamental shift is taking place at the far end of the forward curve. The boost in contract prices for 2027 to around $80 for Brent and around $75 for WTI has triggered an avalanche of hedging from production companies (i.e., the broad E&P sector):
- Securing Returns on Assets (ROA 7-10%): A price of $80 allows producers in the USA (Permian), Brazil, or West Africa to guarantee a stable return on assets and immediately secure revenues for the entire year. It is often said that oil companies love to drill, and if they can do so with their own money while being hedged, a significant increase in potential production can be expected.
- Increase in Capital Expenditure: Projects originally planned with oil prices at $60–65, which we observed at the turn of 2025 and 2026, can be fully funded at $80 per barrel.
- Potential Growth in Oil Production: The USA, Canada, Brazil, and other countries in the Americas, along with African nations, could increase production by as much as 1 million barrels per day next year thanks to the ability to secure prices at $80 per barrel. The marginal cost of an additional barrel of oil for new projects is typically around $55–60. Even expensive extraction, such as shale or oil sands (drilling in frozen ground), can be profitable at a price of $80 per barrel.
- The Specter of a Lack of Buyers in 2027: If the conflict in the Middle East is eventually resolved, new production will clash with high producer prices locked in through hedging. As a result, the physical market in 2027 could suddenly see a lack of buyers willing to purchase such expensive oil, triggering a deep sell-off.
Evolution of the Brent Curve: March, July, and August 2026
The Brent term structure chart, combined with the refining margin indicator, clearly shows the divergence between the short-term shock and the long-term valuation:
- March 2026 Curve (purple line): showed extreme backwardation, where the spot price was trading near $110. However, from mid-2027, this line consistently falls and anchors exactly in the $70–80 range. This curve fairly well illustrated where the current October contract should be trading.
- July 2026 Curve (blue line): shifted the valuation for the current term clearly upwards due to the continued blocking of the Strait of Hormuz, which also led to a boost in refining margins.
- August 2026 Curve (black line): Started at $88 and gently sloped towards $70–75. It is worth noting that despite the close alignment at the short end between the current curve and the one from March, in the second half of 2027, we observe a clear downward shift in the chart. This results not only from the lower current spot price but also from increased hedging by producers.
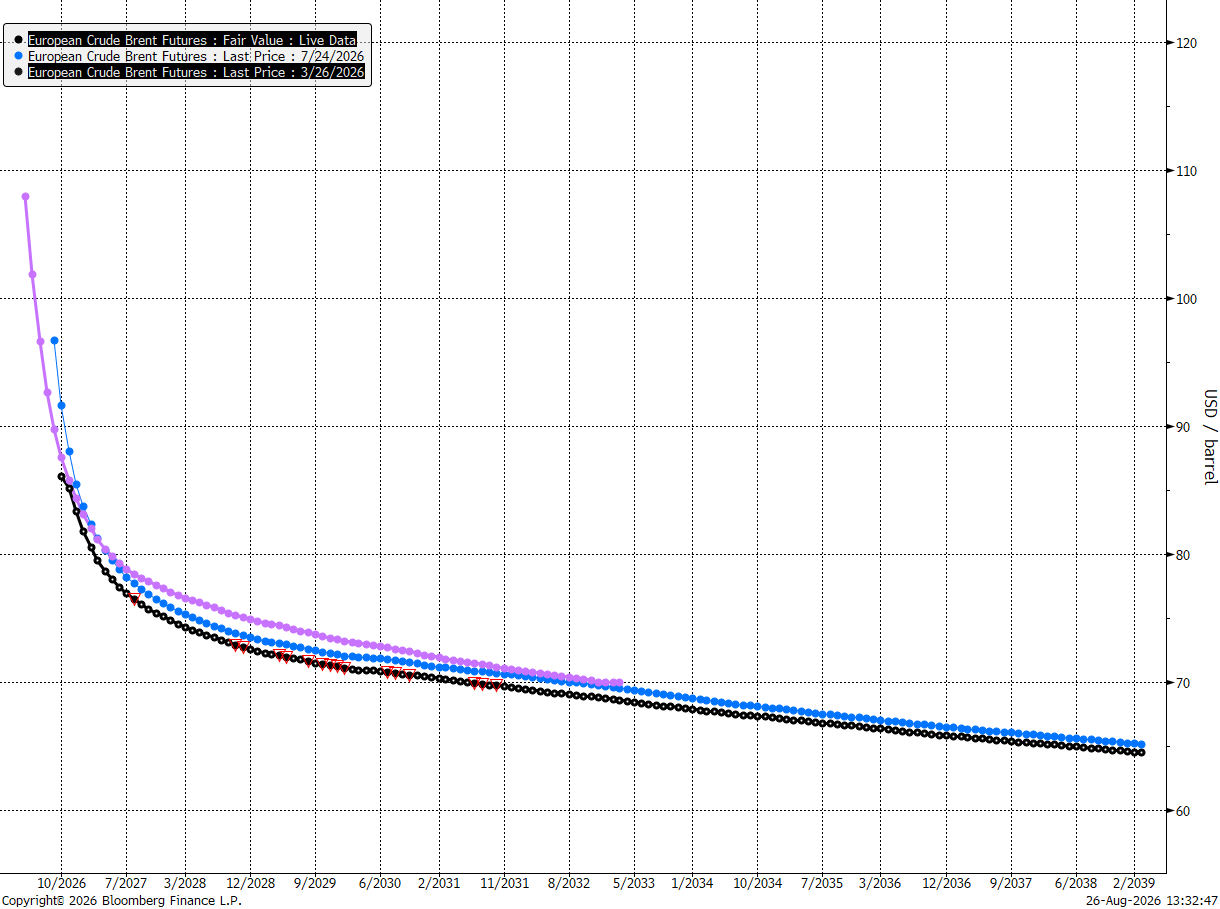
Forward curve in March, July, and August. Source: Bloomberg Finance LP, XTB
The Predictive Value of the Flat End of the Curve
Calm on distant futures contracts and low calendar spreads are not used to guess the exact spot price on a specific day two years from now. They do, however, provide the market with invaluable structural information:
- Determining Marginal Cost: The long end of the curve reflects the long-term marginal cost of extracting a new barrel, below which investments in new fields cease to be profitable.
- Spot Market Gravity: When geopolitical shock factors or piled-up refinery outages disappear, the physical price of the commodity inevitably falls toward the flat part of the curve.
- Absence of Structural Deficit: Low calendar spreads on further contracts confirm that institutional investors treat the current war-logistics bull market purely as a transitory phenomenon.
Everything Still Depends on Trump (Fake it, till you make it)
Although when talking about Donald Trump we have very often used the acronyms TACO, NACHO, or even TAMALES, in the end, most of the volatility occurs following his words. Donald Trump, in the middle of the last week of August, indicated that the Strait of Hormuz is open and that 10 million barrels per day have been flowing through it recently. Although this may seem like positive information on the surface, it should be remembered that it was largely the market and international institutions that led to the stabilization of the oil market, not Donald Trump himself. Moreover, the market is increasingly beginning to doubt his words and assurances, which can also be seen in the change of attitude in the oil market after the opening of the American stock market and the rise in Brent oil prices even to $88 per barrel, which was also contributed to by the DOE report, completely neutralizing the previous impact of the API report. Consequently, if nothing changes in the near future, it may turn out again that the recent falls in the oil market will be limited, and the fuel market premium will return with redoubled force and record further historical peaks.
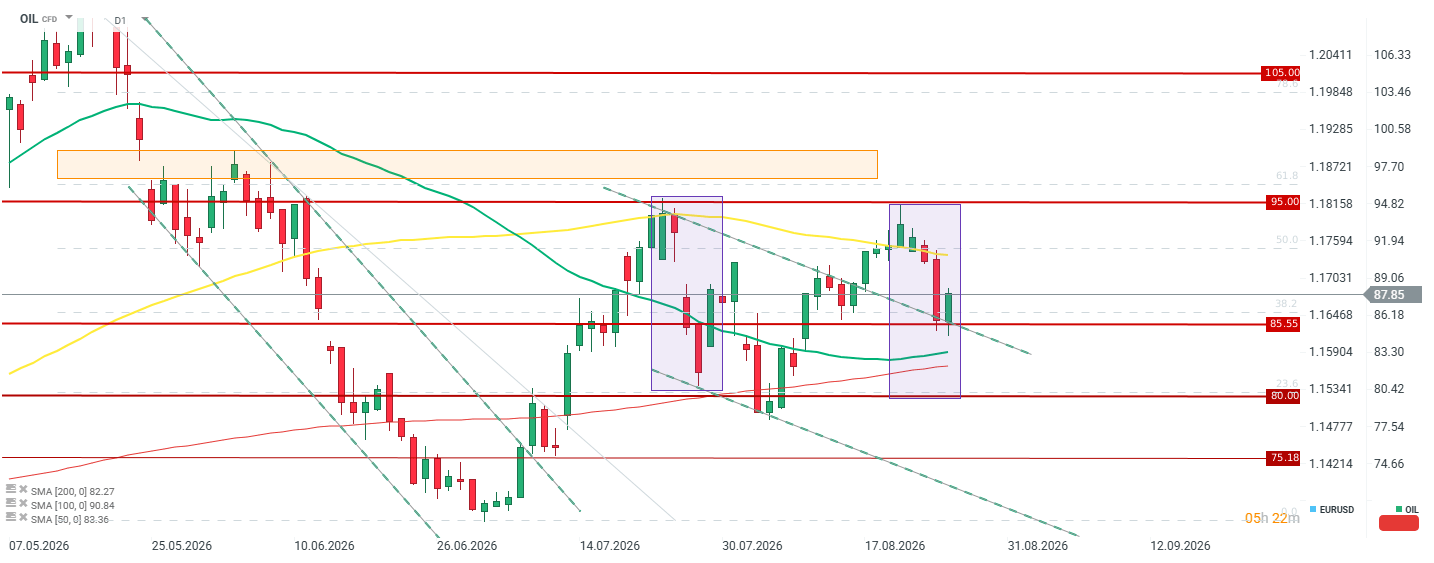
Brent oil is already limiting almost half of yesterday’s sharp drop, which was related only to rumors and not to concrete changes that would lead to a normalization of the situation. Source: xStation5