S&P 500 — US Large Cap Index
 FTSE 100 — UK Blue Chips
 Euro Stoxx 50 — Eurozone Leaders
 DAX 40 — German Equities
 CAC 40 — French Market Index
 Nikkei 225 — Japan Benchmark
 Hang Seng — Hong Kong Index
 Shanghai Composite — China Mainland
 ASX 200 — Australian Market
 TSX Composite — Canada Index
 Nifty 50 — India Large Cap
 STI Index — Singapore Market
 KOSPI — South Korea Index
 Bovespa — Brazil Equities
 JSE Top 40 — South Africa Index
 IPC Index — Mexico Market

- The Indian Rupee appreciates significantly against the US Dollar, with USD/INR sliding to near 94.80.
- RBI’s persistent intervention, India’s strong Q2 GDP data and lower fiscal deficit have supported the INR.
- Investors keenly await the US ISM Manufacturing PMI and JOLTS Job Openings data.
The Indian Rupee (INR) gains sharply against the US Dollar on Tuesday. The USD/INR pair slumps to near 94.80, the lowest level seen in two months, on likely Reserve Bank of India (RBI) intervention, stronger-than-expected Q2 Gross Domestic Product (GDP) data and a narrowed Fiscal Deficit.
According to a Reuters report, there has been persistent RBI intervention through spot and Non-Deliverable Forwards (NDFs) markets to support the Indian currency.
However, there is doubt that the INR’s strength is sustainable, as consistent RBI intervention leaves limited room for further US Dollar selling by the Indian central bank.
According to data from the RBI, the total net short forward positions now stand at a record high of $137 billion in July, up from $104 billion in June. Given that the RBI will eventually have to buy US Dollars to offset its outstanding position, this reflects that the INR’s appreciation is probationary.
India’s Q2 GDP growth remains strong, fiscal deficit narrows
The data on Monday showed that India’s Q2 GDP growth was in line with the prior growth rate of 7.8% Year-on-Year (YoY), stronger than estimates of 7.1%. Analysts at HDFC Bank said that stronger growth was led by upbeat domestic consumption, continued support from government spending, investments and healthy export performance.
Analysts added that input cost pressures due to the West Asia conflict were offset by higher volume growth with sectors like manufacturing and electricity, gas growing by close to 9%. The stand-out sector remained services, with financial, real estate and professional services growing by a high of 12% in the quarter.
Meanwhile, India’s Q2 fiscal deficit stood at Rs. 4.55 trillion ($47.81 billion), or 26.8% of the target for the financial year 2026-27 due to a significant jump in net tax receipts. Government revenue from taxes stood at Rs. 8.5 trillion, compared with Rs. 6.6 trillion a year ago.
US data in focus
In the United States (US), investors await the ISM Manufacturing PMI data for August and the JOLTS Job Openings data for July, which will be published at 14:00 GMT.
The Manufacturing PMI is expected to arrive at 55.2, lower than 55.6 in July. Meanwhile, fresh jobs posted by US employers are seen marginally lower at 7.3 million from 7.359 million in June. The Job Openings data is expected to have a meaningful influence on Federal Reserve (Fed) interest rate expectations.
This week, the major trigger for the US Dollar will be the Nonfarm Payrolls (NFP) data for August, which will be released on Friday.
USD/INR Technical Analysis
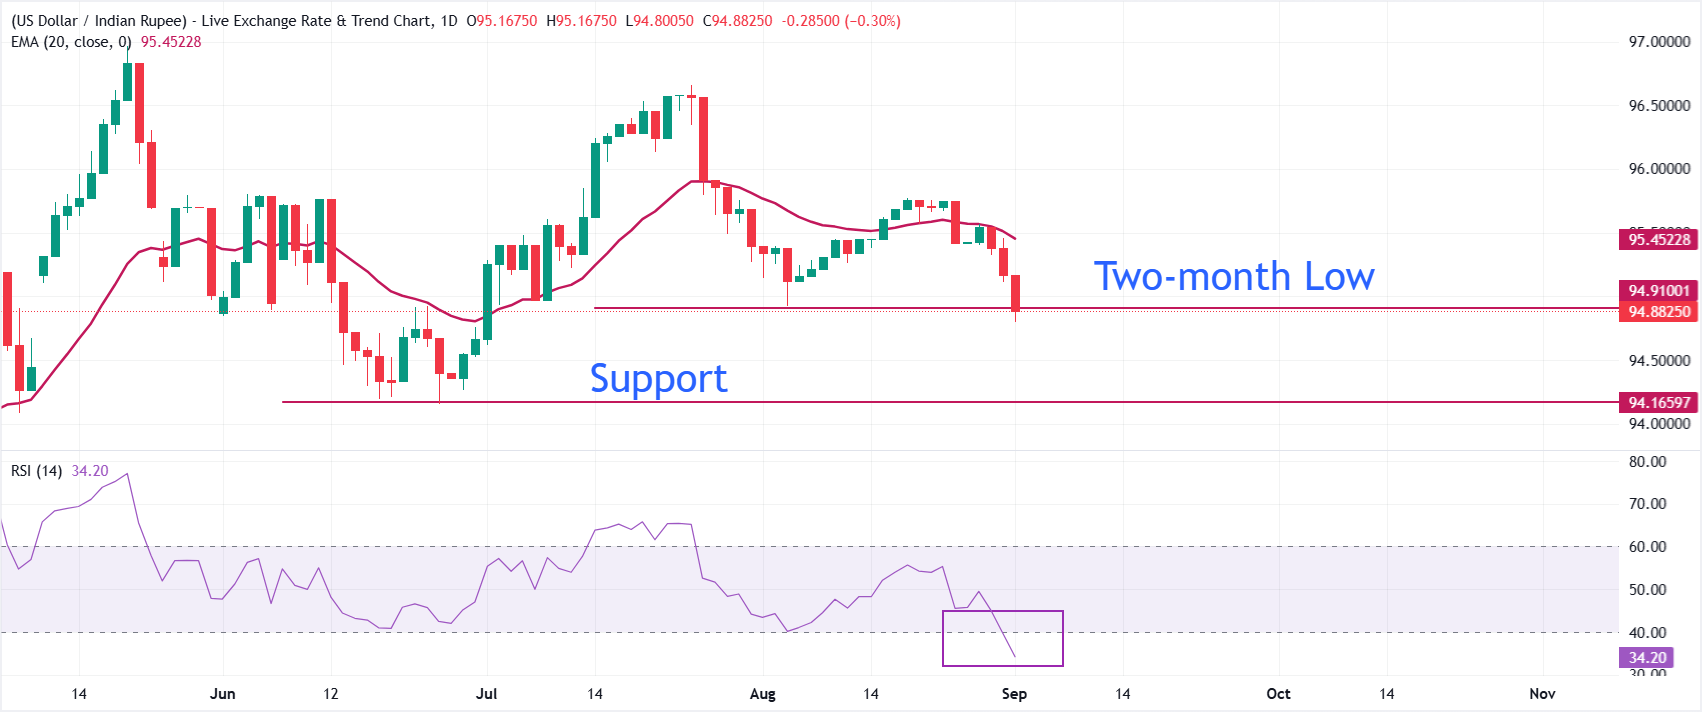
In the daily chart, USD/INR trades at 94.80, keeping a bearish near-term tone as spot holds below the 20-period exponential moving average (EMA) at 95.45.
The Relative Strength Index (14) slips below 40.00 for the first time in almost a year, signaling the onset of a bearish reversal.
On the topside, initial resistance is located at the 20-period EMA around 95.45, which is the first level bulls would need to reclaim to ease immediate downside pressure and open the way for a corrective bounce. Looking down, the pair could extend the decline to 94.50, followed by the June low at 94.19 if it fails to hold the fresh two-month low at 94.80.