S&P 500 — US Large Cap Index
 FTSE 100 — UK Blue Chips
 Euro Stoxx 50 — Eurozone Leaders
 DAX 40 — German Equities
 CAC 40 — French Market Index
 Nikkei 225 — Japan Benchmark
 Hang Seng — Hong Kong Index
 Shanghai Composite — China Mainland
 ASX 200 — Australian Market
 TSX Composite — Canada Index
 Nifty 50 — India Large Cap
 STI Index — Singapore Market
 KOSPI — South Korea Index
 Bovespa — Brazil Equities
 JSE Top 40 — South Africa Index
 IPC Index — Mexico Market

Key takeaways
- Extreme divergence: Copper prices show high resilience and are rising despite a clear economic slowdown in China, which accounts for approximately 50% of global demand.
- Short squeeze phenomenon: Strong pressure on physical deliveries and record backwardation on the LME (price difference between spot and futures contracts) are driving dynamic price increases.
- Upside outlook: In the face of warehouse depletion and customs uncertainty, analysts forecast the possibility of breaking the $14,500, or even $15,000 per ton barrier.
Copper prices in London rose by over 1% at the start of the session to the highest levels of 2026 Copper prices at the start of today’s session continued the dynamic gains that began in late June and early July. Today’s rise brought prices to their highest daily levels since January, but at $14,236 per ton, there is a chance for the highest historical close. This results from a growing “squeeze” on London contracts and a fierce battle for physical delivery. The bull market for this commodity continues despite disappointing data from the Chinese economy, which is responsible for about 50% of the total demand for this raw material.
Weak data from China vs. the strength of industrial metals
July macroeconomic data from China, the world’s second-largest economy, strongly disappointed markets. Retail sales grew by only 0.6% y/y against the expected 1.5%. Additionally, industrial production slowed to 4.5% y/y, and new home prices recorded a 3.2% y/y decline. Another worrying signal is the unexpected rise in unemployment to 5.2%. A clear economic slowdown and the ongoing crisis in the real estate market are hitting demand, which affects, among other things, steel production. It is worth mentioning that China is still the largest recipient of copper in the world, mainly due to the use of this material in infrastructure. Nevertheless, copper is becoming increasingly important in the ongoing energy transformation and artificial intelligence.
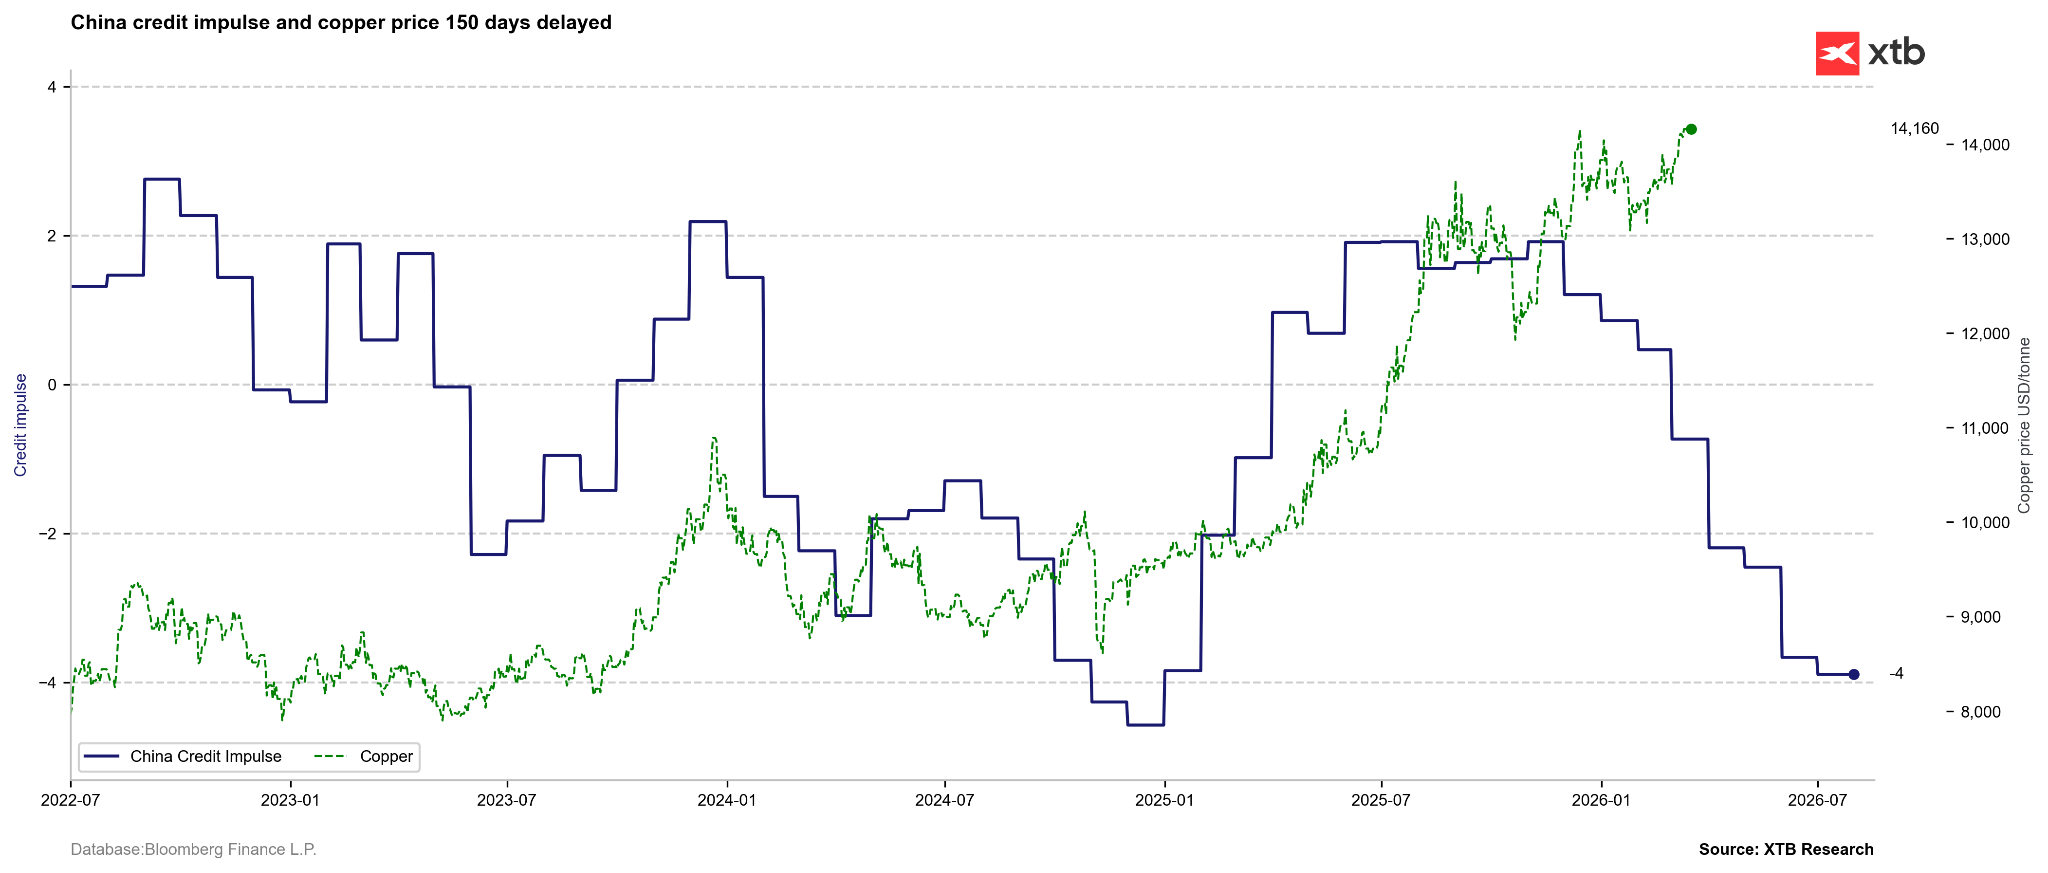
In the past, data from China was an important determinant for copper. Currently, we observe a huge divergence between the leading indicator in the form of the credit impulse and the rising price of copper. Source: Bloomberg Finance LP, XTB Despite such a negative macroeconomic background, industrial metals are showing particular resilience. Copper is recording an extreme deviation of +3.31σ above the 5-year average. Precious metals maintain an equally strong position: gold (+3.13σ) and silver (+2.95σ) represent a safe haven against global geopolitical and economic risks. Logistics tensions in the Middle East, in the Red Sea region, remain a key risk factor, forcing Asian recipients to change supply routes not only for oil but also for key industrial metals.
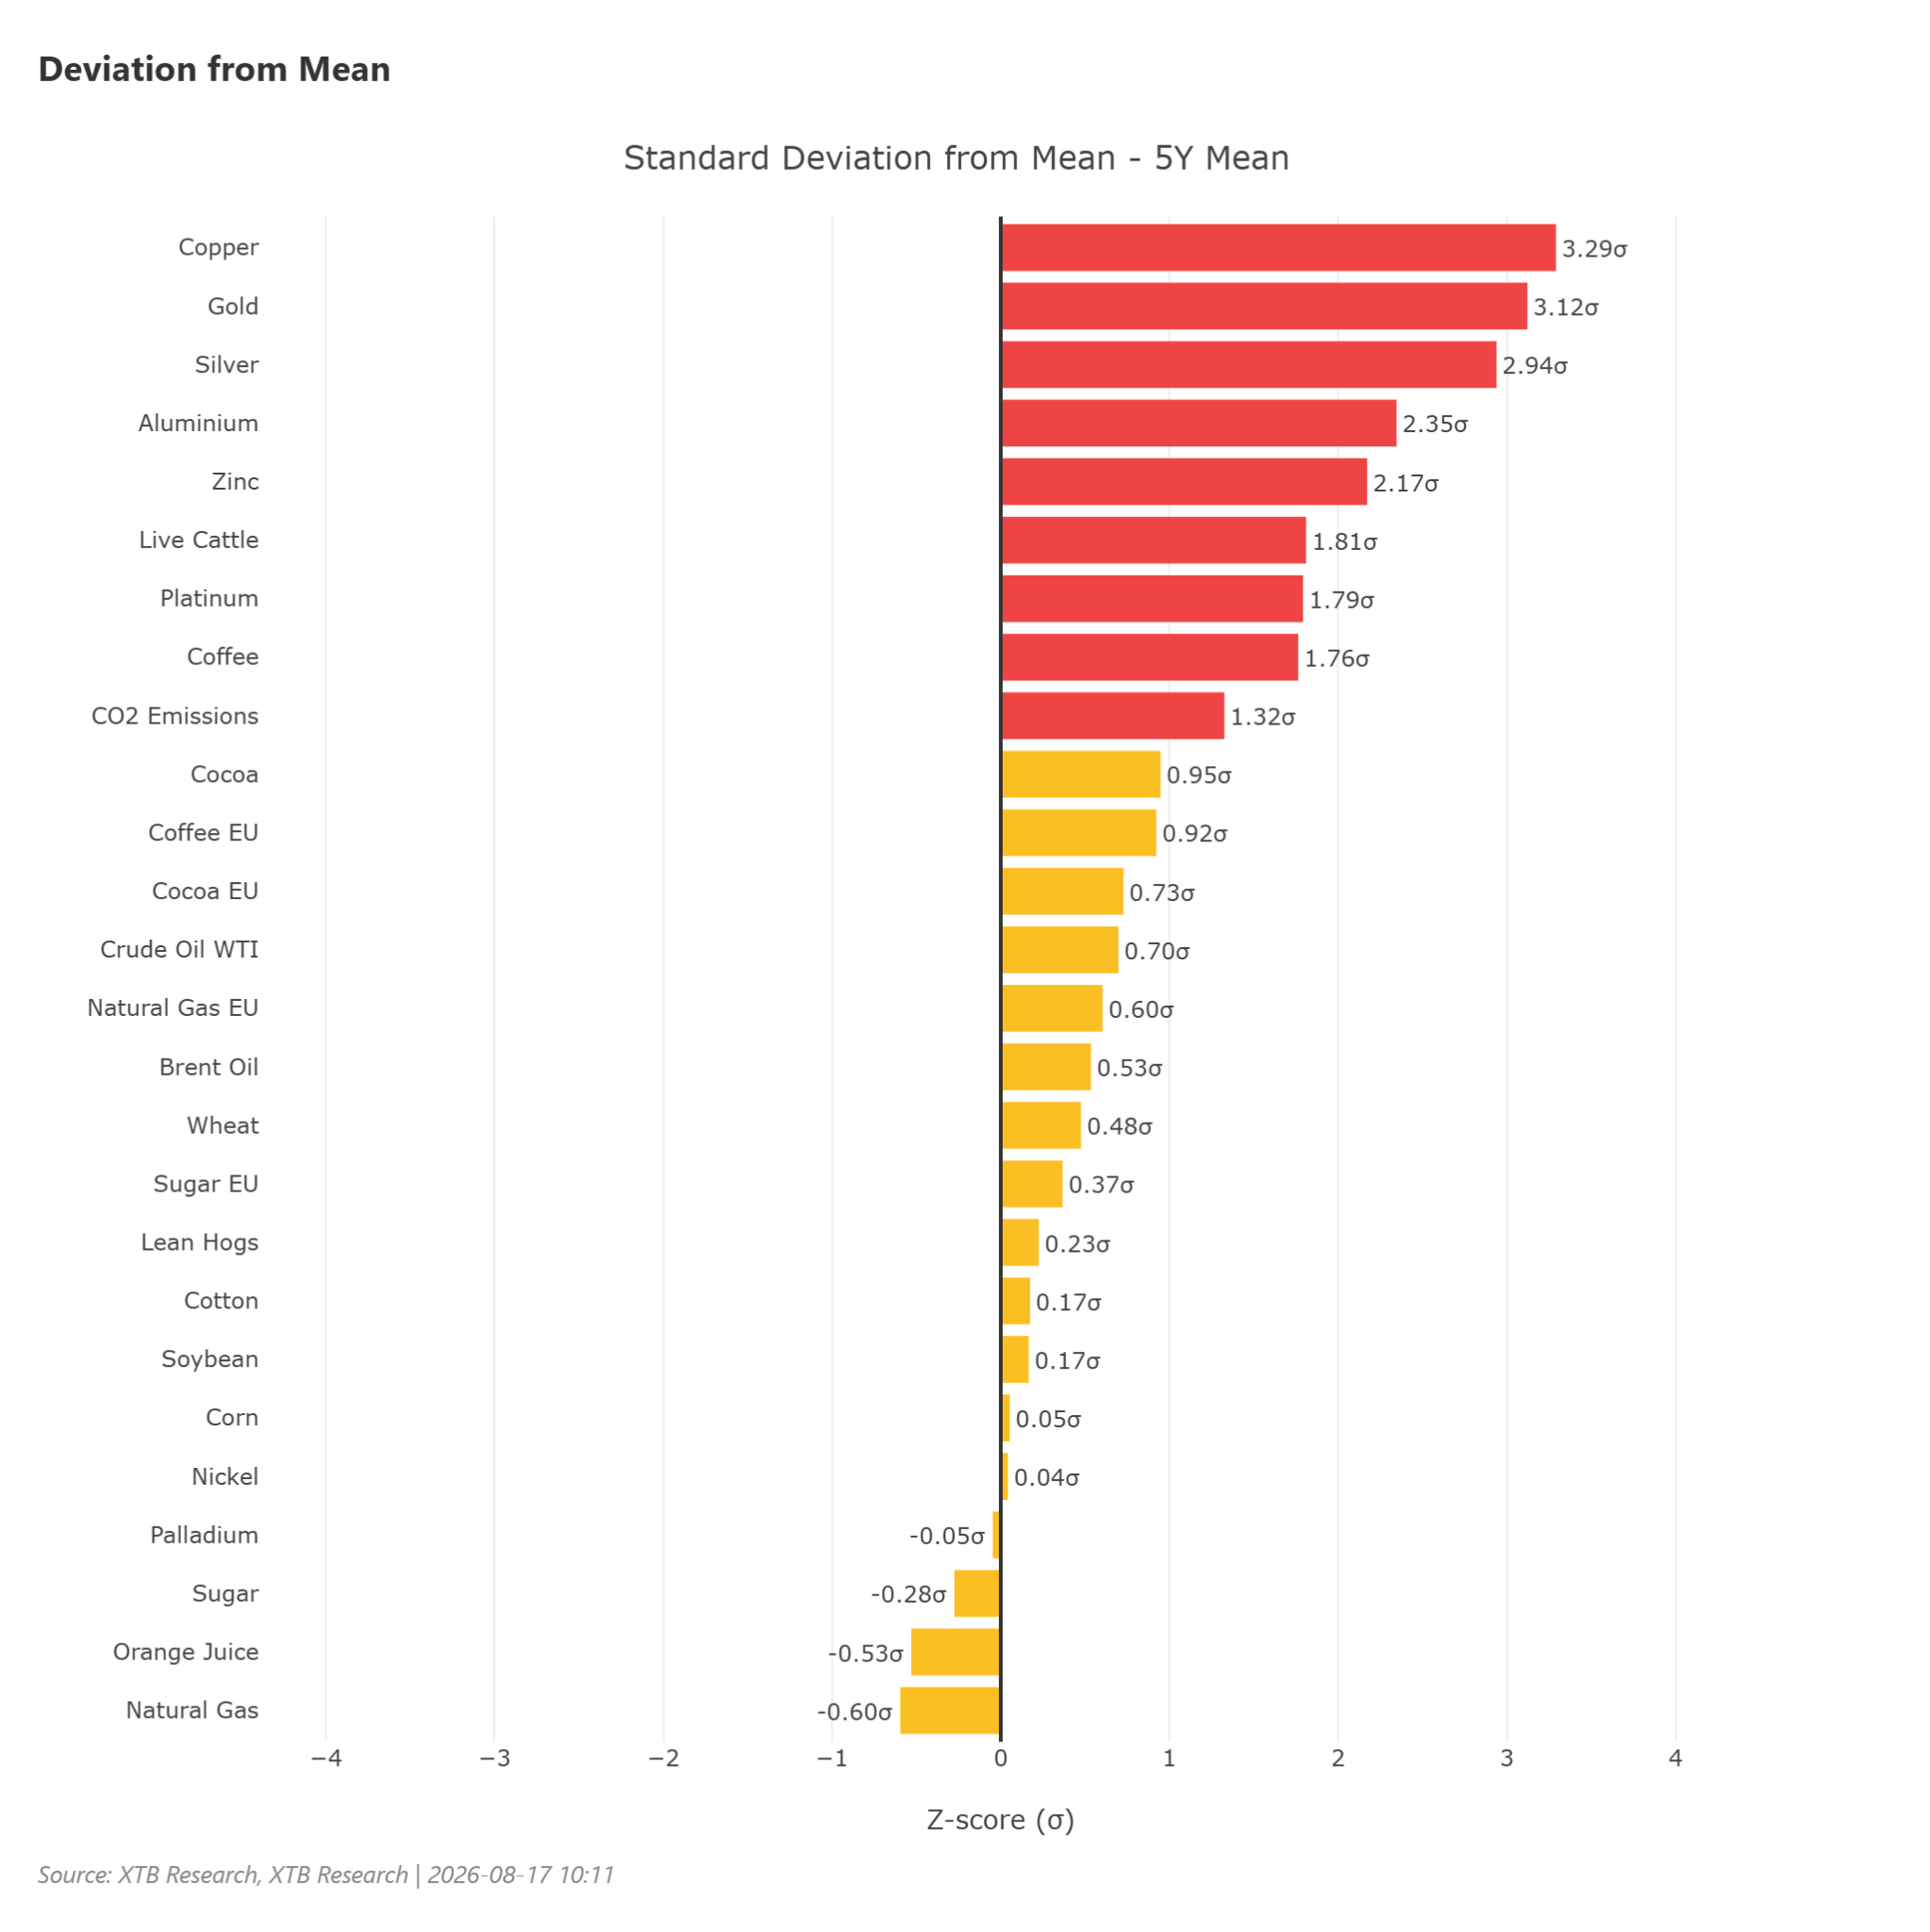
Standard deviations from the 5-year mean for the most important commodities. Source: XTB
The Short Squeeze phenomenon and massive Backwardation on the LME
The main driver of copper prices is an extremely strong physical premium in London and a collapse in inventory levels. The price of copper for immediate delivery (spot) on the London Metal Exchange (LME) was at one point $543.50 per ton higher than three-month contracts. Such a difference, known as backwardation, is the largest observed since the sudden market squeeze in 2021. Furthermore, the premium of the most liquid August contracts over September ones reached $370.
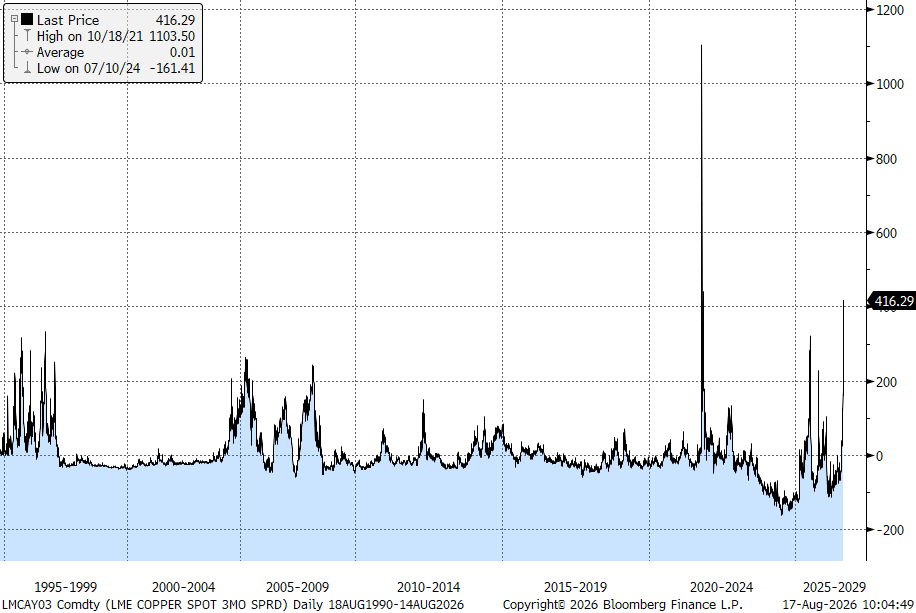
The price difference between the cash price in London and the 3-month price. Source: Bloomberg Finance LP
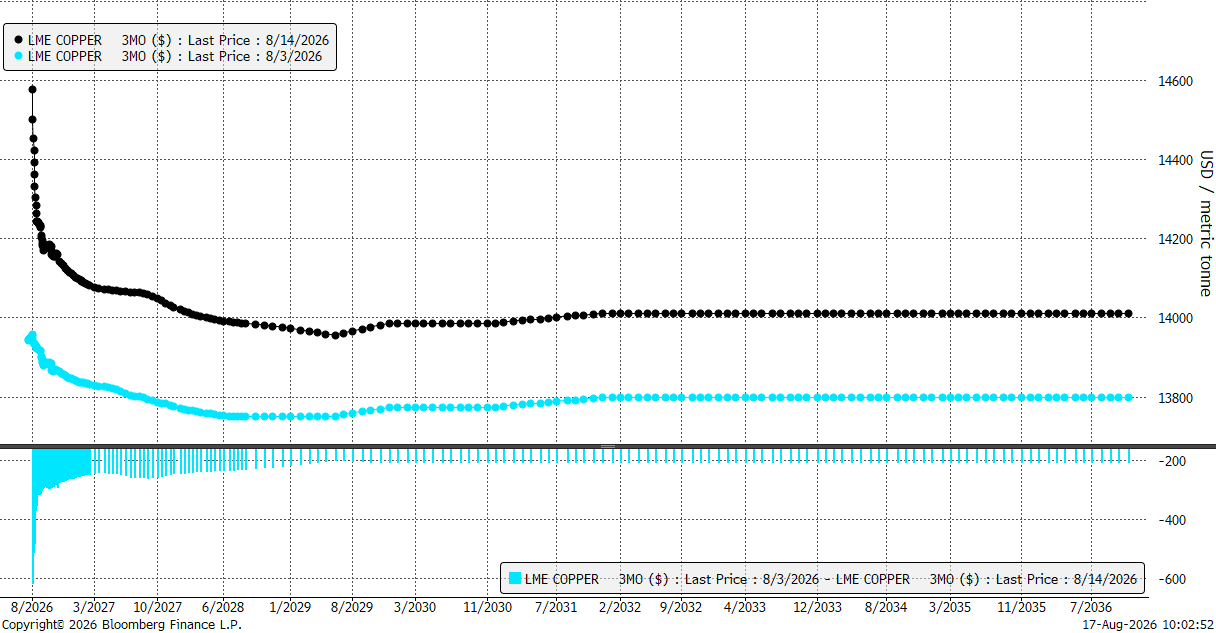
We are seeing a massive short-term backwardation in the copper market. Source: Bloomberg Finance LP Global inventories tracked by the LME have shrunk to just over 200,000 tons. They fell continuously for 42 days, marking the longest such downward streak since 2014. Additional pressure comes from the fact that nearly half of those 205,000 tons of copper in the LME system are already reserved for withdrawal by buyers, leaving the rest of the market with critically low metal availability. Warehouse depletion is supported by the actions of powerful trading groups such as Mercuria, Trafigura, and Vitol, which have been withdrawing copper in recent weeks.
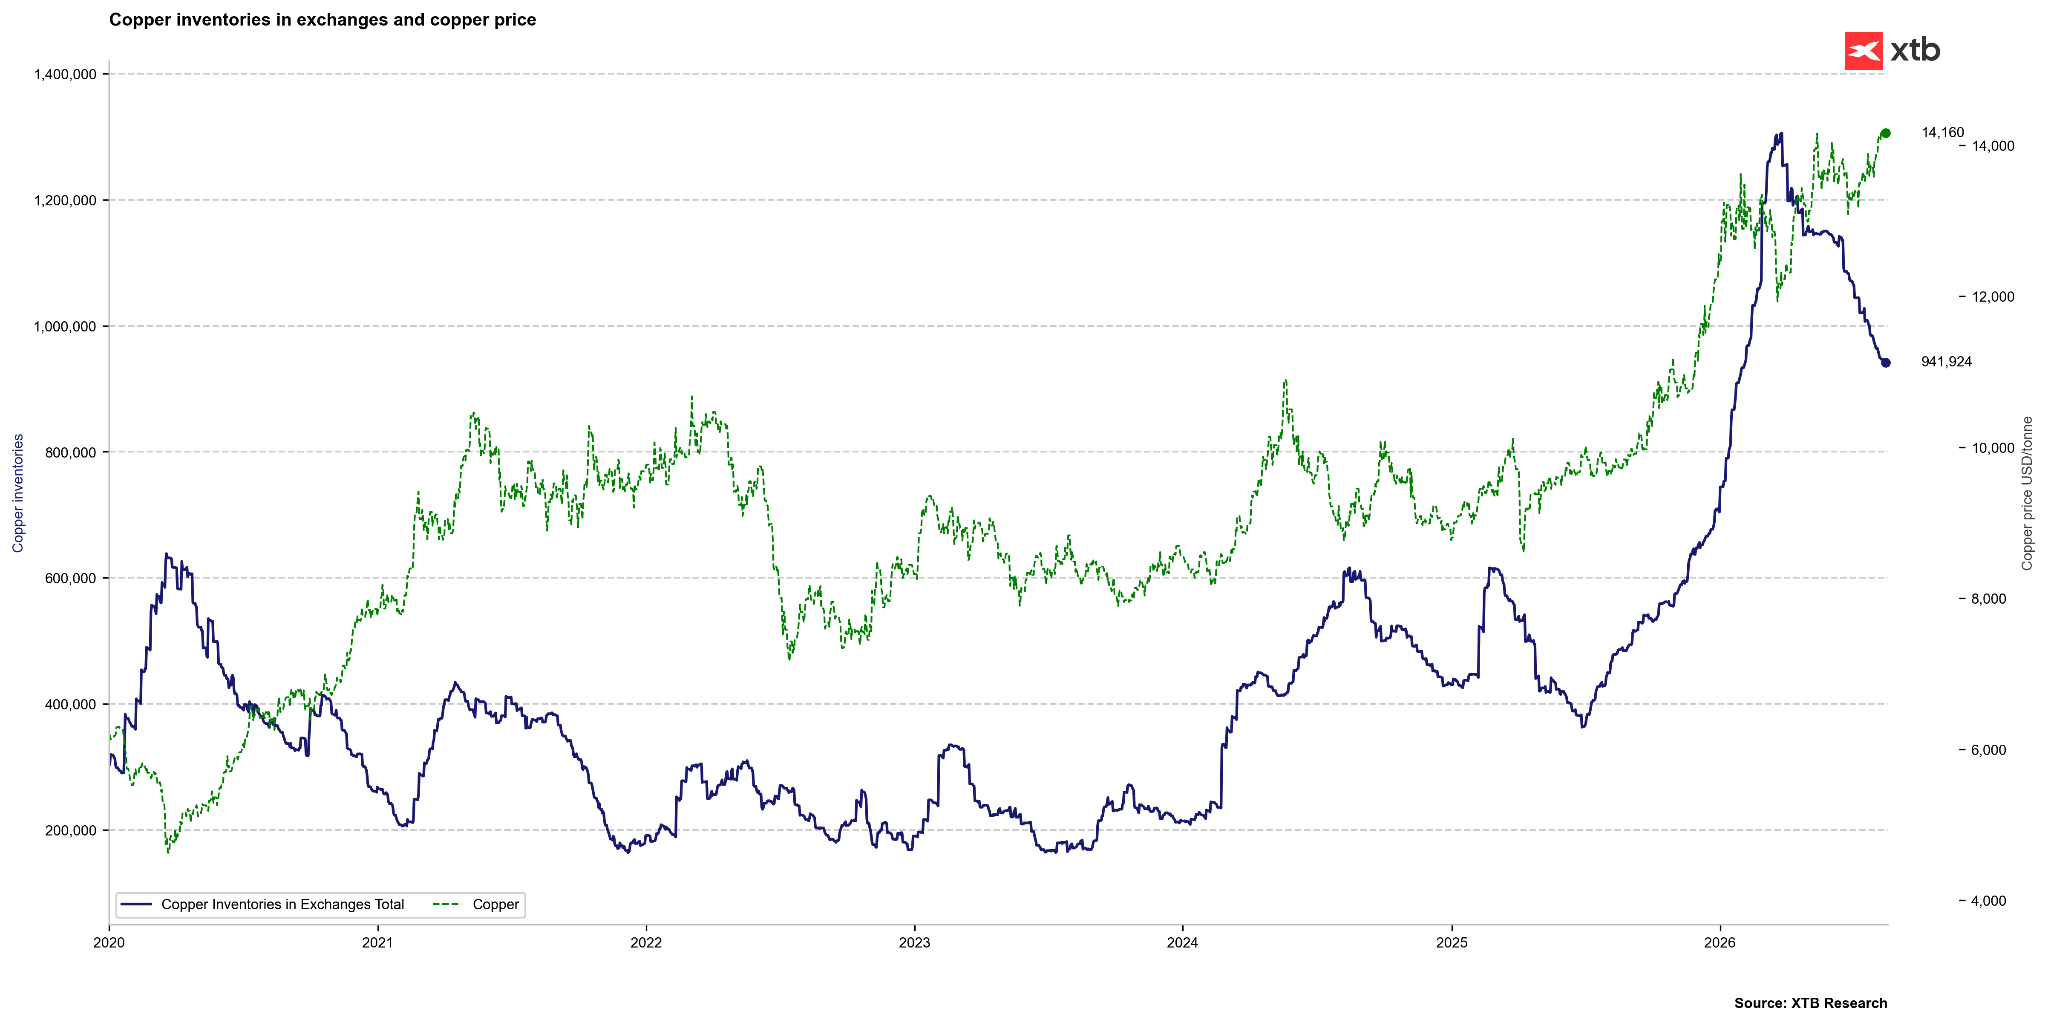
Global copper inventories in exchanges are falling, but in a historical context they do not appear to be extremely low, mainly due to the huge increase in US inventories over the last 1.5 years. Source: Bloomberg Finance LP, XTB
Inventory Divide: Massive inflow to the US and empty warehouses in China
The current situation exposes the specific distribution of global inventories: while warehouses in China are empty, US inventories are growing. A substantial flow of metal to the US stems from expectations that Donald Trump’s administration may soon impose further tariffs on refined copper. This creates an arbitrage stimulating traders to export copper to the US Comex exchange, where prices were breaking records as recently as last year and deviated from London prices by as much as $1,000 per ton. The market is still waiting for a final White House decision, which only fuels uncertainty and increases imports across the ocean. At the same time, Chinese copper smelters have been forced to cut production due to raw material shortages. This problem is compounded by a drop in quality (metal content) in delivered ores and a severe shortage of copper scrap, caused by tightened invoice controls in the Chinese recycling industry. Limited supply from smelters means that some Chinese customers are increasingly relying on importing dwindling inventories from Asian LME warehouses.
Future Outlook
All these phenomena—supply panic, approaching contract settlement deadlines, and a customs war—have caused copper prices to rise by nearly 15% this year. LME quotes have broken the $14,000 per ton barrier. In analysts’ view, the ongoing pressure on entities holding short positions could result in further forced buybacks at increasingly higher prices. It is predicted that in the face of such drastic physical shortages, copper may soon return to its historical highs, breaking the $14,500 barrier and even targeting the vicinity of $15,000 per ton.
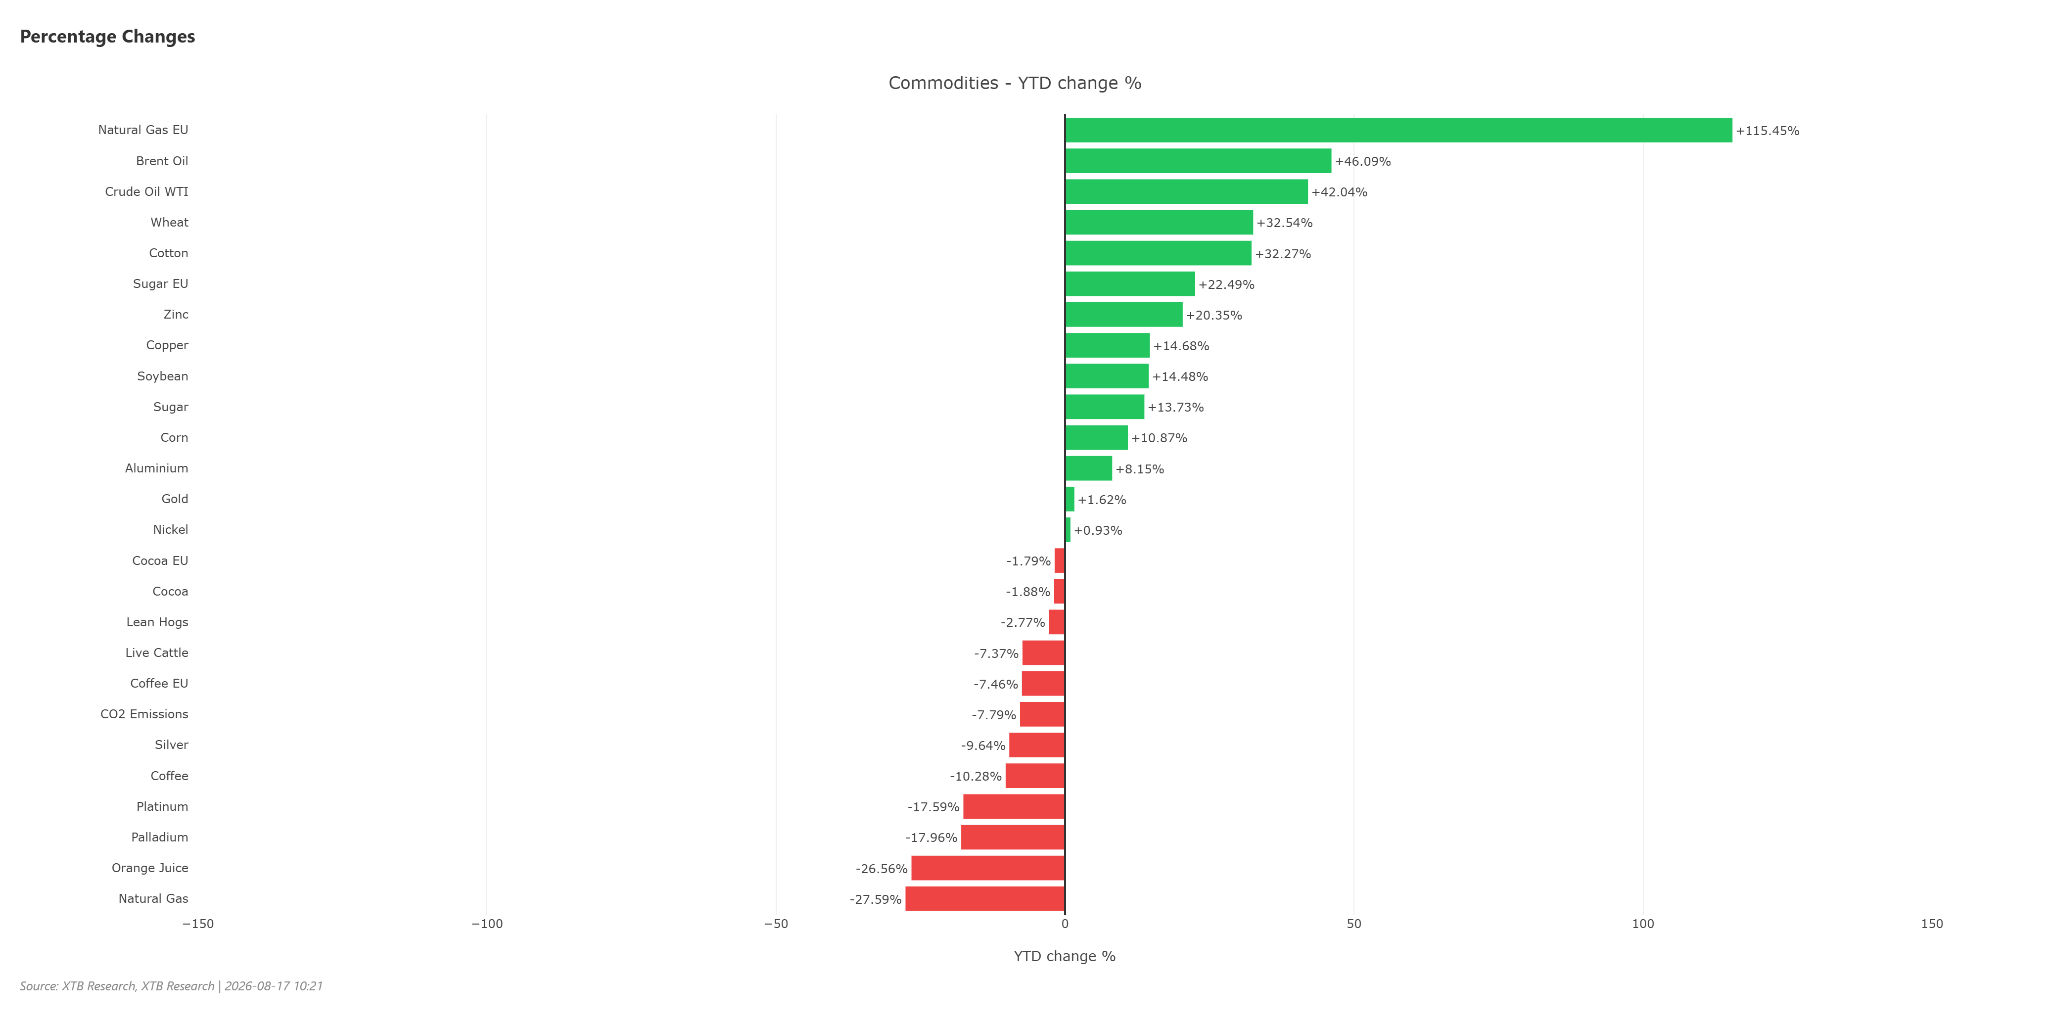
Copper prices have increased by over 15% this year. Source: XTB
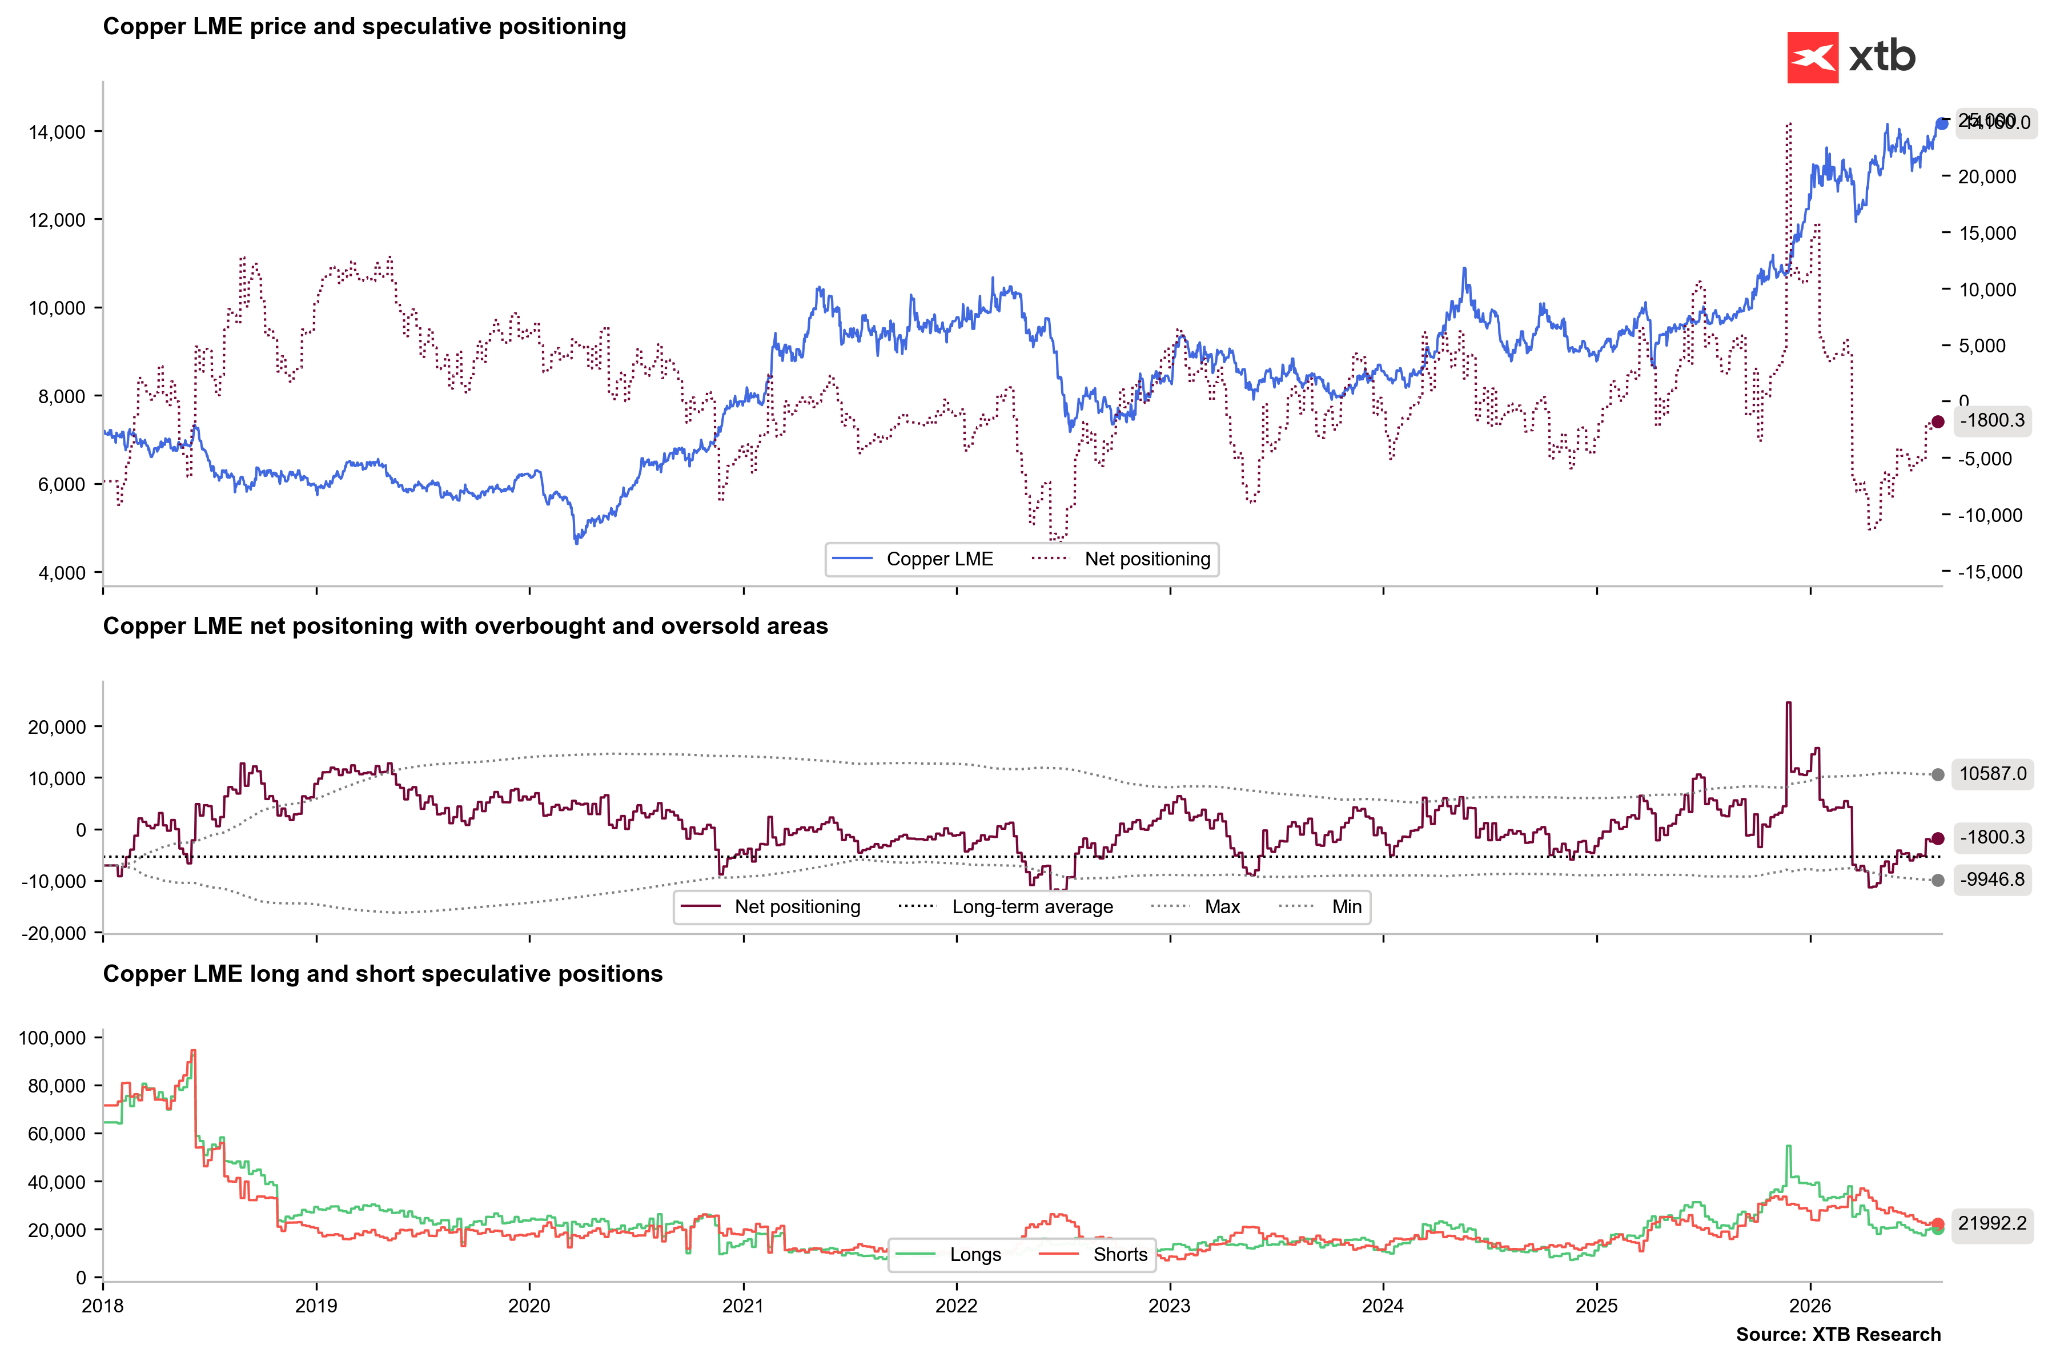
Interestingly, we still see a prevalence of short positions over long positions in the London copper market. Source: Bloomberg Finance LP, XTB
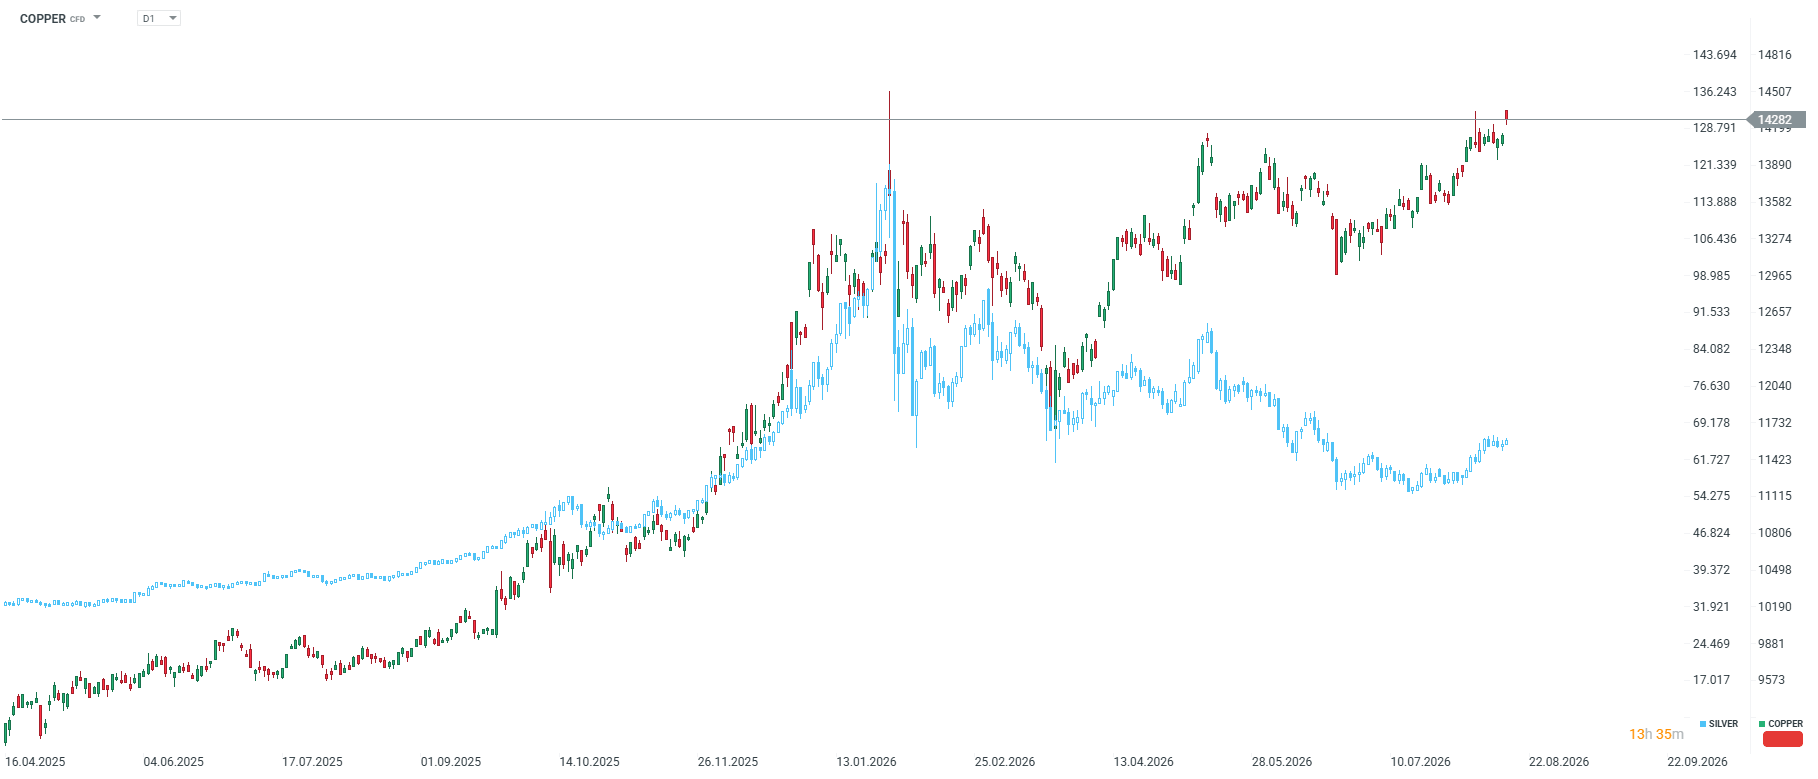
Copper prices are recording strong gains at the beginning of the week, breaking out of a multi-day consolidation. Although globally we are not dealing with problems, the local nature of markets may cause a further squeeze, which could push prices to new historical highs. Source: xStation5