S&P 500 — US Large Cap Index
 FTSE 100 — UK Blue Chips
 Euro Stoxx 50 — Eurozone Leaders
 DAX 40 — German Equities
 CAC 40 — French Market Index
 Nikkei 225 — Japan Benchmark
 Hang Seng — Hong Kong Index
 Shanghai Composite — China Mainland
 ASX 200 — Australian Market
 TSX Composite — Canada Index
 Nifty 50 — India Large Cap
 STI Index — Singapore Market
 KOSPI — South Korea Index
 Bovespa — Brazil Equities
 JSE Top 40 — South Africa Index
 IPC Index — Mexico Market

Mercedes Cuts Profit Forecast Due to China. German automakers plummet


Mercedes-Benz (MBG.DE) joined the growing list of European car manufacturers sounding the alarm. The company has cut its full-year profitability forecast, citing deteriorating conditions in the key Chinese market and higher costs in the fourth quarter, including more expensive materials. Shares are down by around 2.67 per cent today, although during the trading session the fall reached as much as 5.5 per cent, marking the sharpest one-day drop in over a month.
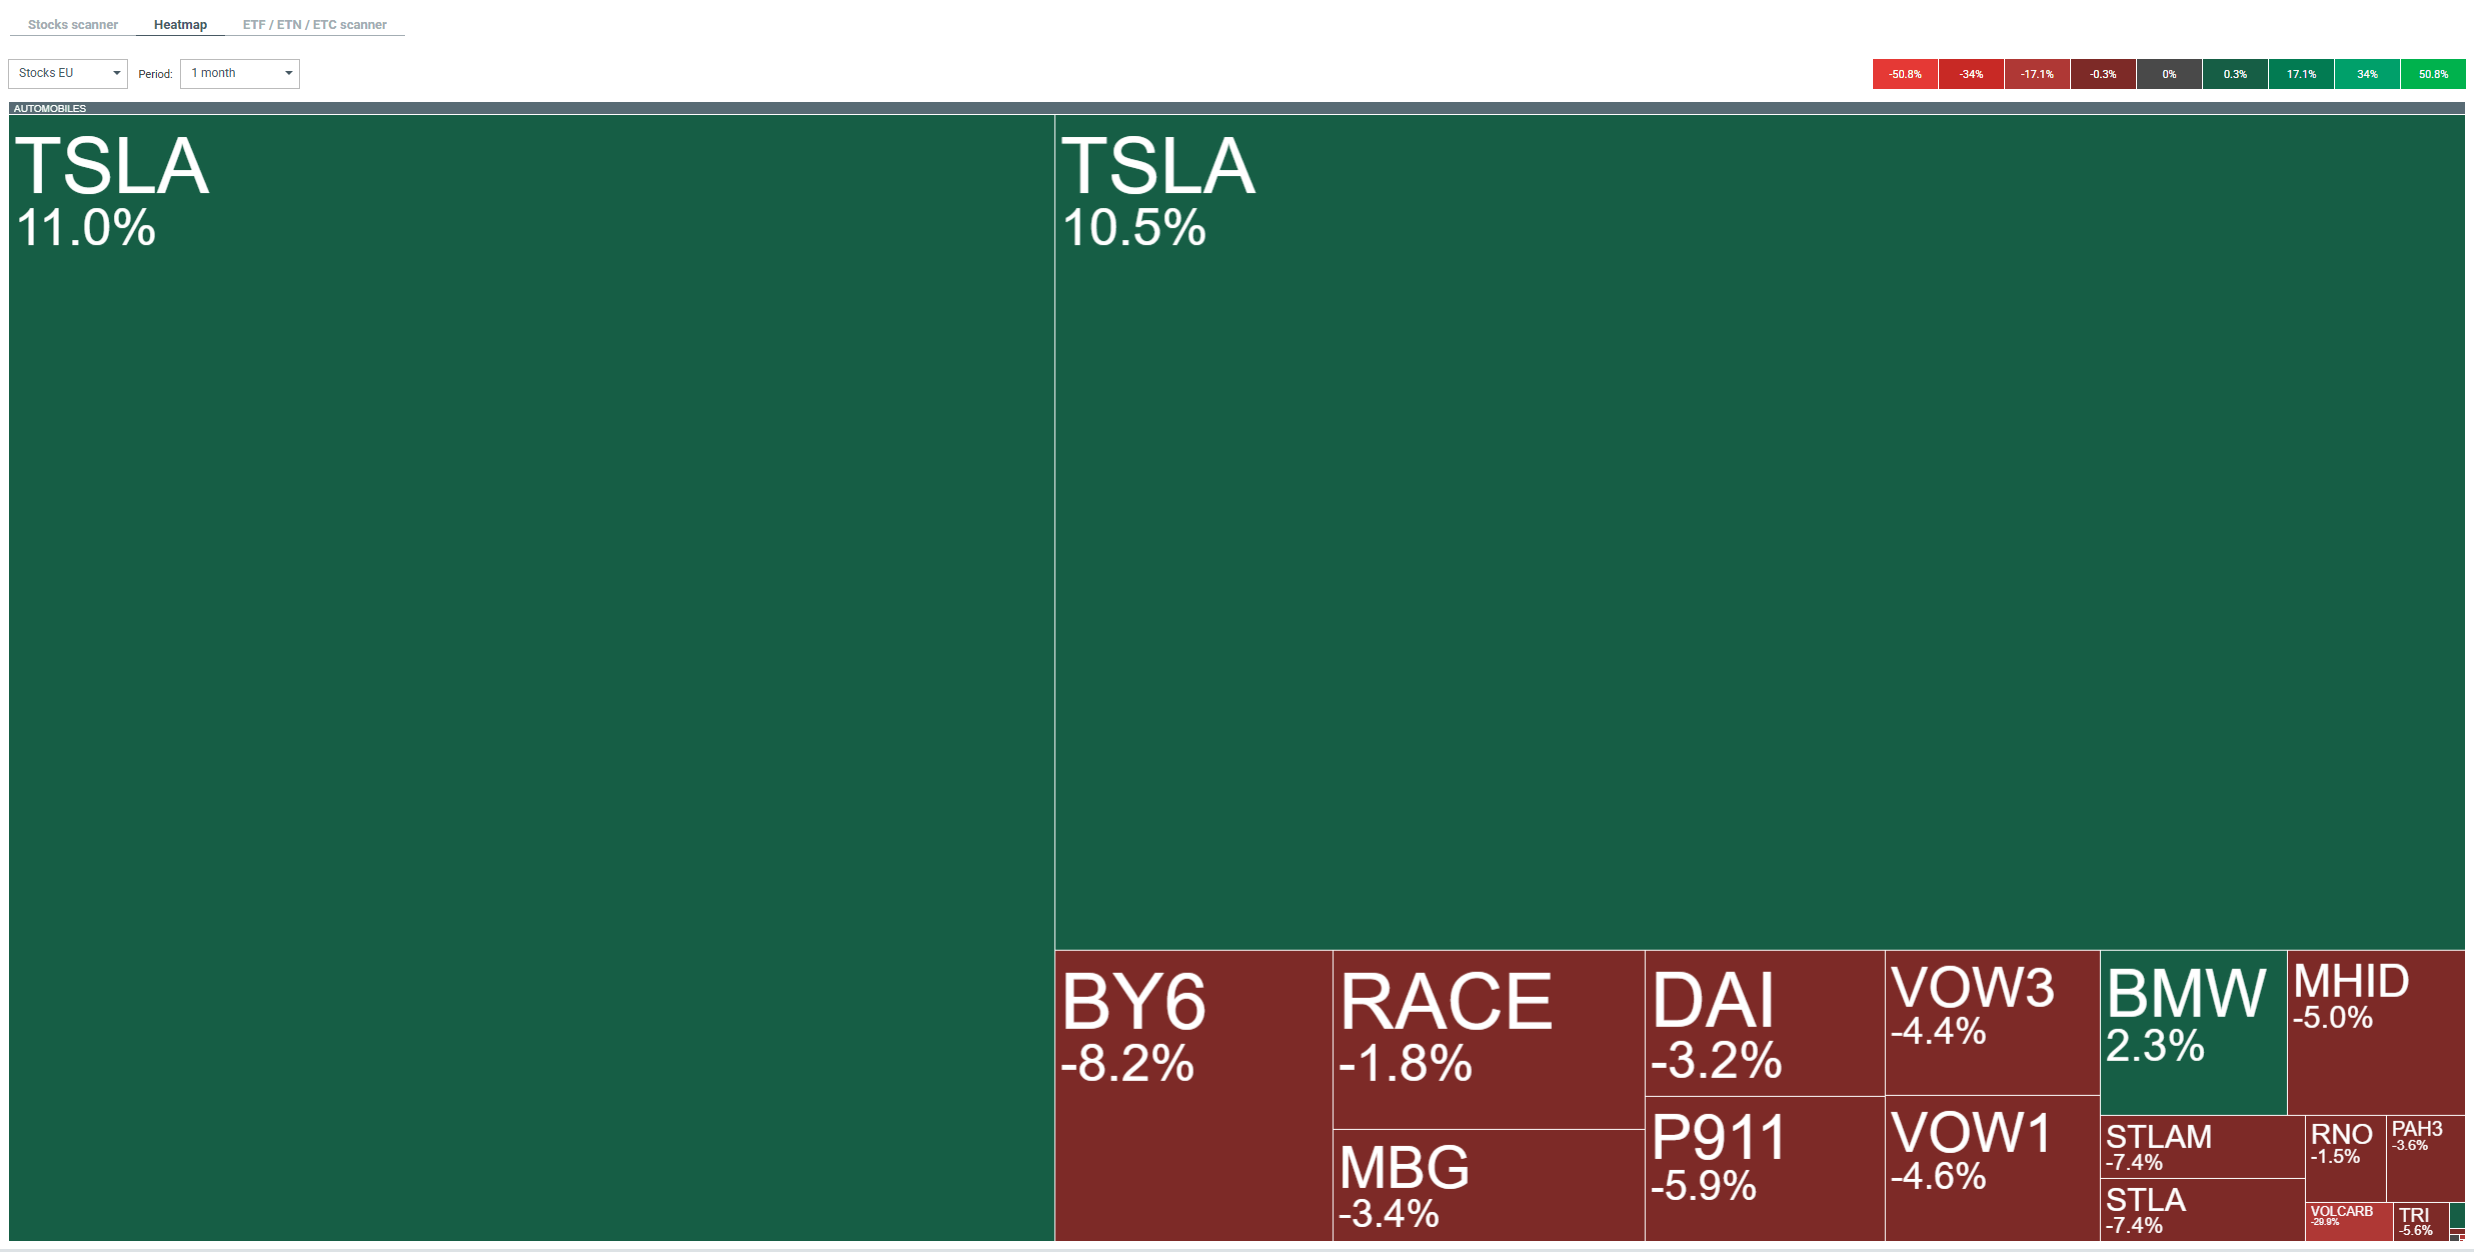
The European automotive sector is not performing particularly well. The heatmap above shows the figures for the last month. Source: XTB Mercedes now expects an adjusted operating margin in its core automotive segment of just 2 to 3 per cent in 2026, compared with the previously forecast 3 to as much as 5 per cent. The group’s overall operating profit is expected to remain broadly flat year-on-year, rather than rising significantly as previously forecast. This revision is driven by harsh market realities, as car sales in the core segment fell by 8 per cent year-on-year in the third quarter, precisely due to weak demand in China. This is not a problem for a single company, but for the entire German automotive industry.
As analysts point out, China is the main reason behind the struggles of German manufacturers, who are facing a slowdown in demand and relentless competition from local brands, which is eroding both sales volumes and pricing power. Volkswagen and BMW had already cut their forecasts earlier this year for the same reasons, and today the sell-off has spread across the entire sector, with BMW, Renault and Volkswagen all falling by around 3 to 3.5 per cent. The European automotive sector was the second-weakest sector in the STOXX 600 index. An interesting counterpoint is Porsche, which on the same day reported a rebound in profitability and is up by around 3 per cent despite a fall in car sales.
Porsche has significantly reduced its reliance on China and is positioning the brand even more firmly in the premium segment, making it less vulnerable to competition from Chinese manufacturers entering the European market. Mercedes and BMW, on the other hand, remain heavily exposed to the Chinese market, and it is this exposure that is taking its heaviest toll today. This is clearly evident in this year’s return figures, where Porsche, with a return of around minus 8 per cent, looks downright respectable compared to its rivals, whilst Mercedes is down 34.8 per cent, Volkswagen down 34.9 per cent, and BMW at the bottom with a return of minus 39.7 per cent. In the background, the trade issue is also coming to the fore. Brussels has recently introduced a cap of 350,000 imported Chinese hybrid vehicles per year, which marks a significant escalation in the trade confrontation with Beijing. This is a double-edged sword, as protecting domestic manufacturers risks a Chinese retaliation, for example through tighter restrictions on rare-earth metals, which could deal a further blow to European manufacturing.
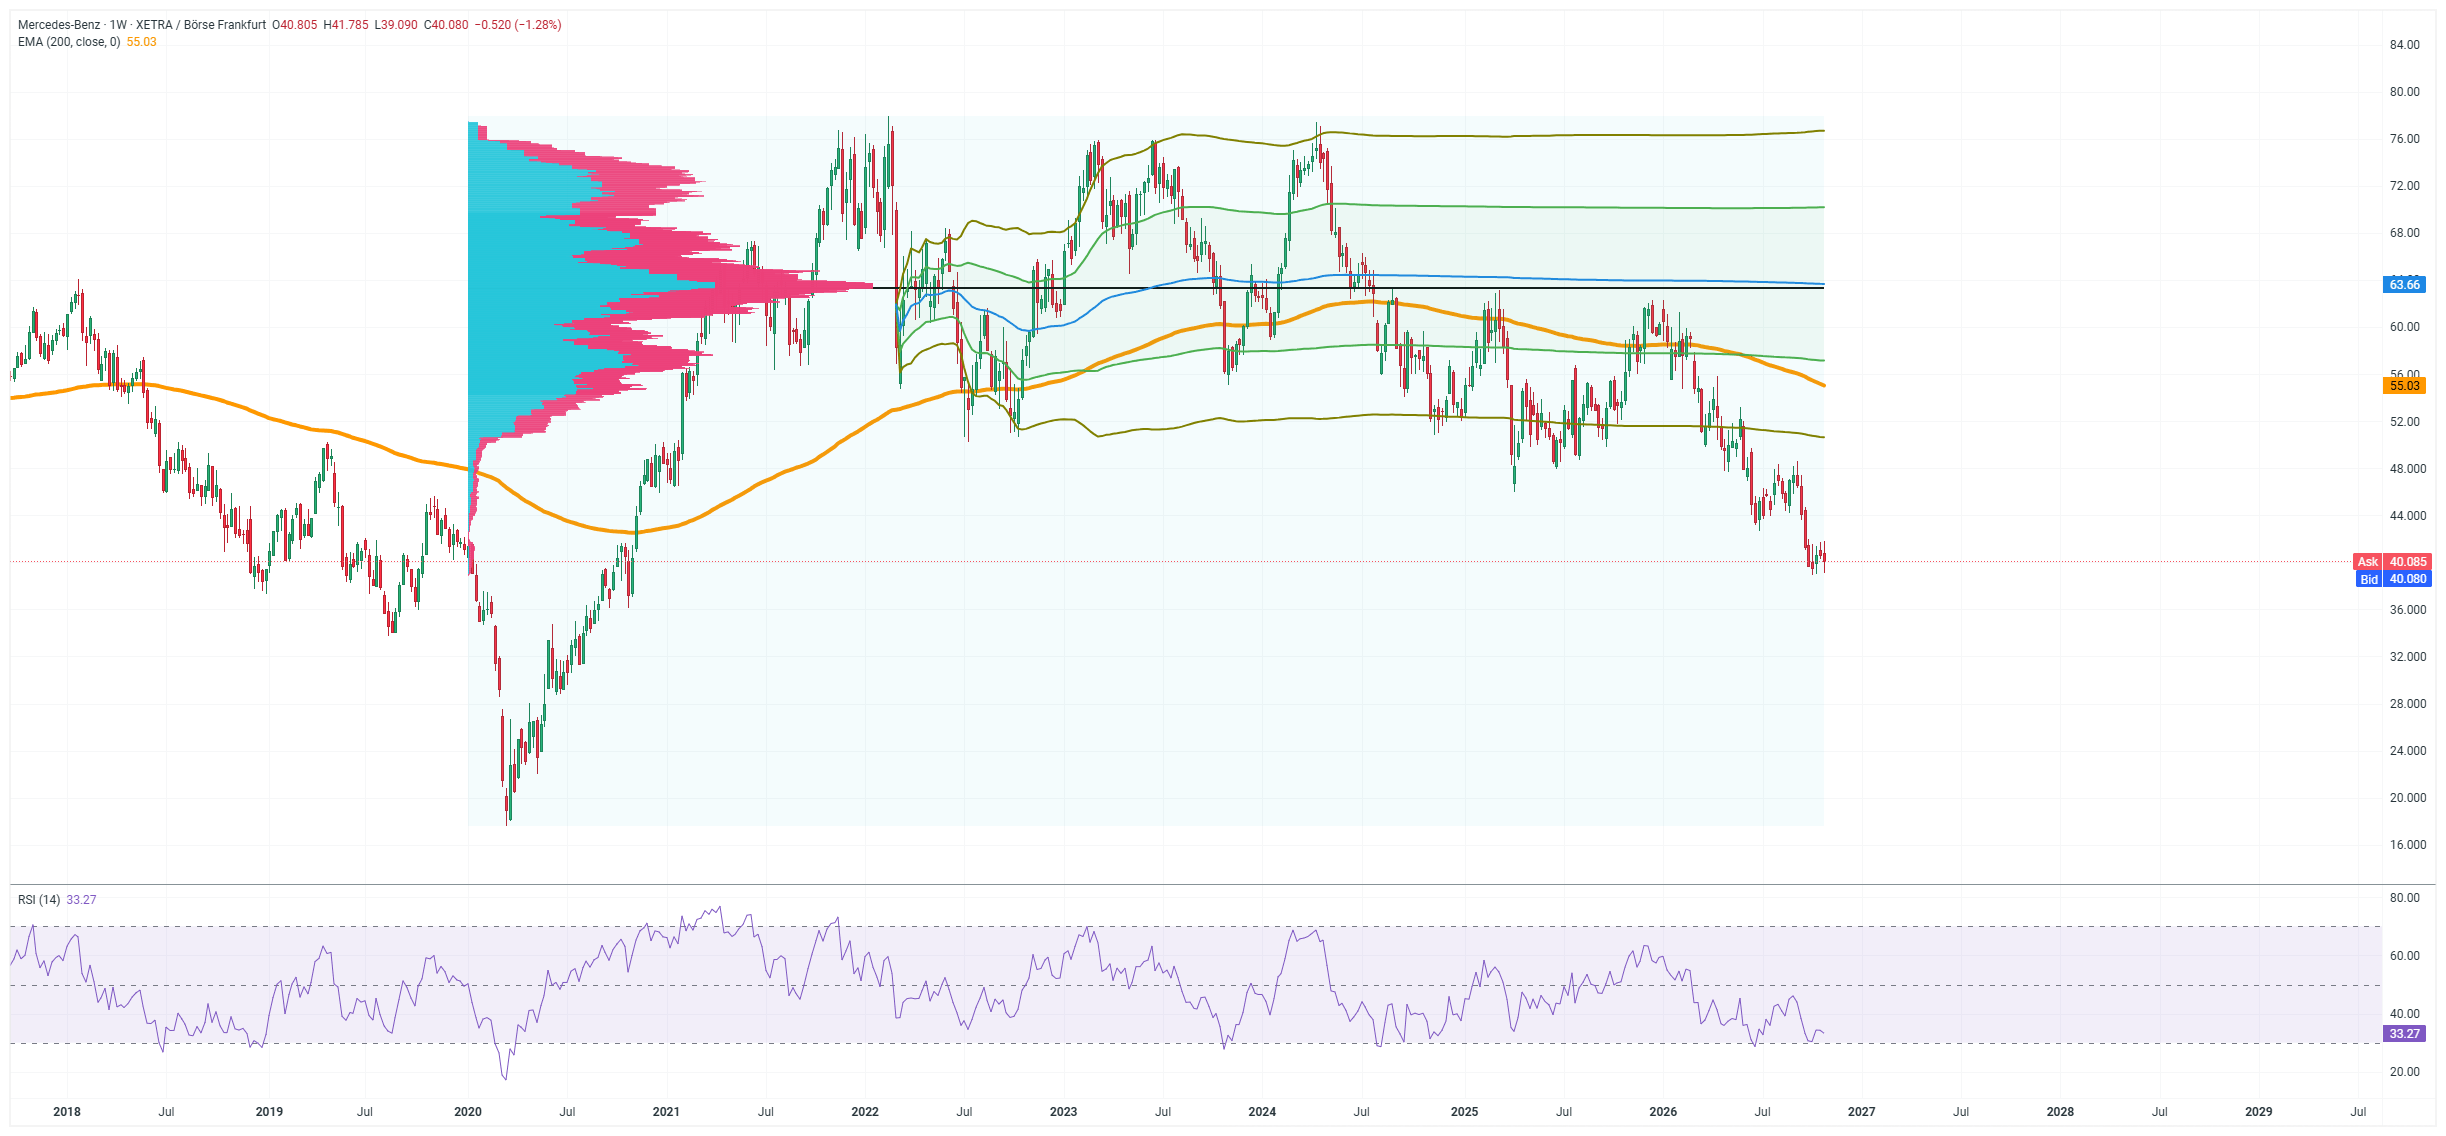
Mercedes’ technical picture is weak and fully reflects the company’s fundamental problems. On the weekly chart, the share price has slumped to around 40 euros – levels not seen for years, apart from the pandemic crash of 2020. The shares are trading well below the 200-week exponential moving average, which stands at around 55, and the distance from it illustrates just how far the current downtrend has extended.
The entire structure since the 2021 and 2022 highs in the €76 to €78 range consists of a series of progressively lower highs and lows – a classic, long-term downtrend that is continuing today. The volume profile plotted on the chart is particularly telling. A huge trading cluster – that is, the zone where the highest volume has historically been traded – stretches roughly between 56 and 68 euros, with a distinct cluster around 63 to 64 euros. This means that most investors who have built up positions in recent years are currently sitting on a substantial loss, and this entire area is turning into a massive, multi-layered supply barrier hanging over the heads of buyers.
In other words, even if a rebound were to occur, the path upwards would be littered with levels at which further investors would seek to take their profits. Below the current price, however, the volume profile is thin, indicating weak support and the risk that, should the sell-off continue, there are not many technical support levels to halt the decline. The RSI on the weekly chart has fallen to around 33, meaning it is approaching oversold territory, which highlights the strength of the recent downtrend; however, this in itself is not yet a reversal signal, particularly as the RSI can remain at low levels for a long time during a downtrend.