Facts
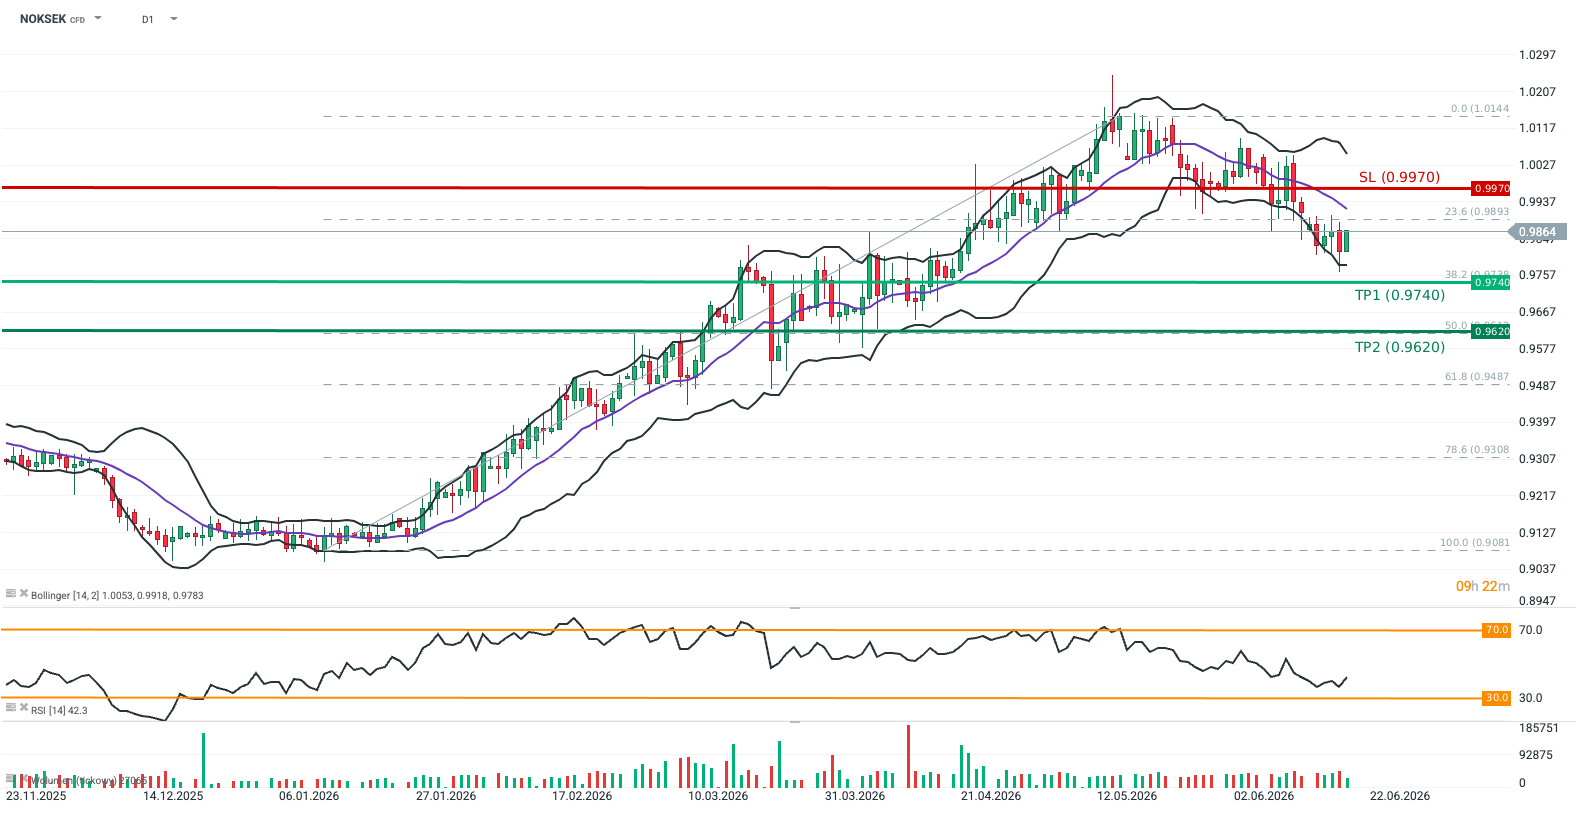
- The NOKSEK closing price has remained below the 23.6% Fibonacci retracement level (measured from January 13 to May 15) for the last five consecutive sessions.
- The exchange rate failed to return above the middle Bollinger Band on the 14-day timeframe, despite yesterday’s declaration from Norges Bank indicating its intention to hike interest rates in the coming months.
- Crude oil futures (OIL) have lost approximately 7.5% since the beginning of the week.
Recommendation
- Position: Short (SELL) on NOKSEK at market price
- Target Price (Take Profit; TP): 0.9740 (TP1), 0.9620 (TP2)
- Stop Loss (SL): 0.9970
Source: xStation5
Opinion
NOKSEK broke its upward trend alongside the de-escalation of the Middle East conflict due to its tight correlation with oil prices (Norway remains one of the key net exporters of the commodity). The cross also failed to react significantly to the hawkish rhetoric from Norges Bank, which announced interest rate hikes in the coming months in the face of elevated CPI inflation (3.1% in May 2026). The rate remains in a downward trend (consistently trading between the middle and lower Bollinger Bands on the 14-day interval) despite the recent widening of the yield spread between 2-year Norwegian and Swedish government bonds.
This suggests that the exchange rate’s correlation with oil prices and the fading geopolitical risk premium remain the dominant drivers. Upside for the NOK may also be capped by the broader macroeconomic outlook—Norges Bank projects elevated inflation above target until 2029, alongside the risk of unemployment rising to pre-pandemic levels. Conversely, forecasts for Sweden point to accelerating GDP growth (1.8% in 2026 and 2.2% in 2027; source: Eurostat) combined with falling inflation below 2% (1.5% in 2026 and 1.8% in 2027; source: Eurostat).
Methodology
This recommendation was prepared based on a technical analysis of the NOKSEK chart, a fundamental analysis of the respective economies (monetary policy in Norway and Sweden), and the exchange rate’s correlation with crude oil prices. The directional bias of the recommendation was determined using Bollinger Bands. Take Profit and Stop Loss levels were established using Fibonacci retracements and price action (TP1 and TP2 at the 38.2% and 50.0% Fibo levels of the latest upward wave; SL placed at the resistance of the last rebound prior to the trend reversal).