S&P 500 — US Large Cap Index
 FTSE 100 — UK Blue Chips
 Euro Stoxx 50 — Eurozone Leaders
 DAX 40 — German Equities
 CAC 40 — French Market Index
 Nikkei 225 — Japan Benchmark
 Hang Seng — Hong Kong Index
 Shanghai Composite — China Mainland
 ASX 200 — Australian Market
 TSX Composite — Canada Index
 Nifty 50 — India Large Cap
 STI Index — Singapore Market
 KOSPI — South Korea Index
 Bovespa — Brazil Equities
 JSE Top 40 — South Africa Index
 IPC Index — Mexico Market

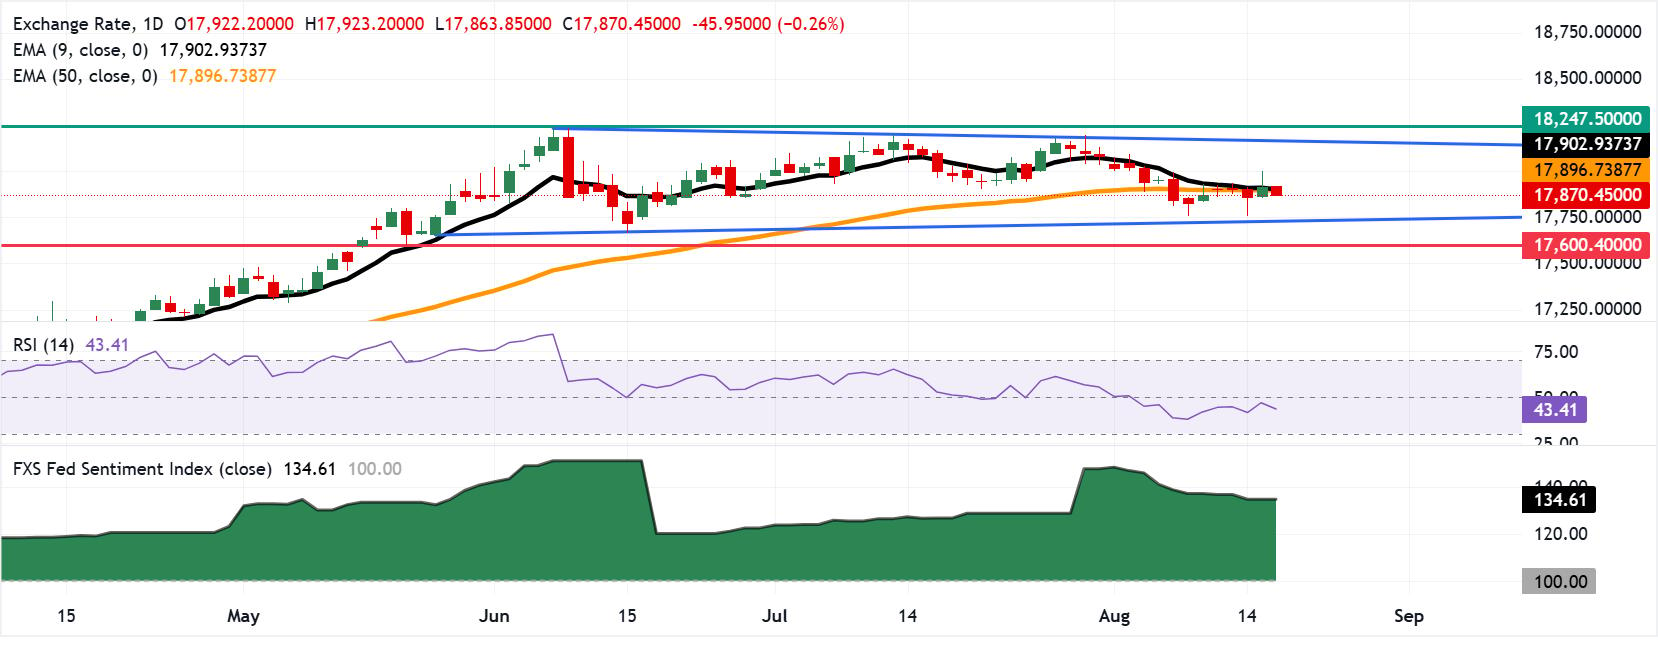
- USD/IDR may fall toward the lower rectangle boundary around 17,750.
- The 14-day Relative Strength Index at 43.48 signals fading bullish momentum.
- The pair may rebound toward the immediate barrier at the 50-day EMA of 17,896.
USD/IDR depreciates after registering modest gains in the previous day, trading around 17,870 during the Asian hours on Wednesday. The technical analysis of the daily chart suggests that the pair is remaining within the rectangle, indicating a consolidation phase.
The USD/IDR pair is holding a bearish near-term bias as spot remains capped beneath both the nine-period and 50-period Exponential Moving Averages (EMAs). The clustering of these short- and medium-term EMAs just above price suggests topside attempts are vulnerable, while the 14-day Relative Strength Index (RSI) at 43.48 points to fading bullish momentum without yet reaching oversold territory, keeping the pair under mild downside pressure.
The USD/IDR pair may fall toward the lower boundary of the rectangle around 17,750, followed by the three-month low of 17,600, which was recorded on May 20.
USD gains as risk aversion weighs on Asia FX
Strategists at UOB Group highlight that renewed caution in global markets has reinforced demand for the Dollar, noting that the “USD firmed up against most Asia FX as risk aversion returned as the key near-term driver.” They point out that the shift in sentiment has left regional currencies on the back foot, with investors gravitating toward the relative safety of the Greenback as risk appetite fades.
On the upside, the immediate barrier lies at the 50-day EMA of 17,896, followed by the nine-day EMA at 17,902. A break above these moving averages would reinforce the bullish bias and support the USD/IDR pair to approach the upper boundary of the rectangle around 18,170, followed by the all-time high of 18,247, reached on June 8.
Goolsbee’s cautious optimism on inflation keeps Dollar focus on Fed path
Fed’s Goolsbee delivered a notably softer tone, with an FXS Speechtracker score of 4.6/10, well below the 6.8/10 historical average, signaling reduced hawkish conviction. The emphasis on “a little bit better” inflation readings and hope that tariff- and oil-driven price spikes prove one-off suggests growing confidence that inflation can drift back toward 2%, but without declaring victory. The characterization of the US economy as “steady” reinforces a gradualist stance, implying the Fed can stay patient while watching incoming data.
The FXS Fed Sentiment Index fell 2.36 points to 134.61, indicating a modest pullback in perceived hawkishness. Despite the decline, the index remains firmly above the 100 neutral mark, underscoring that Fed policy is still viewed as hawkish overall, even as Goolsbee’s softer tone drags the FXS Speechtracker score below the established baseline.