S&P 500 — US Large Cap Index
 FTSE 100 — UK Blue Chips
 Euro Stoxx 50 — Eurozone Leaders
 DAX 40 — German Equities
 CAC 40 — French Market Index
 Nikkei 225 — Japan Benchmark
 Hang Seng — Hong Kong Index
 Shanghai Composite — China Mainland
 ASX 200 — Australian Market
 TSX Composite — Canada Index
 Nifty 50 — India Large Cap
 STI Index — Singapore Market
 KOSPI — South Korea Index
 Bovespa — Brazil Equities
 JSE Top 40 — South Africa Index
 IPC Index — Mexico Market

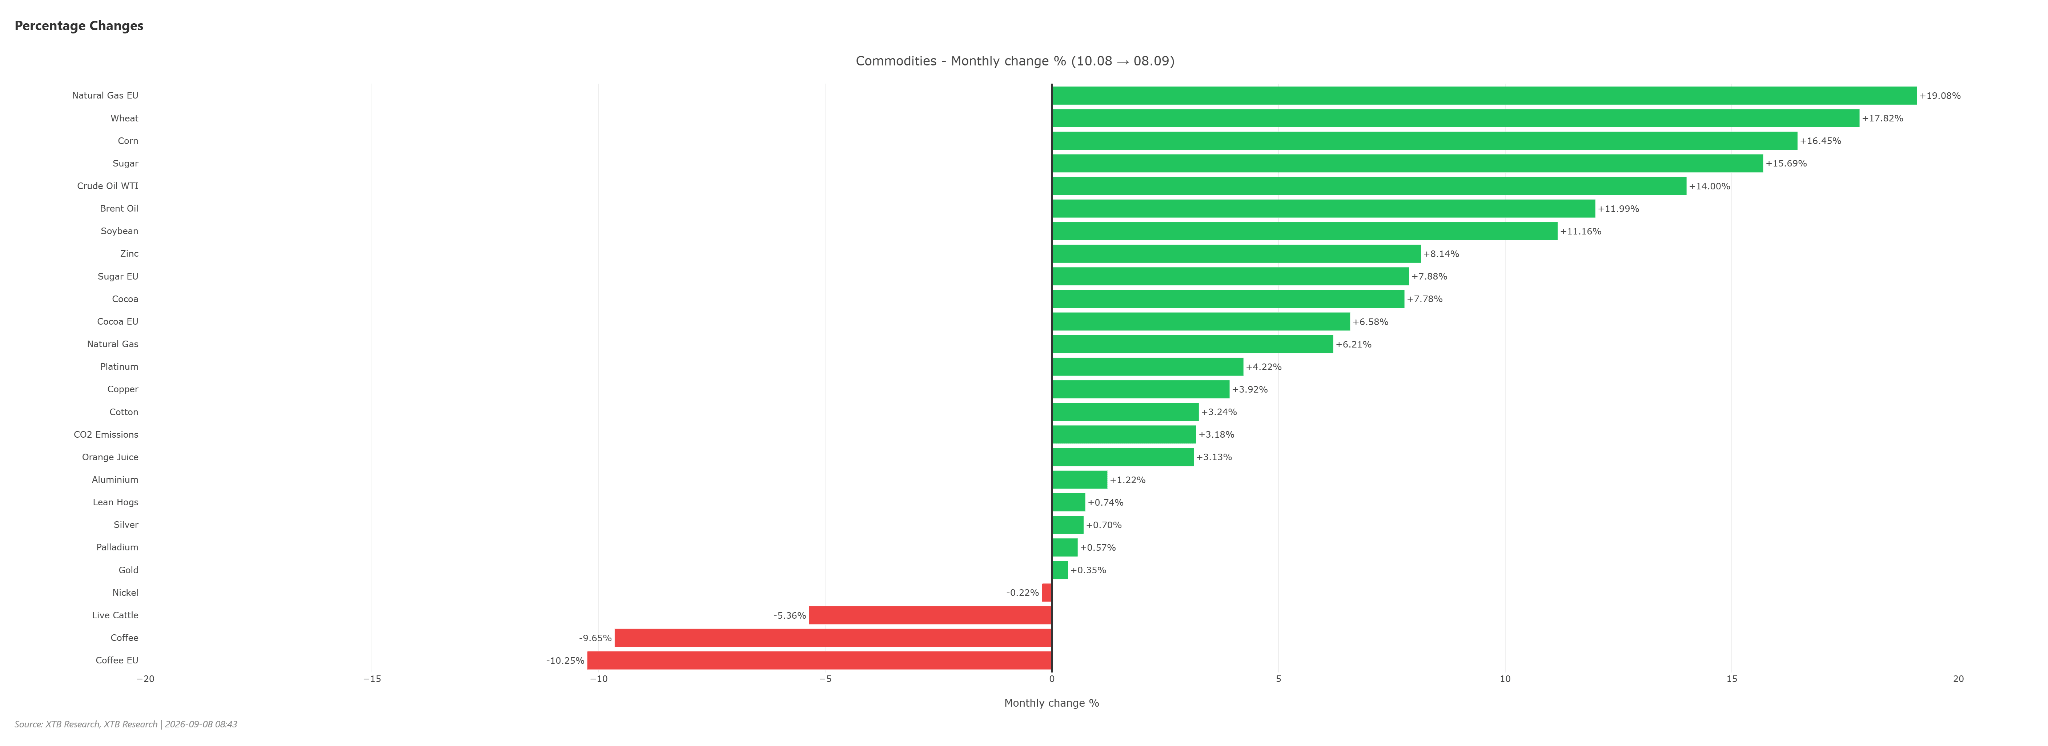
Tanker attacks, the Strait of Hormuz dispute, and record US fuel prices fuel the next wave of the energy crisis. Oil prices on global exchanges are surging, with the valuation of a barrel of Brent dangerously approaching the $100 mark, reaching over $98. The American benchmark, WTI crude, is climbing above $93. The main driver of the recent sharp increases is the rapid escalation of the geopolitical conflict in the Middle East and persistent attacks on refinery infrastructure.
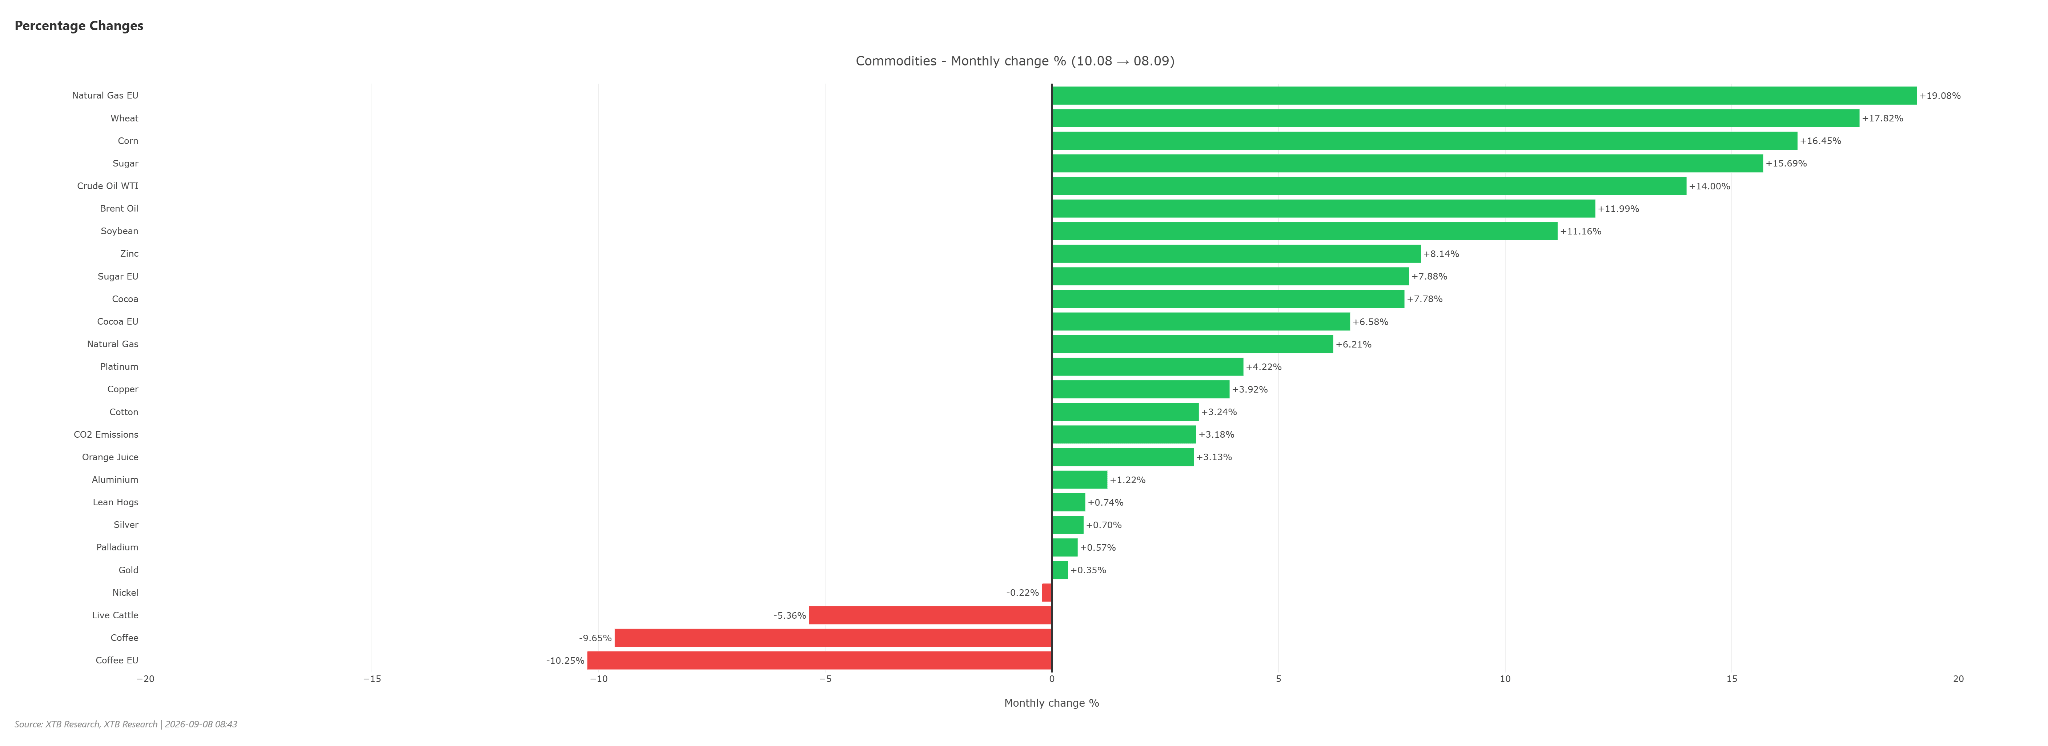
Oil prices have been are rising at a double-digit rate during the last 30 days. Source: XTB
Escalation in the Middle East
The situation in the markets is being exacerbated by direct clashes and an exchange of blows between US and Iranian forces in the Persian Gulf region. Following American strikes on Iranian tankers, Tehran threatened to introduce a maritime exclusion zone and completely change the rules of navigation in the Strait of Hormuz, which is key to global trade. Although Iran is holding talks with Oman regarding a new agreement on ship traffic control and transit fees, investors are skeptical about the chances of rapid stabilization. Rising military risks and potential blockades are dramatically increasing transportation and insurance costs.
Highest US Fuel Price Levels During the Holiday
The oil crisis directly affects consumers’ pockets. In the United States, the average price of gasoline reached a historic high of $4.15 per gallon during the Labor Day weekend, surpassing the previous maximum from 2012 ($3.82). It is worth noting that these are not the record levels for the entire year, as levels of $5 per gallon were recorded in 2022 when the war between Russia and Ukraine began. Diesel fuel has become even more expensive, with its price in the US reaching $5.90 per gallon. The global supply of finished fuels is further depleted by renewed Ukrainian drone attacks on refineries deep inside Russia and strikes on facilities in Saudi Arabia. Analysts at Goldman Sachs and ANZ warn that the illusion of commodity abundance has definitively passed. Given the lack of prospects for an imminent cessation of fighting, investment banks are raising price forecasts and expecting disruptions in oil flow until 2027, not ruling out testing the $120 per barrel level with further intensification of fighting at sea.
Brent Crude Technical Chart
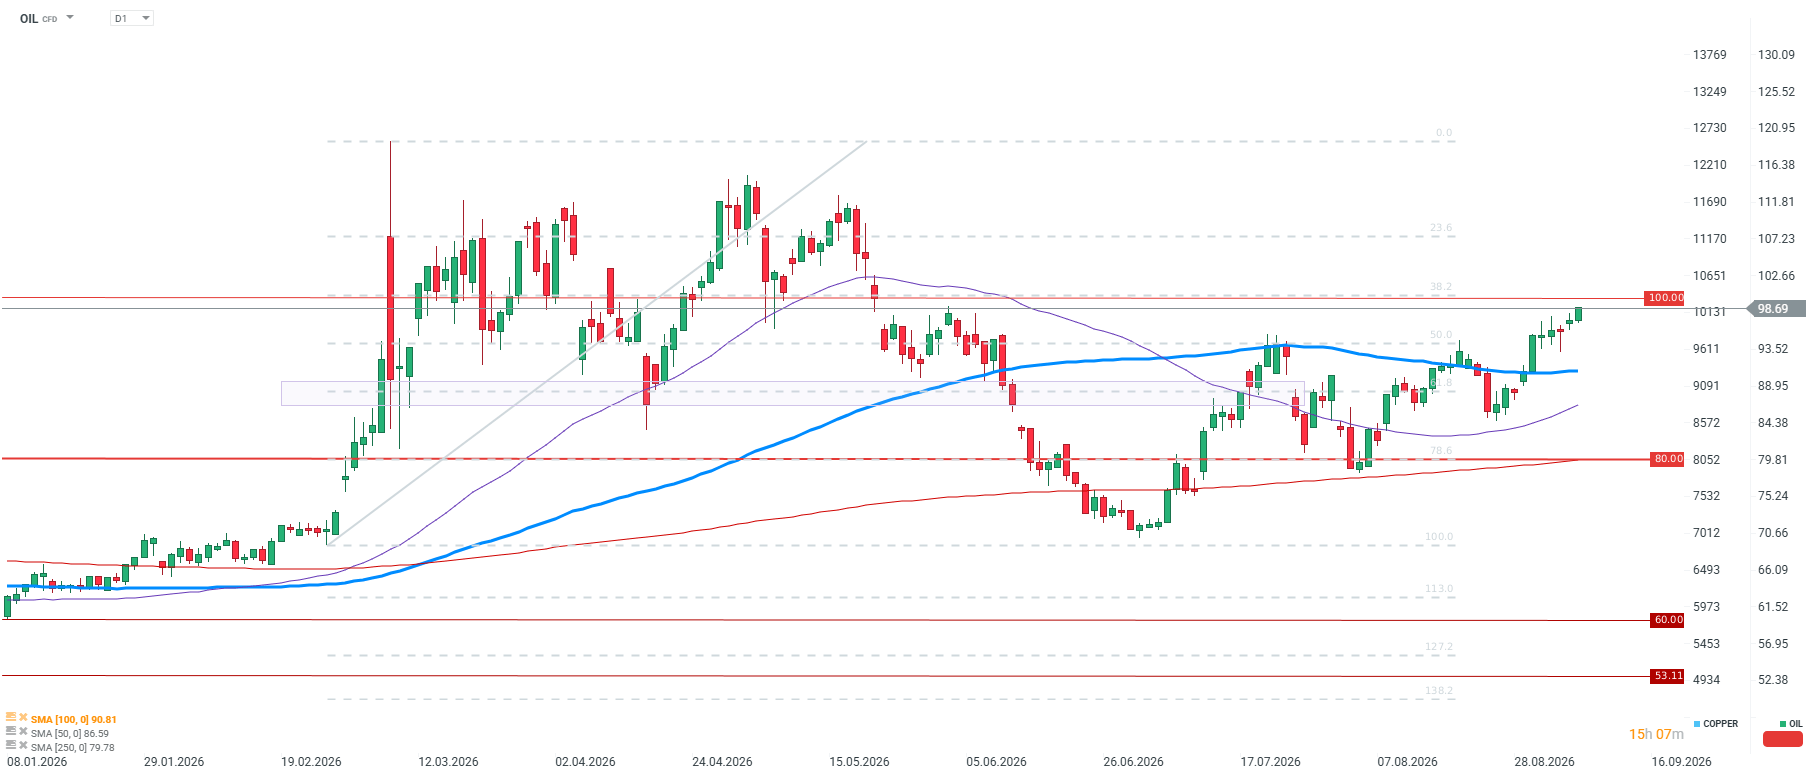
The oil price is in a strong uptrend after defending the low around $70.00 at the turn of June and July. In the current trend, we observe a sequence of higher lows and higher highs. The price is currently testing the key resistance around $98.50–$100.00, and the moving average system (SMA 50, SMA 100, and SMA 250) confirms the dominance of demand.
Key Price Levels:
Resistances:
- $100.00–$101.31: Main psychological barrier and 38.2% Fibo retracement. This is also the zone associated with the supply gap from May
- $107.23: 23.6% Fibo retracement.
- $120.95: This year’s high
Supports:
- $90.81–$94: First defense zone (SMA 100 and 50.0% Fibo).
- $86.59–$88.95: Former resistance (SMA 50 and 61.8% Fibo).
- $79.78–$80.00: Long-term support (SMA 250 and 78.6% Fibo).
Market Scenarios:
- Bullish (continuation): A daily candle close above $101.31 will open the way for increases towards $107.23 and the high at $120.95.
- Corrective: A clear candle wick around $98-$100 may trigger a pullback to the nearest supports in the range of $94