Facts:
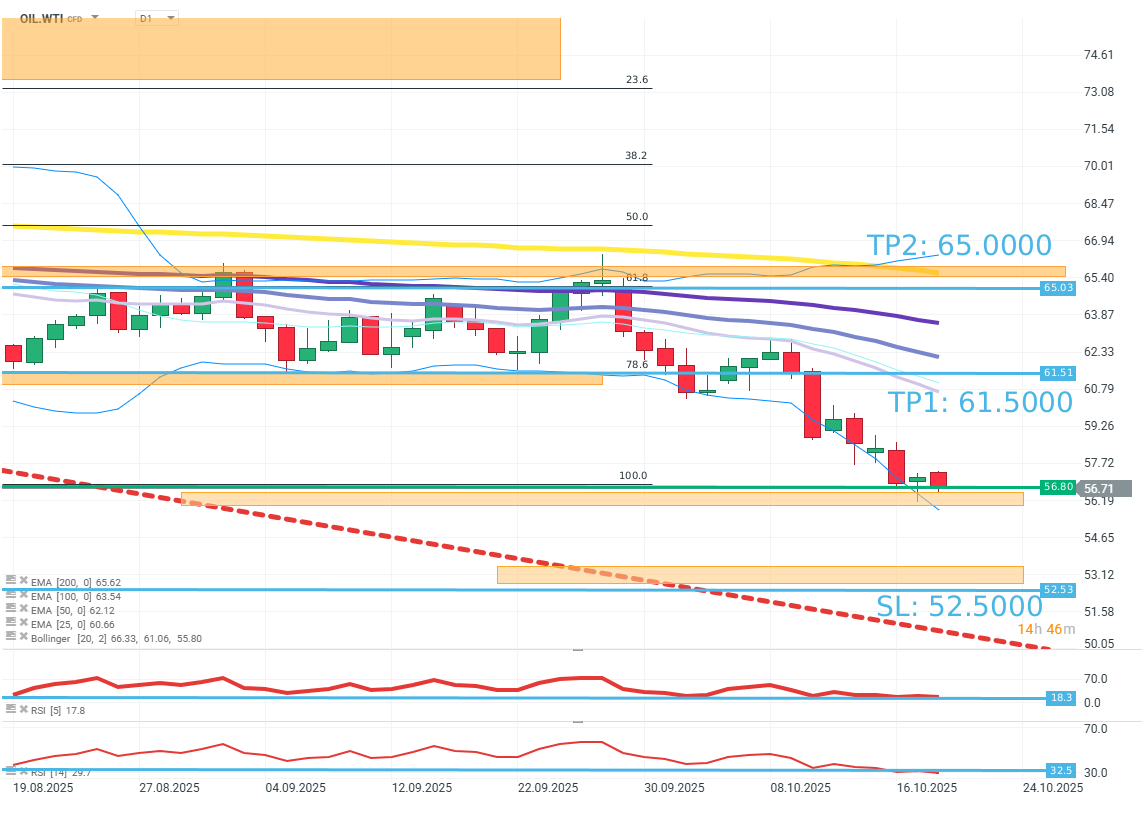
- The WTI Oil price has halted at the lower boundary of the FIBO 100 of the last upward wave.
- The RSI indicators show oversold levels at 18.3 (5) and 32.5 (14).
- The Bollinger Band (20-2) indicates the price has stopped at the lower band of the ribbon.
Recommendation:
Trade: LONG position on OIL.WTI at market price
- Target: TP1 – 61.5000, TP2 – 65.0000
- Stop: SL1 – 52.5000
Source: xStation5
Opinion:
The WTI oil price on the daily interval has stopped at the FIBO 100 level and the lower band of the Bollinger. This corresponds with low RSI levels, creating favorable conditions for a technical upward correction.
Methodology and assumptions:
The recommendation is based on technical analysis of the OIL.WTI chart, particularly the RSI indicator, Fibonacci levels, and Bollinger Bands.
Target level: Take profit 1 is derived from the resistance level at FIBO 78.6 and the presence of the EMA25 average. Take profit 2 is set slightly below the EMA200 average and at the FIBO 61.8 level, above which there is strong resistance for further growth.
The defensive stop loss order is set around the correction from February 2021, the breach of which could negate the scenario of an upward correction.