S&P 500 — US Large Cap Index
 FTSE 100 — UK Blue Chips
 Euro Stoxx 50 — Eurozone Leaders
 DAX 40 — German Equities
 CAC 40 — French Market Index
 Nikkei 225 — Japan Benchmark
 Hang Seng — Hong Kong Index
 Shanghai Composite — China Mainland
 ASX 200 — Australian Market
 TSX Composite — Canada Index
 Nifty 50 — India Large Cap
 STI Index — Singapore Market
 KOSPI — South Korea Index
 Bovespa — Brazil Equities
 JSE Top 40 — South Africa Index
 IPC Index — Mexico Market


- The third-quarter 2026 earnings season is going relatively well. Sixty percent of S&P 500 companies have already released their reports, and 82% of them reported earnings per share above expectations. This is higher than the 5-year average (78%) and the 10-year average (77%). Seventy percent of companies reported revenue above forecasts.
- The S&P 500 index’s aggregate earnings growth for the third quarter (year-over-year) stands at 30.2%, up from 29.1% at the end of September. If this trend continues, it will mark the third consecutive quarter with earnings growth above 25% and the eighth consecutive quarter with double-digit growth. All 11 sectors are reporting earnings growth.
- In October, analysts raised their fourth-quarter earnings forecasts by 1.4%. Typically, forecasts are lowered in the first month of the quarter: by an average of 1.1% over the past 5 years and by 1.9% over the past 20 years. This is the third consecutive quarter in which forecasts have risen in the first month of the quarter.
- The forward P/E ratio for the S&P 500 has fallen to 18.7. This is below the 5-year average (19.8) and the 10-year average (19.1). Since the end of September, the index has gained only 0.9%, while the 12-month forward earnings per share forecast has risen by 2.5% during that time.
- Only 40% of the companies that provided forecasts for the fourth quarter lowered their estimates. The 5-year average is 60%.
Recommendation: Long position on US500 (S&P 500) at market price Stop Loss: 7,379 points Take Profit: 7,624.8 points Take Profit 2: 7,800 points Opinion:
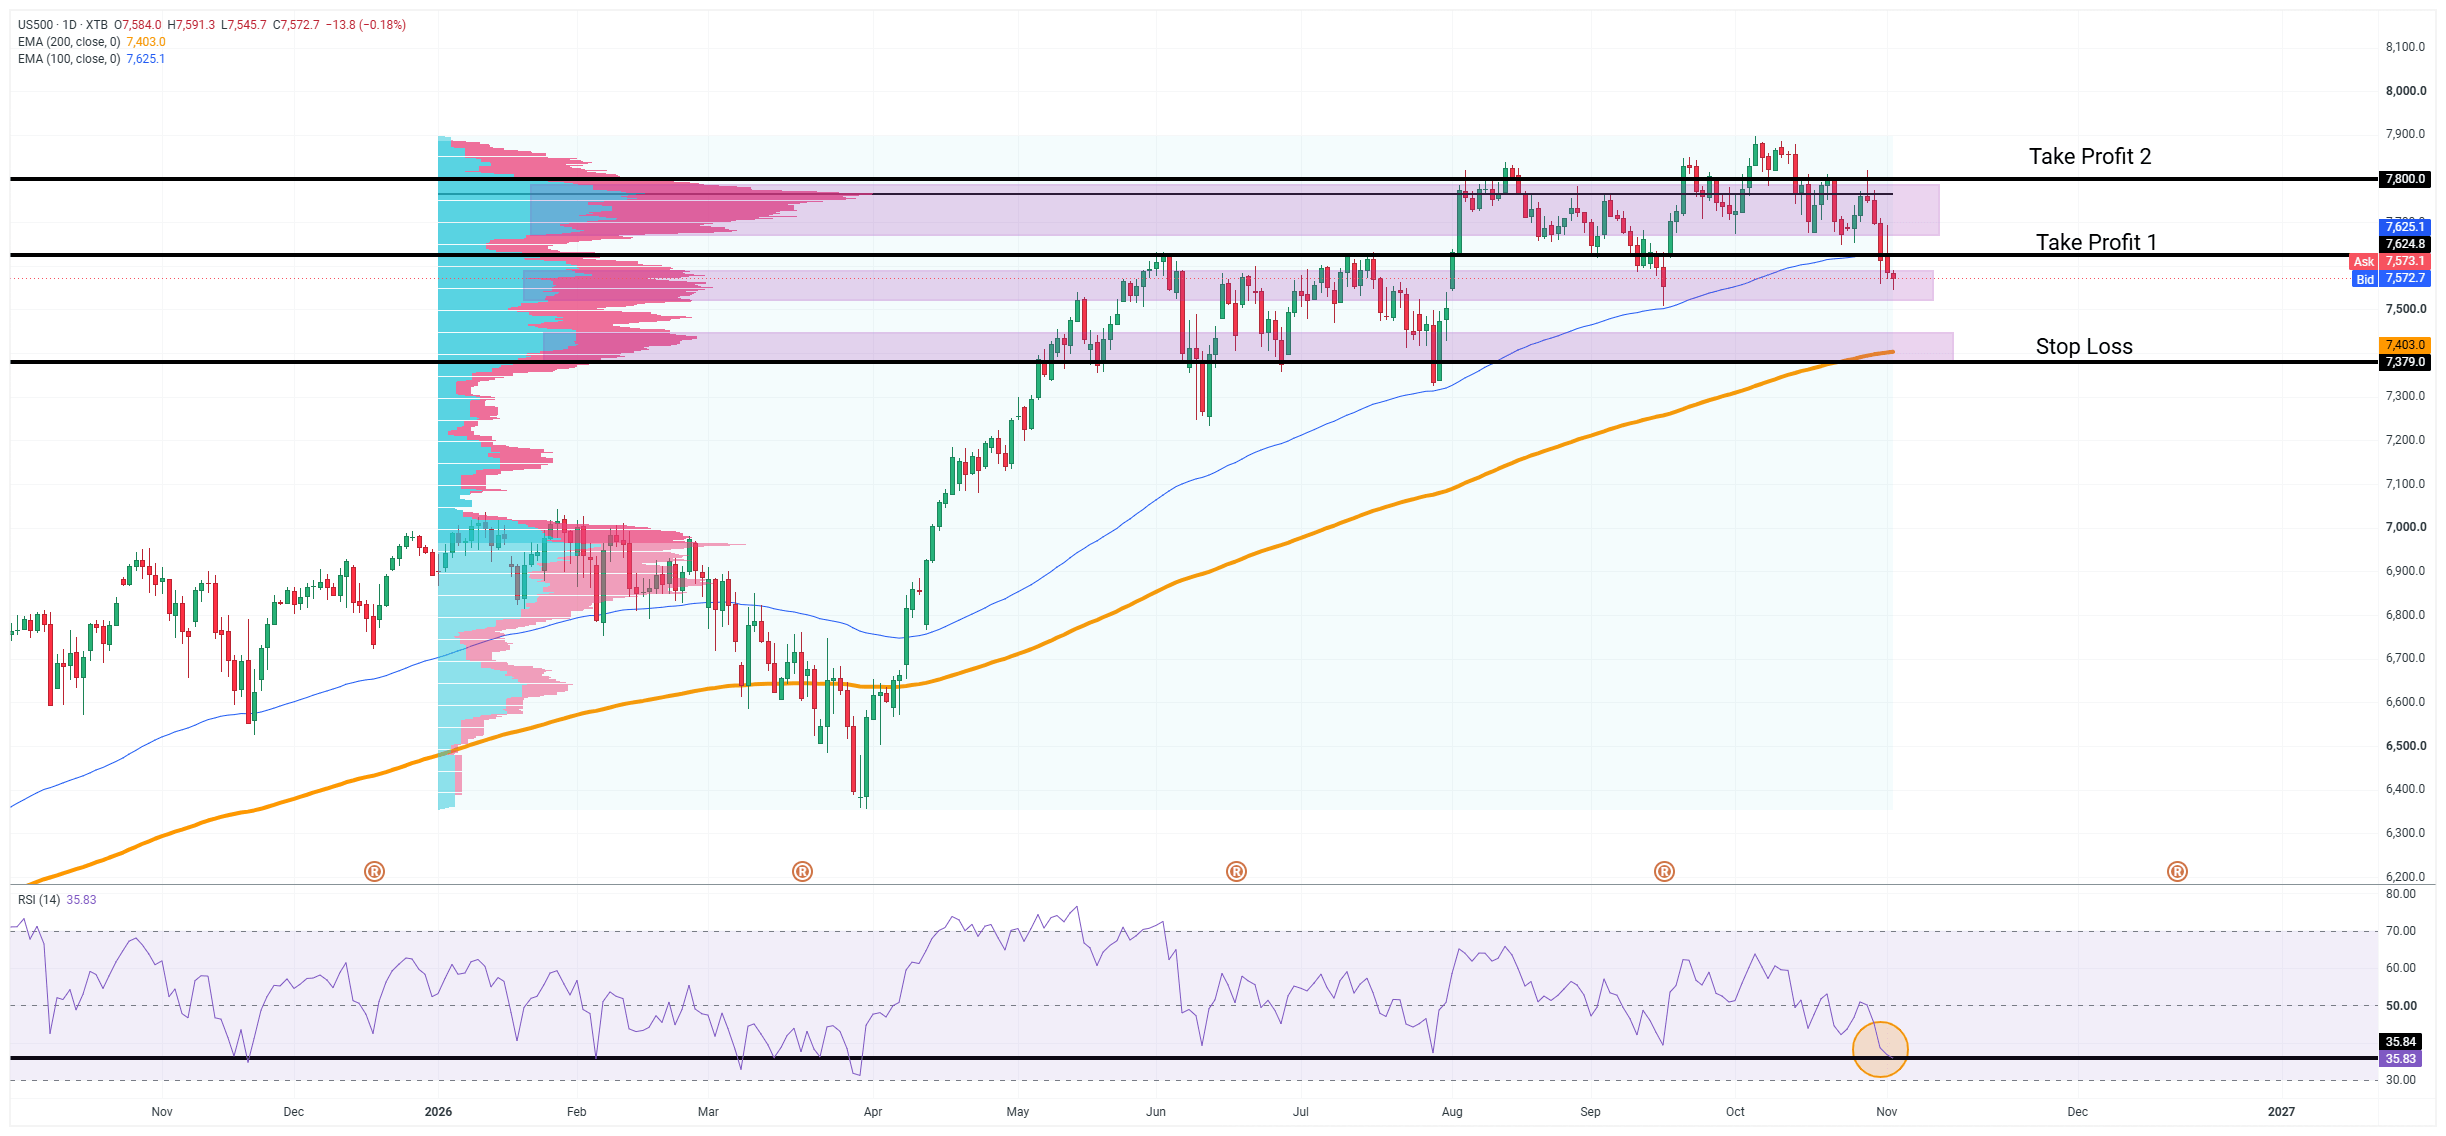
The decision to take a long position on the S&P 500 index stems primarily from the growing divergence between improving corporate earnings and declining market valuations. The ongoing third-quarter earnings season is among the strongest in recent years. The percentage of companies beating earnings estimates (82%) exceeds historical averages, and the index’s earnings growth (30.2% year-over-year) is more than double the 5-year average (13.3%). Net margins of 14.9% are the second-highest since 2009, and revenue has been growing at a double-digit rate for the third consecutive quarter. The market is rewarding strong results more strongly than usual: companies that beat estimates gained an average of 1.6%, compared to the 5-year average of 0.9%. Companies that disappointed, on the other hand, were punished more leniently than usual.
The direction of the forecast revisions is particularly important. In the first month of the quarter, analysts typically cut their earnings estimates; however, in October, they raised their forecast for the fourth quarter by 1.4% and for all of 2026 by 0.6%. Forecasts in the first month of the quarter have been rising for the third consecutive quarter and for the fifth time in the last six quarters. This is confirmed by the companies’ own forecasts: only 40% of companies lowered their estimates for the fourth quarter, compared with a 5-year average of 60%. Despite such strong data, market valuations have fallen significantly. The forward P/E ratio of 18.7 is below both the 5-year and 10-year averages, and since the end of September, projected earnings have grown nearly three times faster than the index (2.5% versus 0.9%).
The market is thus becoming cheaper, even as corporate earnings are rising. The weaker results of some companies in the “Magnificent 7” group are largely due to one-time accounting events under GAAP. Meta recorded legal settlement costs of $9.89 billion, and Alphabet recorded a loss from stock valuation of $8.7 billion. This does not indicate a deterioration in their operating performance. The remaining 493 companies in the index increased their earnings growth rate from 27.8% to 32.6% during this period, showing that the growth is spreading to an increasingly broader segment of the market. Analysts’ aggregate price target for the S&P 500 (9,327.8 points) indicates approximately 21% upside potential over a 12-month horizon. Technical indicators also support a long position. Following a pullback from the upper end of the consolidation range, prices returned to the high-volume zone on the volume profile, in the 7,520–7,600 point range, where buyers had actively defended their positions in previous months. The RSI has fallen to around 35.8, a level at which local declines have repeatedly ended and rebounds have begun since the end of 2025.
The stop-loss was set at 7,379 points, just below the 200-day exponential moving average (EMA200, approx. 7,403 points) and the lower support zone of the volume profile. A sustained break below these levels would undermine the scenario of an uptrend continuation. The first target is the 100-day exponential moving average (EMA100) around 7,625 points, which also marks the lower boundary of the previous consolidation. The second target is 7,800 points, i.e., the upper part of this zone, near this year’s highs. Methodology and Assumptions: This recommendation is based on a technical and fundamental analysis of the US500 (S&P 500) chart. To assess the situation and analyze the trend, we used classical technical analysis (support and resistance levels, volume profile, moving averages, and the RSI indicator) as well as fundamental analysis (companies’ quarterly results, earnings forecast revisions, and valuation ratios).