S&P 500 — US Large Cap Index
 FTSE 100 — UK Blue Chips
 Euro Stoxx 50 — Eurozone Leaders
 DAX 40 — German Equities
 CAC 40 — French Market Index
 Nikkei 225 — Japan Benchmark
 Hang Seng — Hong Kong Index
 Shanghai Composite — China Mainland
 ASX 200 — Australian Market
 TSX Composite — Canada Index
 Nifty 50 — India Large Cap
 STI Index — Singapore Market
 KOSPI — South Korea Index
 Bovespa — Brazil Equities
 JSE Top 40 — South Africa Index
 IPC Index — Mexico Market

Facts
- US core CPI inflation fell to its lowest level since February (2.5%) in July. The 3-month annualised average fell to 1.6%. The August report is scheduled for publication on 11 September.
- The market-implied probability of a Fed interest rate hike in September increased to 60% following the release of the NFP report.
- The price of gold has risen by approximately 10% from its July lows.
- The RSI (14) indicator does not suggest that USDZAR is oversold.
Recommendation
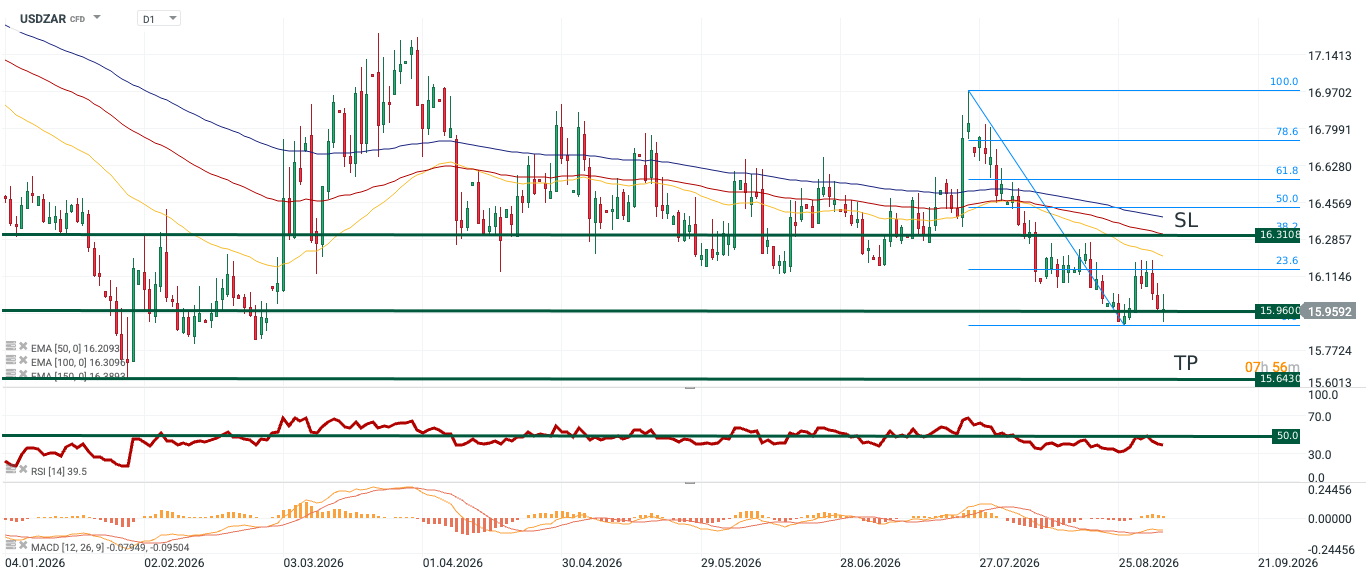
- Position: Short (SELL) on USDZAR at market price (15.9600).
- Take Profit (TP): 15.6430
- Stop Loss (SL): 16.3108
Figure 1: USDZAR (04.01.2025 – 04.09.2026)
Source: xStation, 04.09.2026 (3:22 PM)
Opinion
Over the last month, the South African rand has strengthened against the US dollar by over 2.5%. The reasons for this movement can be found in two key factors: rising gold prices and an increase in bets for interest rate hikes by the SARB. Figure 2: USDZAR (Reverse Axis) and Gold (2021 – 2026)
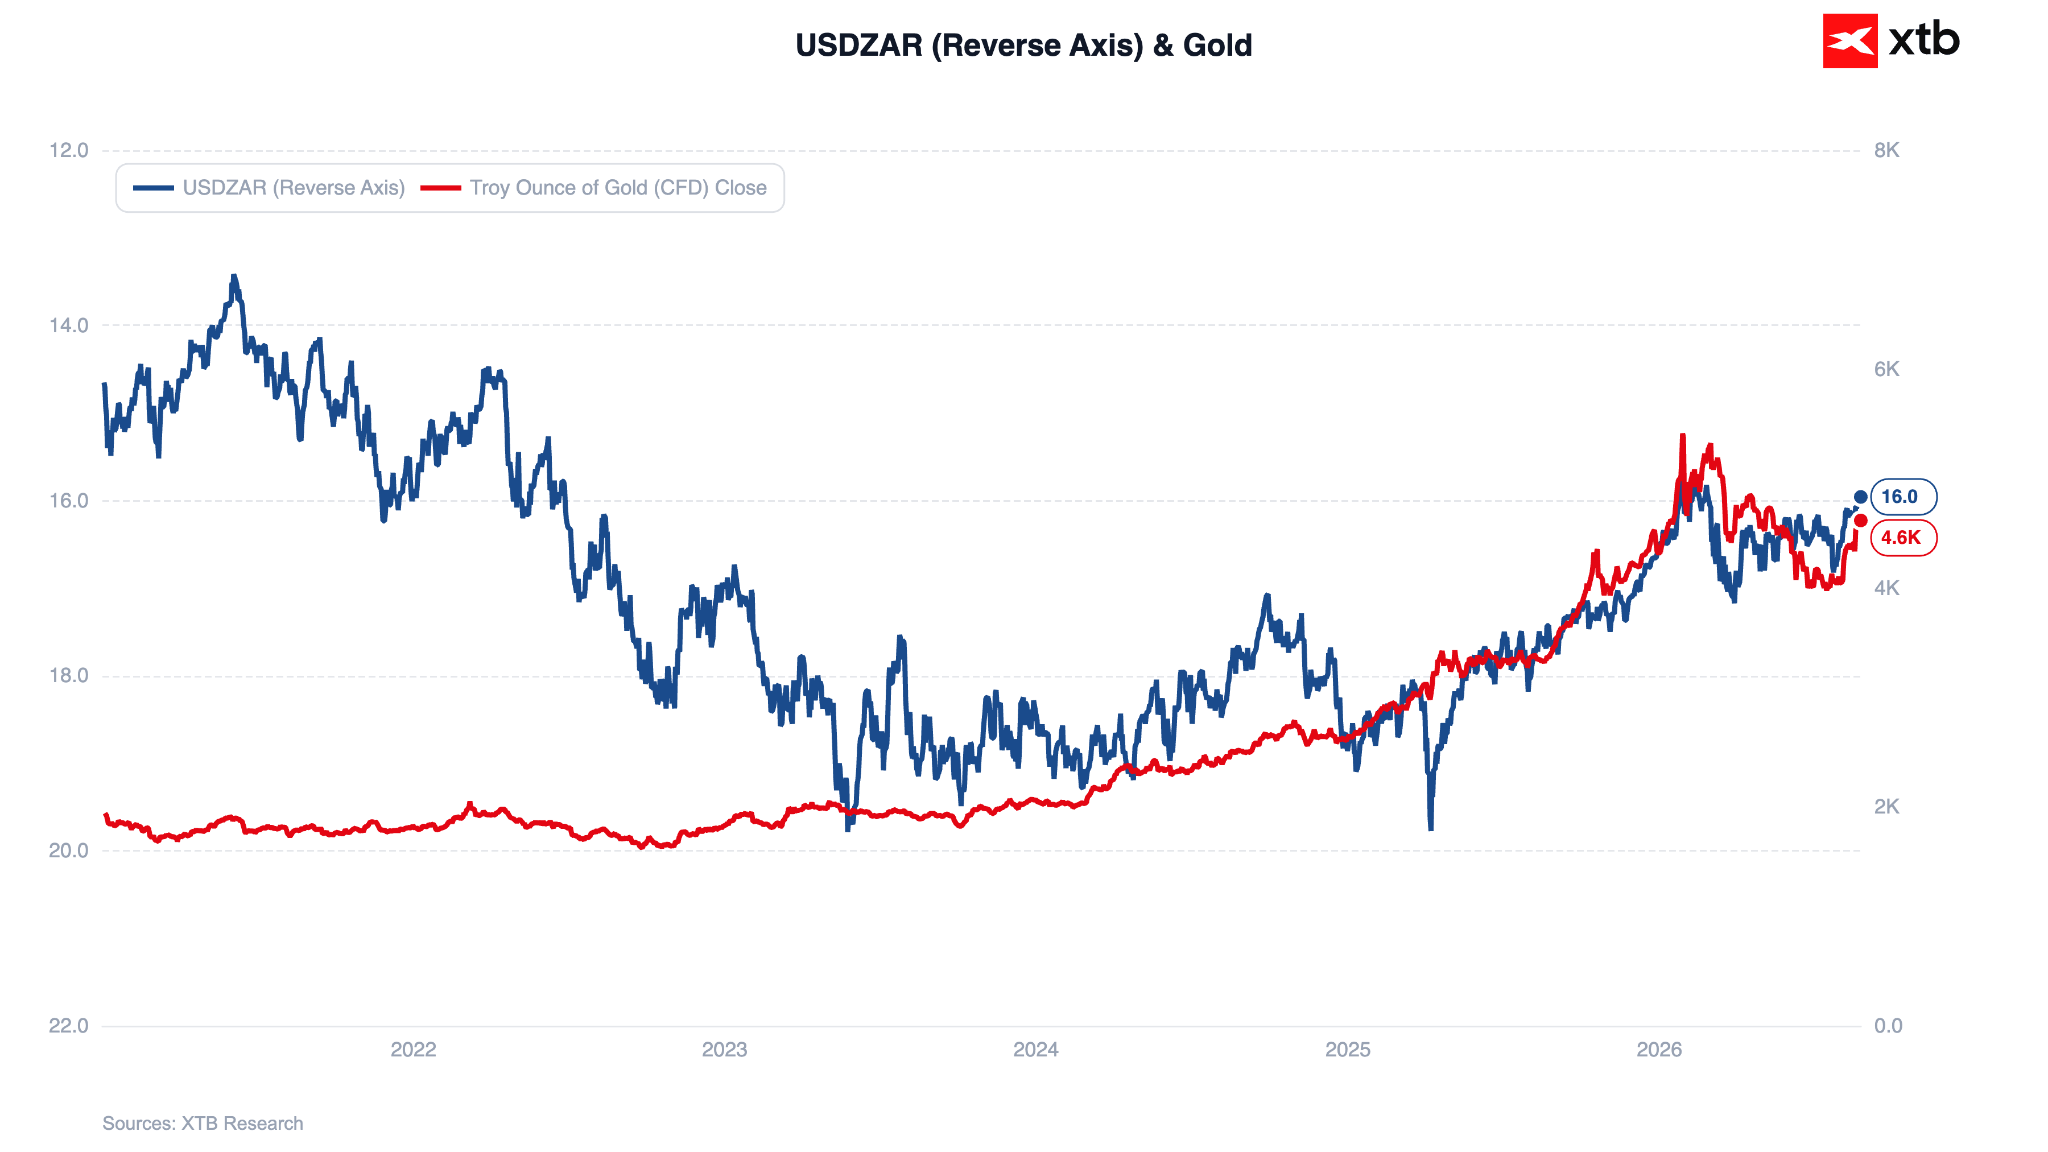
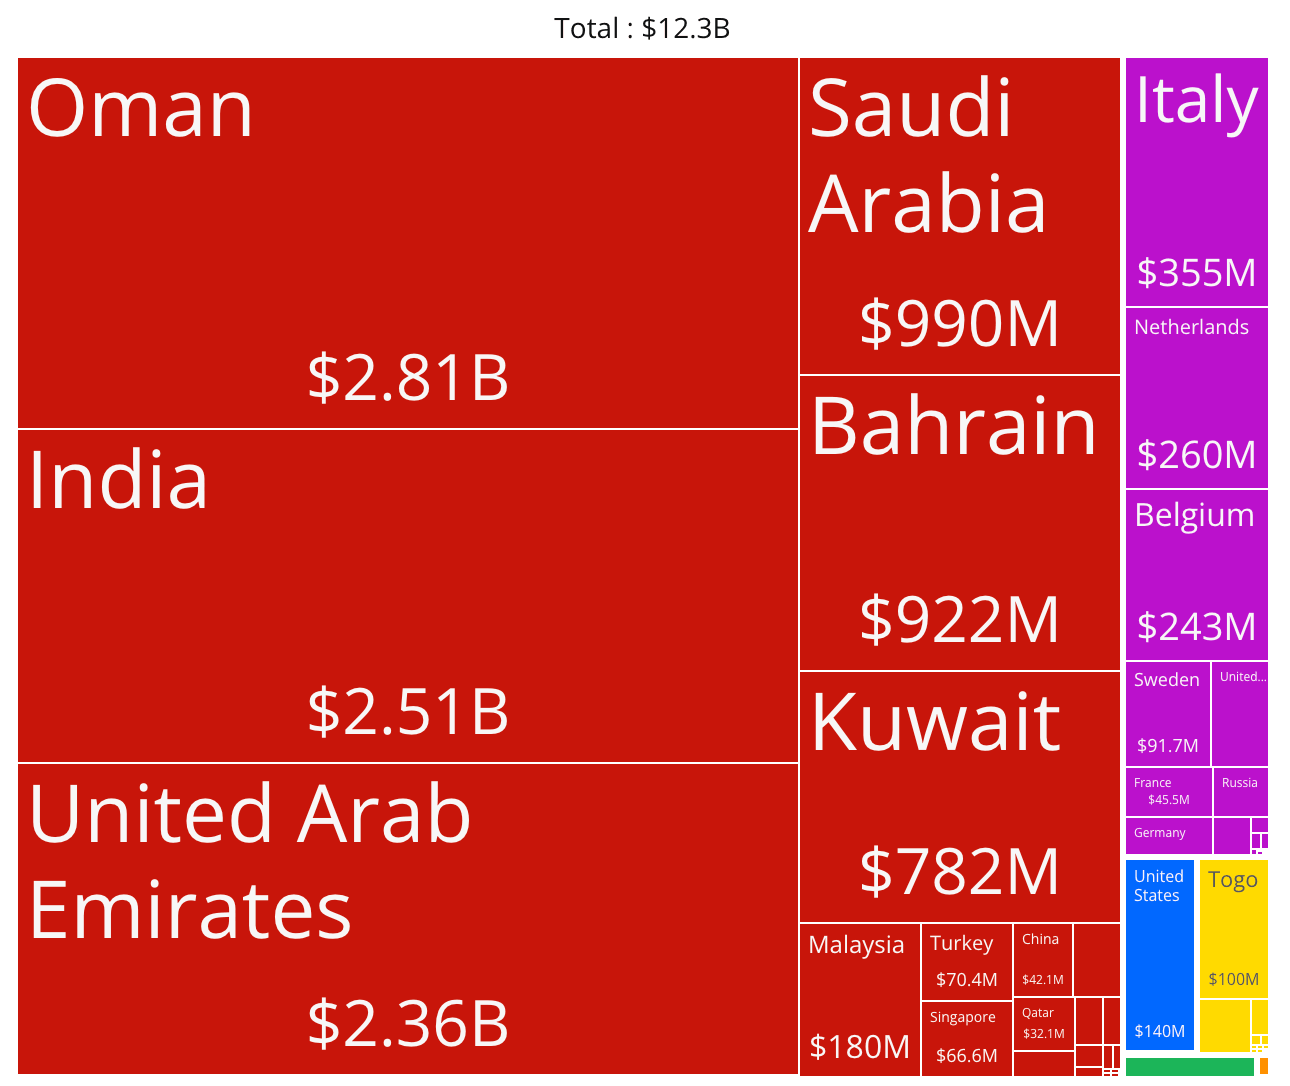
Source: XTB Research, 04.09.2026 The period of greatest difficulty for the South African energy sector is behind us. Since Eskom restored stable energy supplies, the correlation between the price of gold and the rand exchange rate has strengthened once again. The precious metal has recently returned to favour among investors, driven by, among other things, a decline in investor confidence regarding American institutionalism. If interest rates are not hiked at the upcoming Fed meeting (16 September), gold should continue to gain. Recently, President Donald Trump has been pushing harder for a pause (or even a cut, although this seems unlikely). His statements are doubly beneficial for gold; they lead to a withdrawal of some bets on rate hikes, while also limiting faith in the independence of American institutions (strengthening the so-called debasement trade). A few days after the Fed meeting, the SARB meeting will take place (23 September). During the last vote (23 July), as many as 2 out of 6 policymakers voted in favour of a hike. Due to South Africa’s high dependence on energy commodity imports, the lack of easing tensions in the Middle East is having a marked impact on domestic inflation. In July, the core measure rose for the 5th time in a row, standing at 4.2%. A rate hike by the SARB in September is currently our base scenario. In a scenario where the United States and Iran reach a quick agreement that at least partially unblocks the Strait of Hormuz, the probability of a rate hike by the SARB naturally decreases. However, such a development should lead to a broad improvement in market sentiment, strengthening emerging market currencies. Currencies of countries highly dependent on imports from Middle Eastern countries should gain particularly strongly from the fall in energy commodity prices (the rand is in this group; approximately 65% of South Africa’s refined oil imports come from this region). We have observed such a regularity in recent months.
Figure 3: Structure of South African Refined Oil Imports (2024)
Source: OEC, 04.09.2026
Methodology
The recommendation was prepared based on fundamental analysis of macroeconomic data from the USA and South Africa and their assessment in the context of market valuations for interest rate hikes by the Federal Reserve and the SARB. The direction of the recommendation was determined using an assessment of the outlook for the aforementioned valuations and an analysis of the situation in the precious metals market. Take Profit and Stop Loss levels were determined using moving averages, Fibonacci retracements (SL at 16.3108, near EMA 100 and Fibo 38.1) and local lows (TP at 15.6430, around the January low).