S&P 500 — US Large Cap Index
 FTSE 100 — UK Blue Chips
 Euro Stoxx 50 — Eurozone Leaders
 DAX 40 — German Equities
 CAC 40 — French Market Index
 Nikkei 225 — Japan Benchmark
 Hang Seng — Hong Kong Index
 Shanghai Composite — China Mainland
 ASX 200 — Australian Market
 TSX Composite — Canada Index
 Nifty 50 — India Large Cap
 STI Index — Singapore Market
 KOSPI — South Korea Index
 Bovespa — Brazil Equities
 JSE Top 40 — South Africa Index
 IPC Index — Mexico Market

- XAG/USD trades near $66.00 on Monday after bouncing from $63.50 lows on Friday.
- Weak US data curbed hopes of a September Fed rate hike and weighed on the US Dollar last week.
- The key resistance area for Silver bulls is around $67.00.
Silver (XAG/USD) trades on a strong footing on Monday, reaching levels above $65.80 at the European session opening times, after bouncing from the $63.50 area on Friday. Precious metals are being boosted by US Dollar (USD) weakness, as recent US macroeconomic data has curbed hopes of Federal Reserve (Fed) interest rate hikes this year.
US data released on Friday endorsed this view, as July’s Retail Sales dropped 0.6% against market expectations of a 0.1% gain, following a 0.2% increase in June. These figures follow relatively soft producer and consumer price figures released earlier in the week and another disappointment in Nonfarm Payrolls in the previous week. Against this background, investors have dialed back bets of a Fed hike in September to 30%, from above 50% one week ago, according to data by the CME Group’s FedWatch Tool.
Technical Analysis: Key resistance is at the $67.00 area
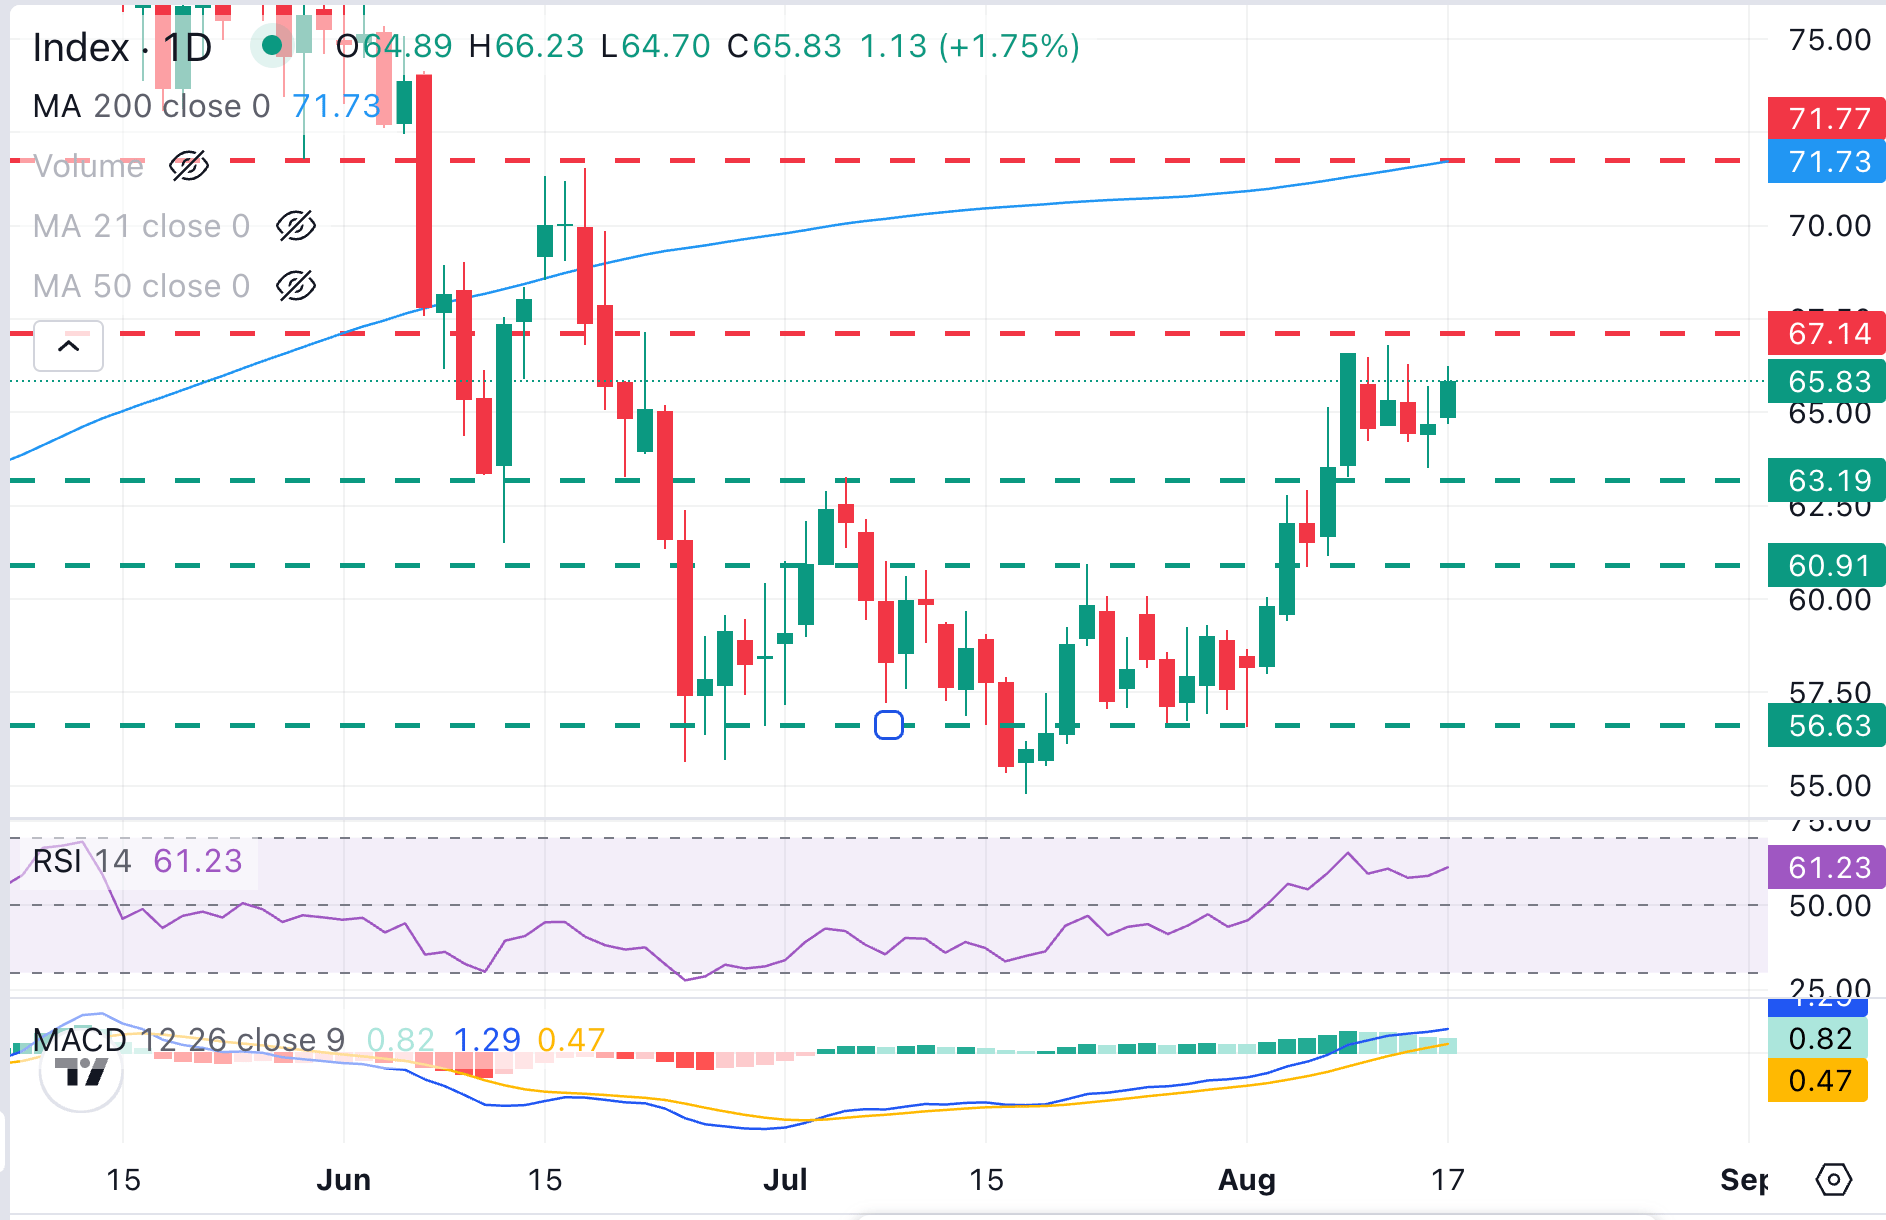
XAG/USD reached the target of a bullish Head & Shoulders pattern at the $67.00 area last week, and has been consolidating ever since, with bearish attempts limited above previous highs, at $63.30. The pair, thus, holds a constructive near-term pattern and momentum indicators in the daily chart remain within bullish territory. The Relative Strength Index (14) is hovering above 60, and the Moving Average Convergence Divergence (MACD) line maintains a firm positive reading near 0.81, highlighting persistent upside pressure.
Bulls remain capped below the $66.00 area on Monday, which is closing the path towards the June 22 high, at $67.17. Further up, there is a heavier supply zone defined by the June 17 high, at $71.56, and the 200-day Simple Moving Average (SMA) around $71.70.
On the downside, the mentioned $63.30 area is expected to challenge bears, ahead of the August 6 and 7 lows, around $62.00 and the late July lows, in the mid-range of the $56.00s.